Addie Beach
As your application grows in complexity, identifying the root cause of issues becomes increasingly difficult. Many monitoring strategies make this even harder by siloing frontend and backend data. To effectively troubleshoot problems that spread across your app, you need visibility not just into each part of your stack, but also into how these parts interact.
For example, synthetic monitoring and distributed tracing let you analyze your app from different perspectives. Distributed tracing focuses on the backend, tracking requests as they propagate throughout your system. In contrast, synthetic monitoring helps you better understand your frontend user experience via simulated tests that identify bottlenecks within user journeys. Many teams tend to use these tools separately. However, by integrating tracing into your synthetic testing strategy, you can gain a more complete picture of your system and proactively fix issues before they reach production.
In this post, we’ll explore how you can:
Lower your MTTR across synthetic test types
Distributed tracing helps you investigate issues faster by connecting telemetry data from throughout your system. Unlike traditional methods of tracing, which focus solely on following backend requests, distributed tracing connects these requests to the frontend sessions that generated them. This allows you to quickly analyze UX issues, working your way from their impact on individual user sessions to their underlying causes (and vice versa).
While distributed traces are often used to troubleshoot real user data, you can use tracing with synthetic tests to catch problems before they reach users. There are a few basic forms of synthetic monitoring:
| Type | Focus |
|---|---|
| Availability monitoring | The availability or uptime of specific critical services, often to ensure a specific SLO is being met |
| Performance monitoring | Metrics that correlate closely with user experience, including Core Web Vitals |
| User journey monitoring (aka transaction monitoring) | The flow of key journeys within your app, such as logging into an account or completing a purchase |
Distributed tracing can work side by side with each type of monitoring, letting you quickly analyze issues across a wide range of impact severities.
For example, availability monitoring tests are often used to detect critical problems that could prevent users from accessing crucial parts of your app. Availability test failures may be associated with specific exceptions or status codes, such as 4xx and 5xx codes, invalid query exceptions, and hostname resolution errors. With distributed tracing, you can find the exact point in your stack where an error was generated and determine which services were involved.
At the other end of the spectrum, while performance monitoring tests can uncover larger incidents, developers often use them to highlight less urgent improvements that can enhance user satisfaction. These optimizations might include reducing the rendering time of complex animations or removing unnecessary UI elements that slow page loads. Distributed tracing provides detailed request timing data, enabling you to see which areas of your system are causing poor performance. For example, you can determine whether a poor largest contentful paint (LCP) score is caused by slow server responses or inefficient JavaScript or CSS code.
Finally, because user journey monitoring touches on so many areas of your app, these tests can be used to surface both critical issues that completely block workflows, as well as potential areas for optimization. This versatility makes distributed tracing especially useful. If a user journey uncovers multiple problems of varying severities affecting the same request, you can view them together within a single flame graph to understand how (or whether) they’re connected.
Integrate traces into your synthetic tests with Datadog
While distributed tracing can be a valuable addition to your synthetic monitoring strategy, constantly pivoting between testing and application monitoring tools can be frustrating. Additionally, these tools may be owned and maintained by different teams, making it difficult to cross-reference findings.
Datadog simplifies this process by bringing together your tracing and synthetic monitoring insights, helping you proactively test and troubleshoot throughout the development process. Datadog Synthetic Monitoring allows teams across your organization to quickly create code-free web and mobile app tests across a variety of browsers, platforms, and devices. To streamline this process, our end-to-end Synthetic Monitoring platform gives you a series of templates you can use to build tests that monitor your app’s availability, performance, and usability.
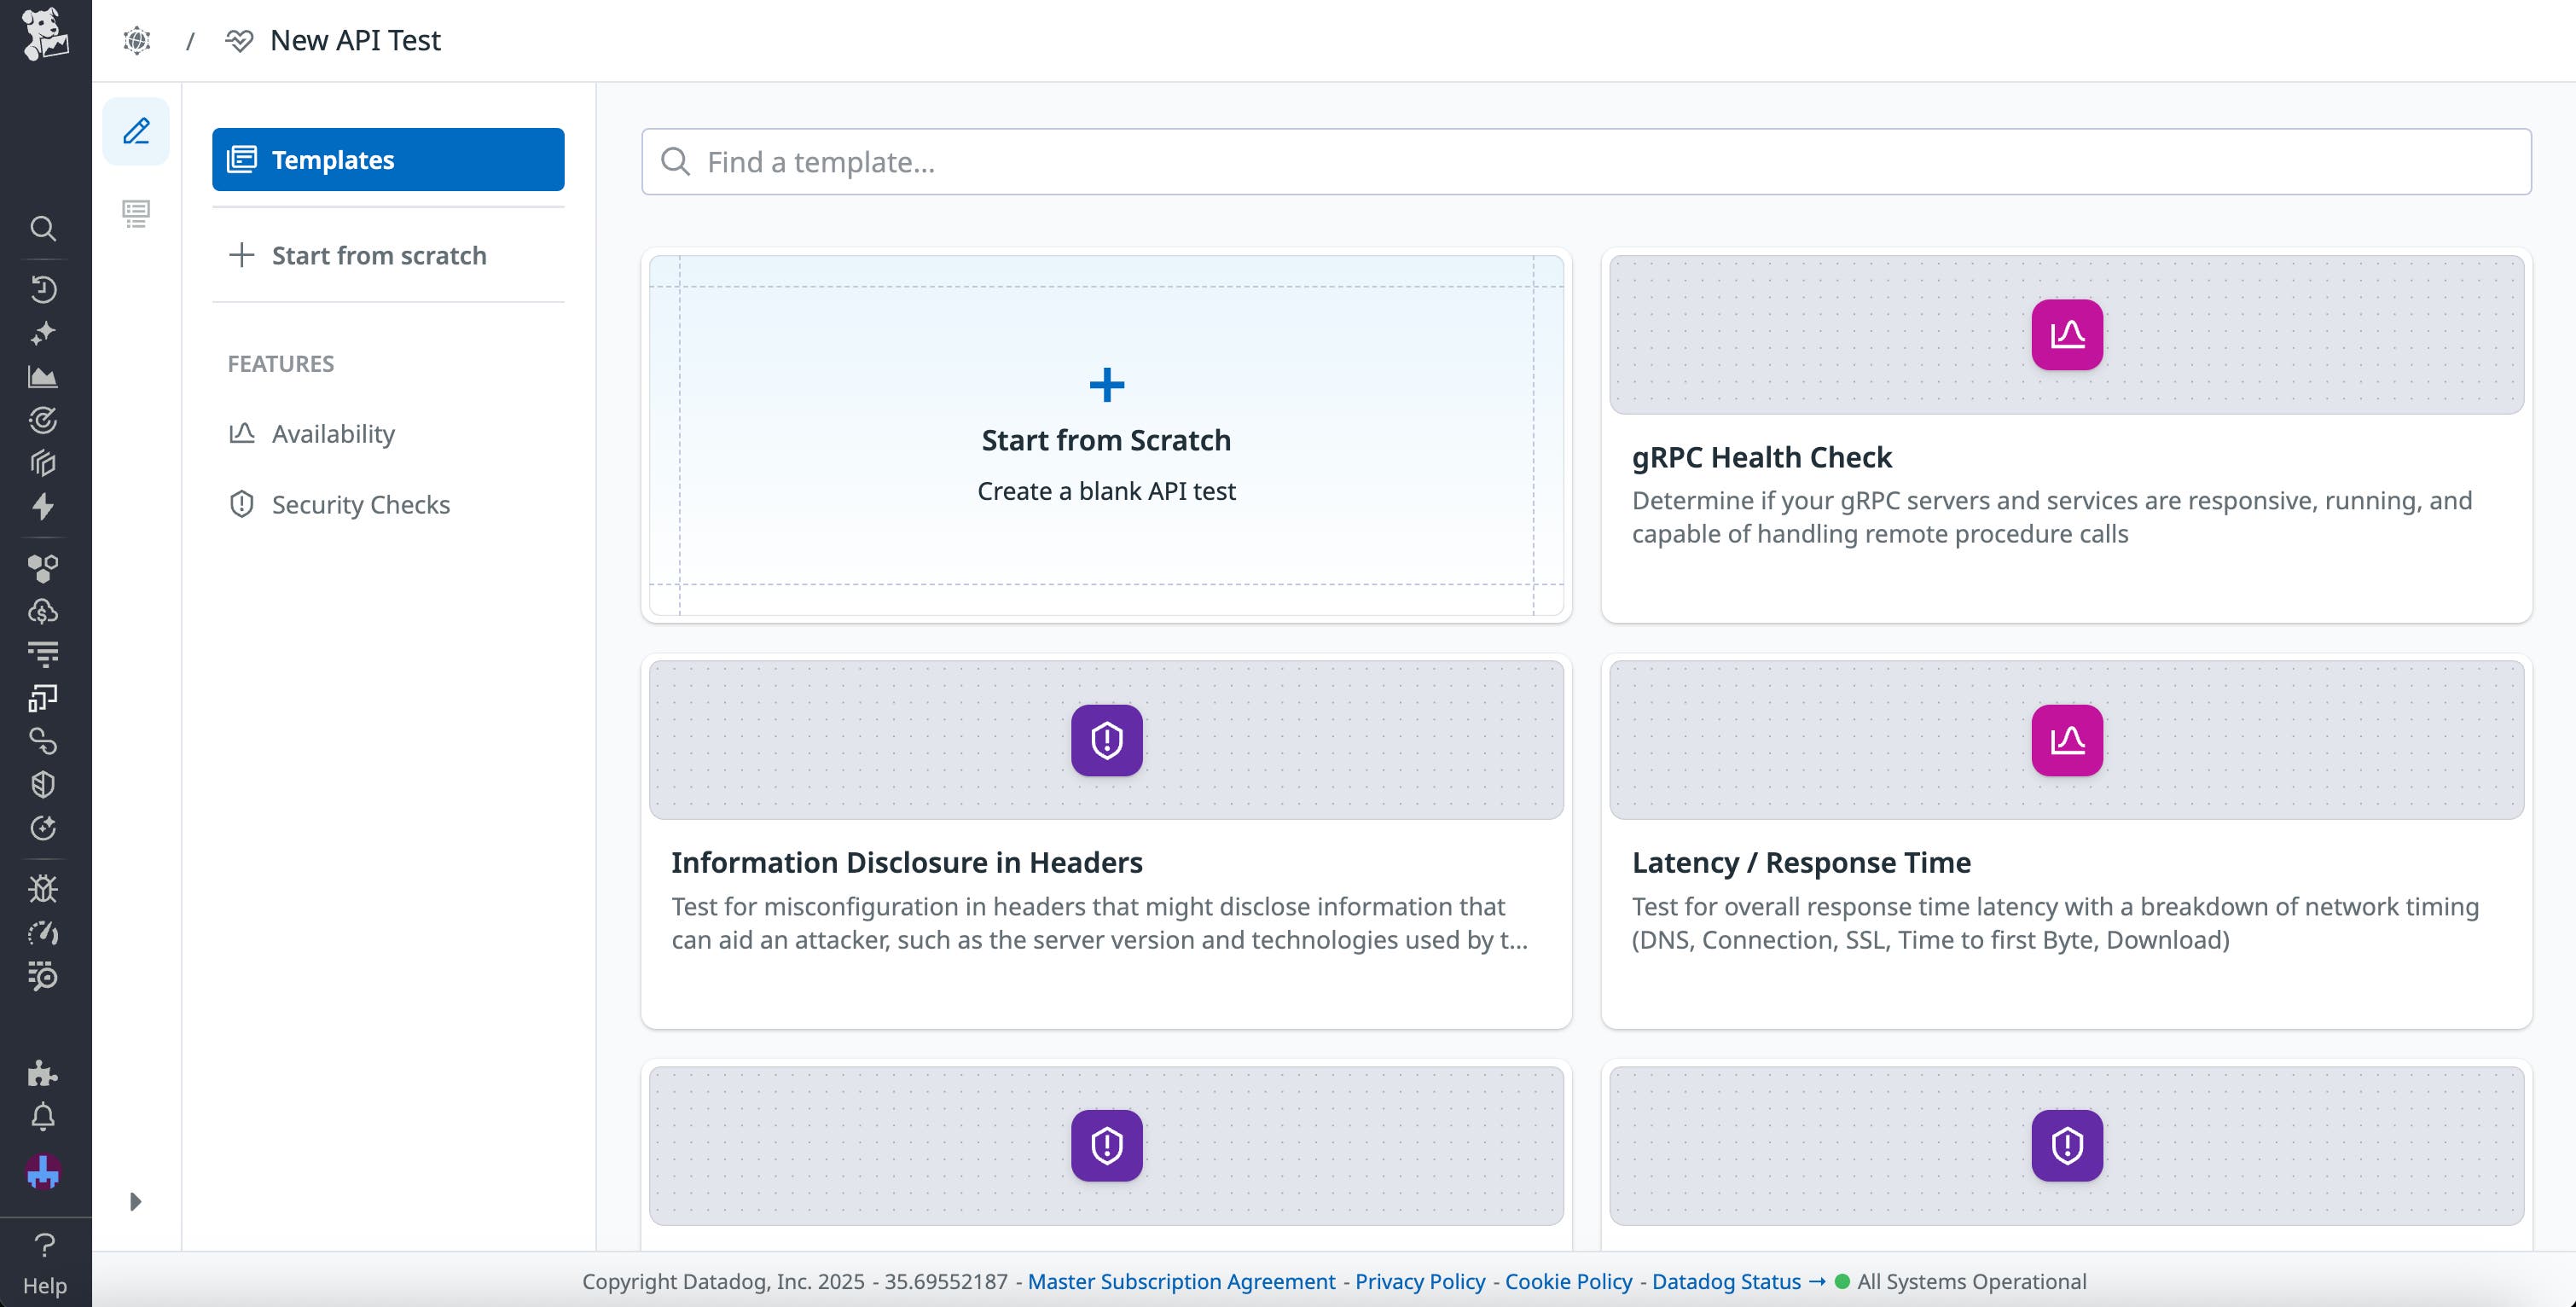
Additionally, you can use Datadog APM to decide which areas of your app to test on, enabling you to identify services that regularly receive heavy traffic or experience the most errors.
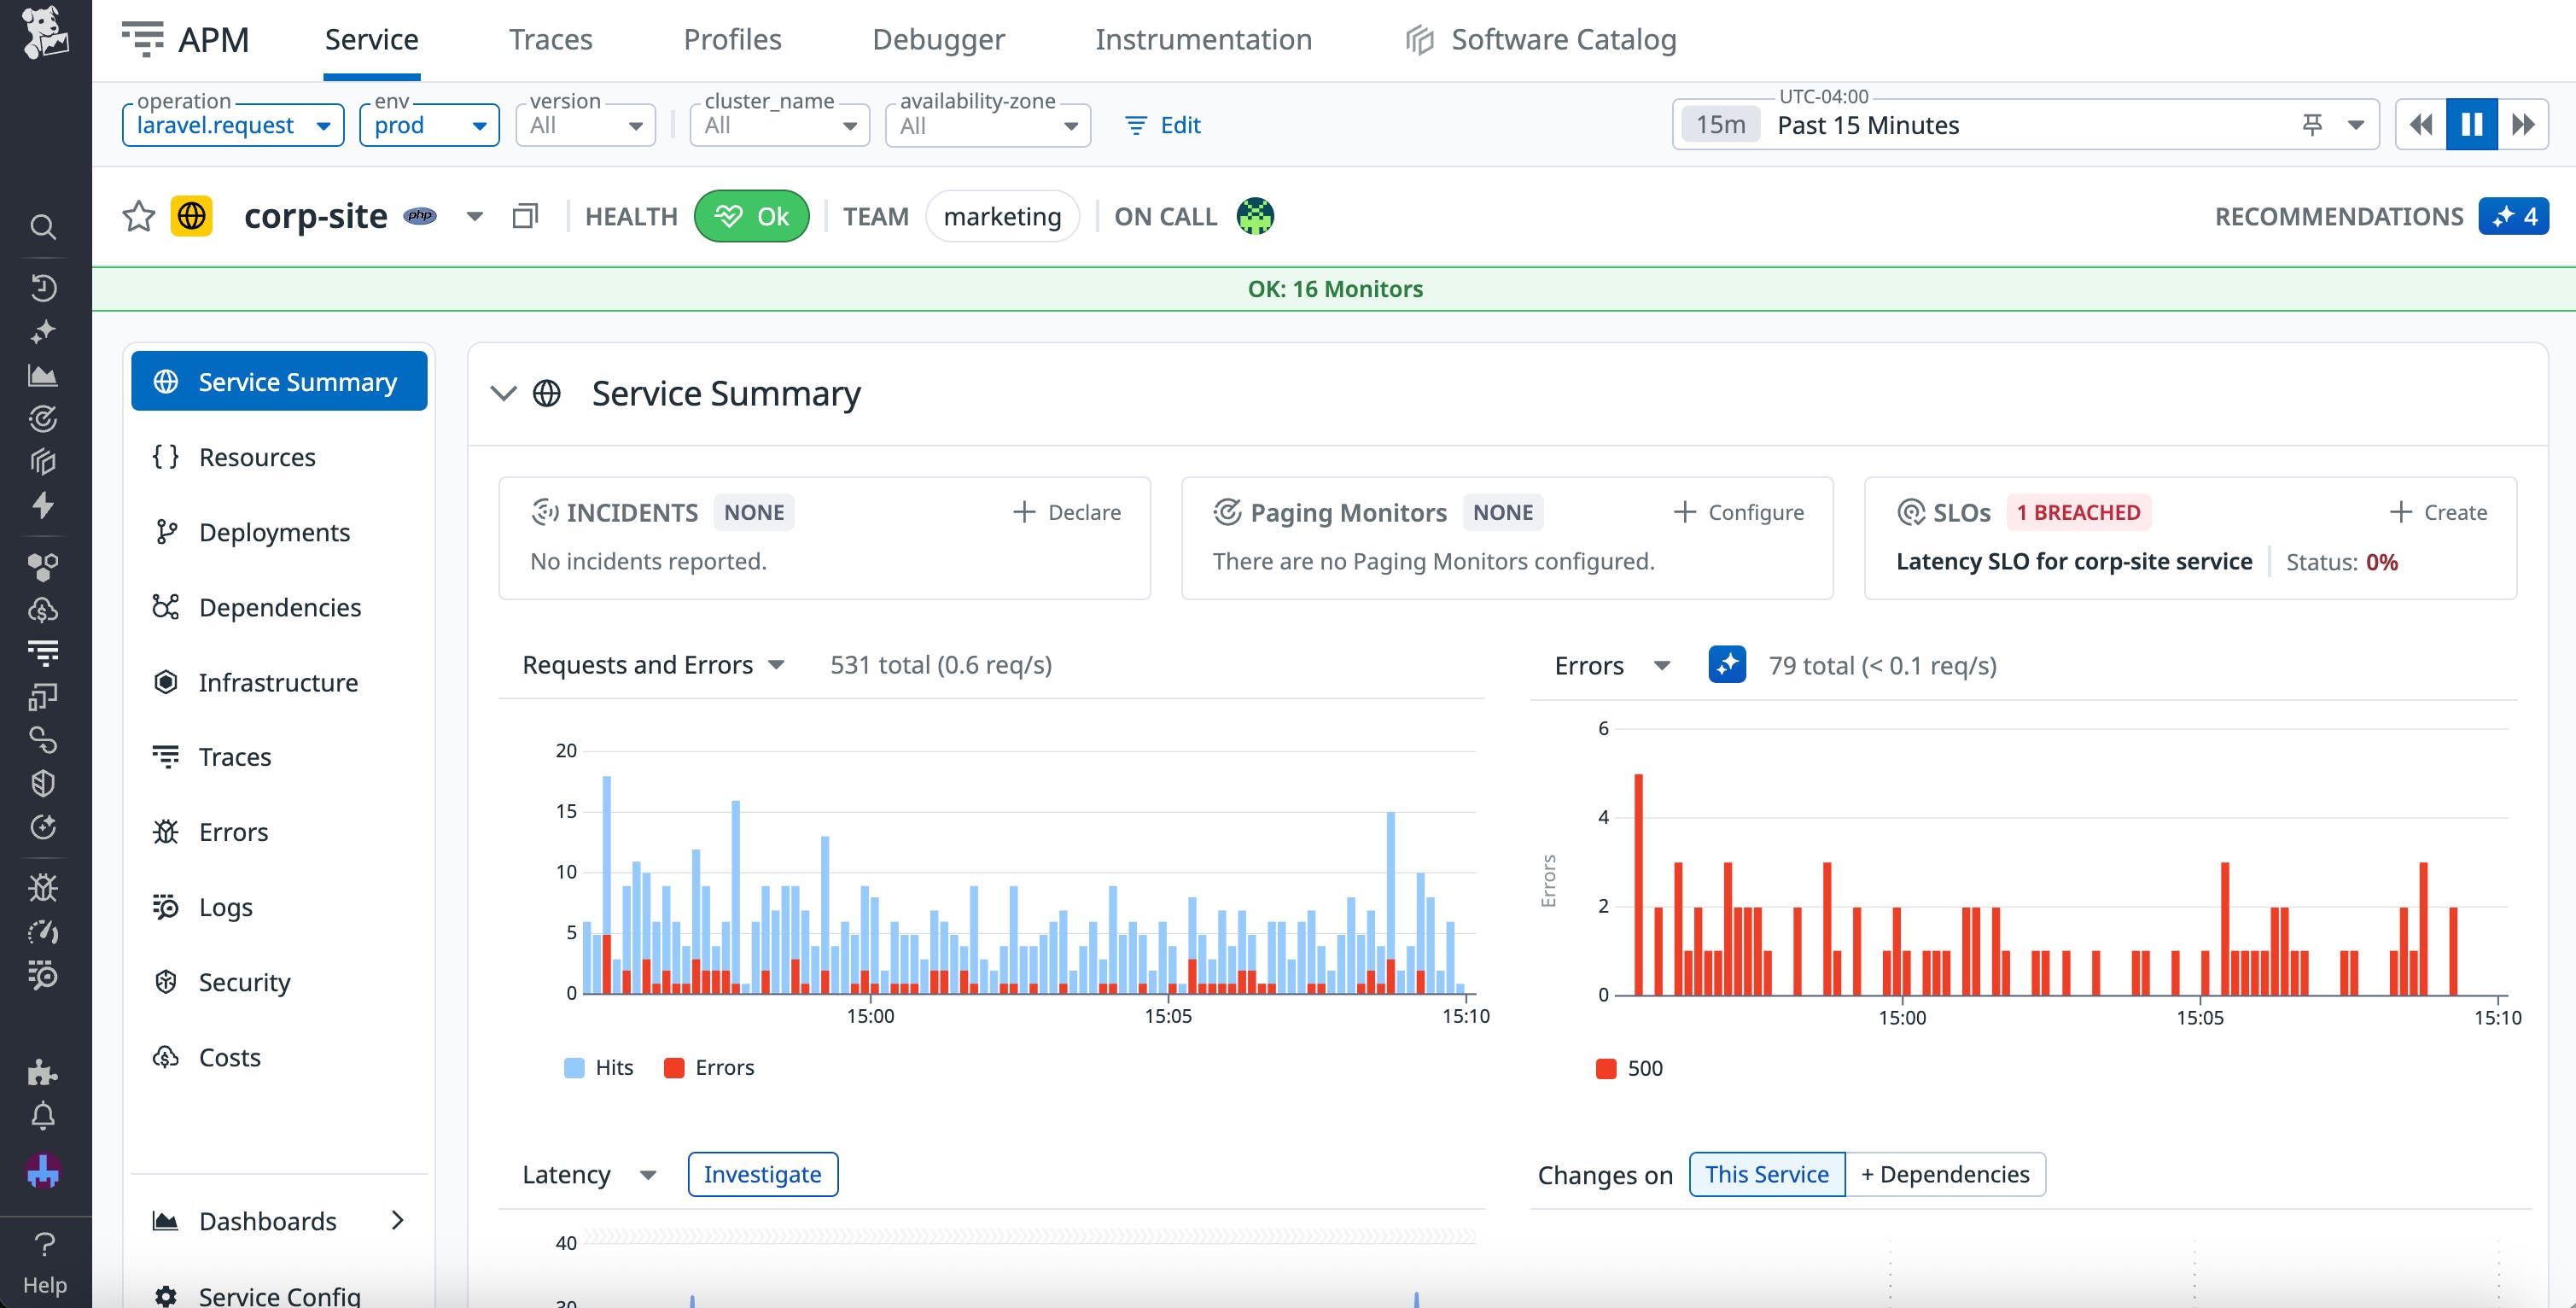
Once you’ve run your synthetic tests, you can view traces directly within the test results. To help you quickly troubleshoot issues across your entire stack, these traces are displayed alongside any errors and warning messages generated during the session, and resources that were involved in processing the request. Datadog traces also highlight potential vulnerabilities within your requests—this is particularly useful when testing areas of your app that touch on security configurations, such as HTTP headers, SSL/TLS certificates, and cookies.
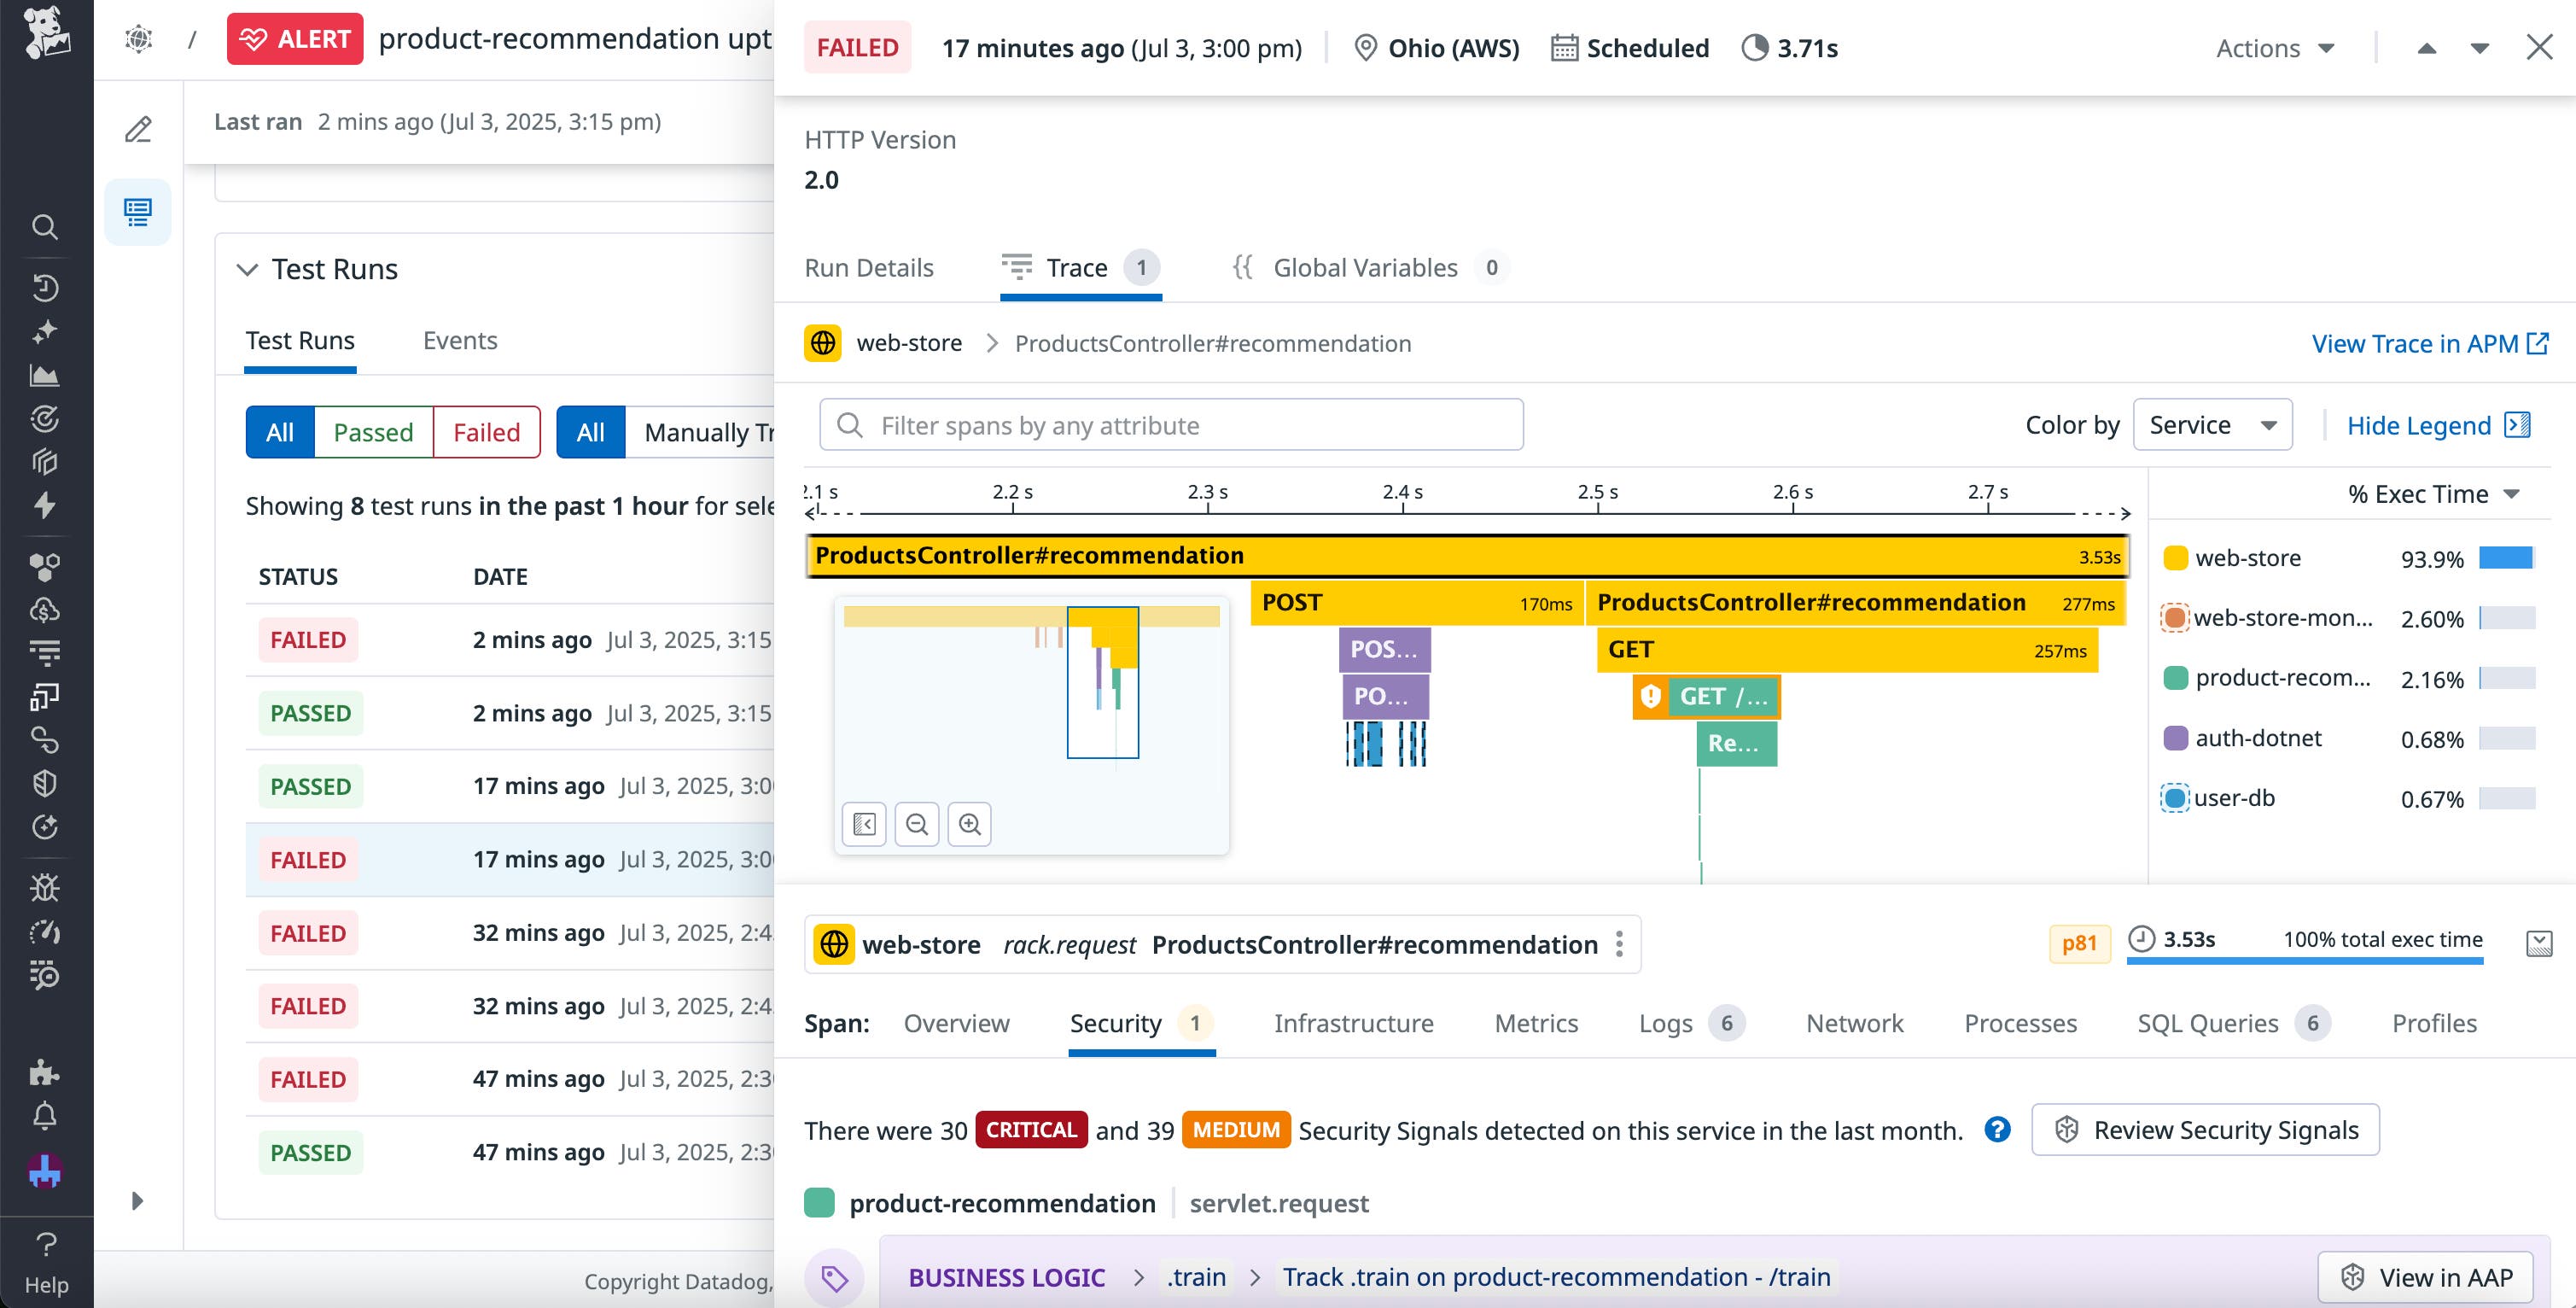
Embedded traces support a seamless transition from identifying UX issues to investigating their root causes. For example, let’s say you receive an alert that a browser test for your app’s checkout flow has failed. You open a test run within Synthetic Monitoring and jump straight to the failing step. Here, you can view a screenshot from the last step the synthetic user attempted to complete. This lets you identify that the app displayed an error message when the user attempted to submit a billing address. Switching to the Traces tab, you select the relevant trace and filter the flame graph to highlight the trace containing the error. You determine that your checkout service encountered an issue when processing the incoming data from your address verification service. To continue troubleshooting, you open the trace within APM and view the span list, enabling you to identify the misconfigured query responsible for the error.
Gain end-to-end visibility into your synthetic sessions
While synthetic testing and distributed tracing are both powerful tools on their own, combining them can help you solve issues faster and earlier in your development process. By integrating tracing into your synthetic tests, you can go straight from seeing the potential impact of a problem on your users to investigating the cause.
You can use our documentation to get started with Datadog Synthetic Monitoring and APM today. Or, if you’re new to Datadog, you can sign-up for a 14-day free trial.


