Betsy Sallee
Snowflake is a cloud-based data platform that enables users to easily store, manage, analyze, and share high volumes of structured and semi-structured data. Whereas traditional data architectures often consist of multiple databases, data warehouses, and data lakes, Snowflake’s Data Cloud breaks down the barriers between siloed data sources and serves as a single source of truth for a wide range of simultaneous workloads.
Monitoring Snowflake is essential for optimizing cost, performance, and data quality. Datadog’s updated, API-based Snowflake integration provides full visibility into Snowflake’s architecture so that you can get the most out of what it has to offer, whether you’re managing a single account or overseeing Snowflake usage throughout your entire organization. In this post, we’ll show you how to:

Monitor Snowflake query and Snowpark performance
A Snowflake virtual warehouse consists of at least one compute cluster that is provisioned by a cloud provider of your choice and is used to execute queries, load data, and perform other DML operations. With Snowflake, every virtual warehouse is able to access the same storage layer without competing with other warehouses for resources, which means data can be loaded and queried at the same time.
Warehouses have a number of configuration options that help you optimize their performance. For example, the size parameter defines the amount of compute resources available per cluster in a given warehouse and thus the speed at which that warehouse can process queries. If a warehouse is not able to keep up with the volume of queries it receives, those queries are placed in a queue until they can be processed.
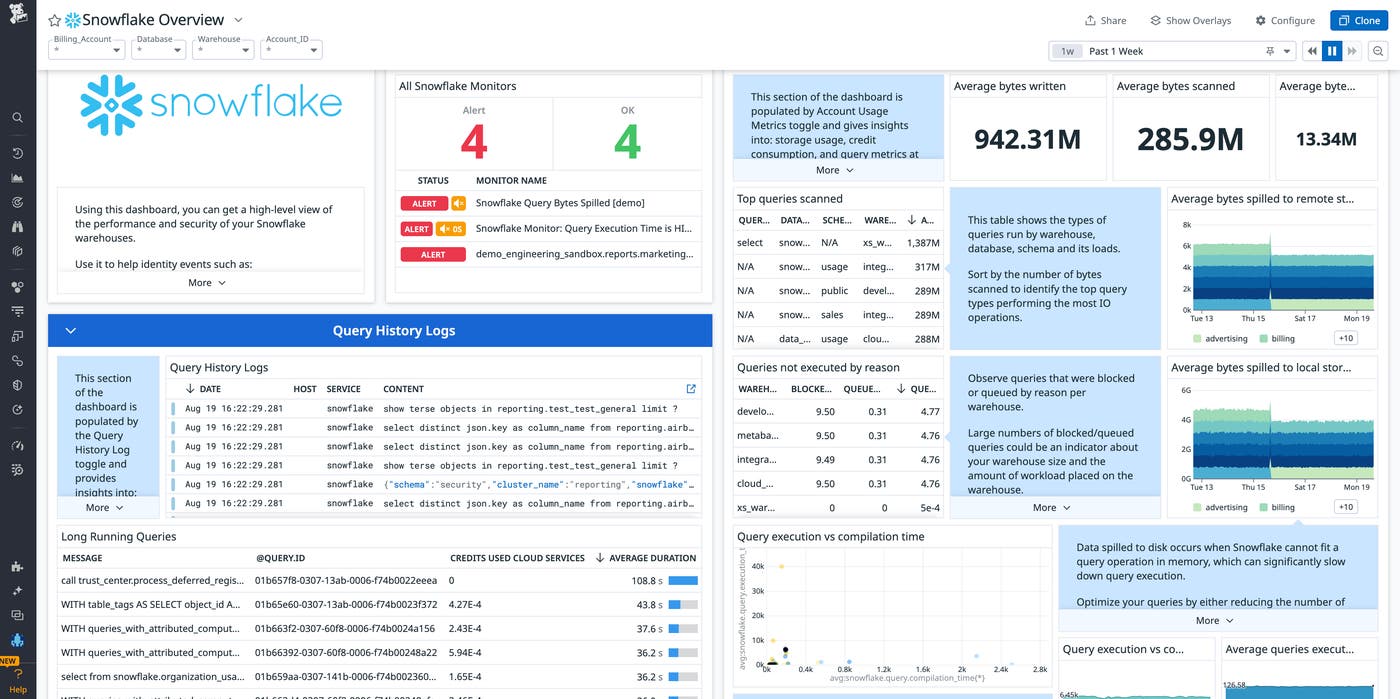
The size assigned to a warehouse also dictates its memory capacity. If a warehouse cannot accommodate an operation in memory, it starts spilling data to local storage, and then to remote storage. This spilling can dramatically degrade query performance and is best remediated by resizing the warehouse or reducing the amount of data that a particular query must process.
Datadog ingests metrics that represent the daily average of both local and remote disk spilling (snowflake.query.bytes_spilled.local and snowflake.query.bytes_spilled.remote), so you can alert on spikes and respond accordingly.

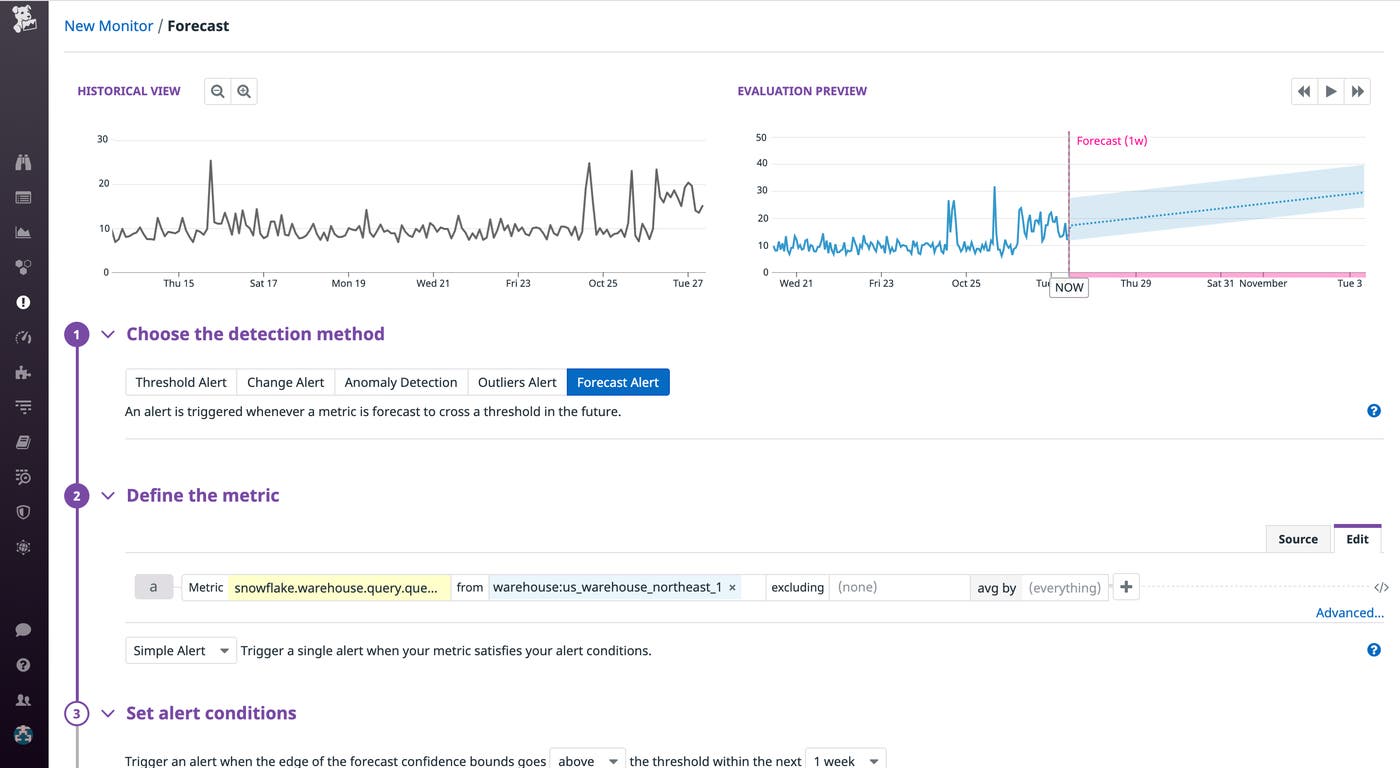
For any given warehouse, you can also use Datadog to configure a forecast monitor for the number of queries queued as a result of overload (snowflake.warehouse.query.queued_load). This technique will intelligently predict if and when the warehouse will no longer be able to perform at the desired level. If the monitor triggers, you can resize the warehouse, or (if your account has multi-cluster warehouses enabled) increase the maximum number of clusters in that warehouse to ensure that it can autoscale to accommodate the query load.

Datadog also surfaces query history logs, which can be used to identify long-running and failing queries. These logs can help you determine which queries could benefit from optimization (e.g., those with a high snowflake.query.execution_time or snowflake.query.total_execution_time) or those which may be too expensive (e.g., snowflake.query.credits_used).
Snowflake also enables users to write user-defined functions (UDFs), which extend the capacity of queries to transform data via operations not available through Snowflake's built-in functions. This capability is made possible by Snowpark, a set of libraries and code execution environments that allow users to to build applications and pipelines directly in Snowflake. Snowpark leverages Snowflake’s virtual warehouses for processing, meaning compute costs are directly related to the size of the virtual warehouse and the complexity and volume of data operations performed. Efficient use of Snowpark’s capabilities, along with optimizations provided by Snowflake, can help control compute costs.
The Datadog Snowflake integration provides visibility into Snowpark performance through Event Table logs via Snowflake Trail. Having access to Event Table logs and events alongside the rest of your monitoring data will help you quickly root-cause and troubleshoot Snowpark bottlenecks and failures. To learn more, check out our dedicated blog post.
Manage Snowflake costs
The majority of Snowflake costs are derived from compute credits, and the majority of compute is consumed via queries. Your Snowflake compute cost is determined by the size of each of your warehouses and how long they run. Snowflake metrics can provide useful insight into managing the cost of your virtual warehouses. If you notice a spike in the number of credits used by your warehouses (snowflake.billing.virtual_warehouse.sum), you may want to consider taking a closer look at query throughput (snowflake.query.total) over time. For instance, if you see that a warehouse is consuming credits but only processing one query every 30 minutes, you may want to adjust the warehouse’s auto-suspend value to ensure that the warehouse is only active and consuming credits when it is needed. You might also consider eliminating the warehouse entirely and directing those queries to another, more active warehouse.
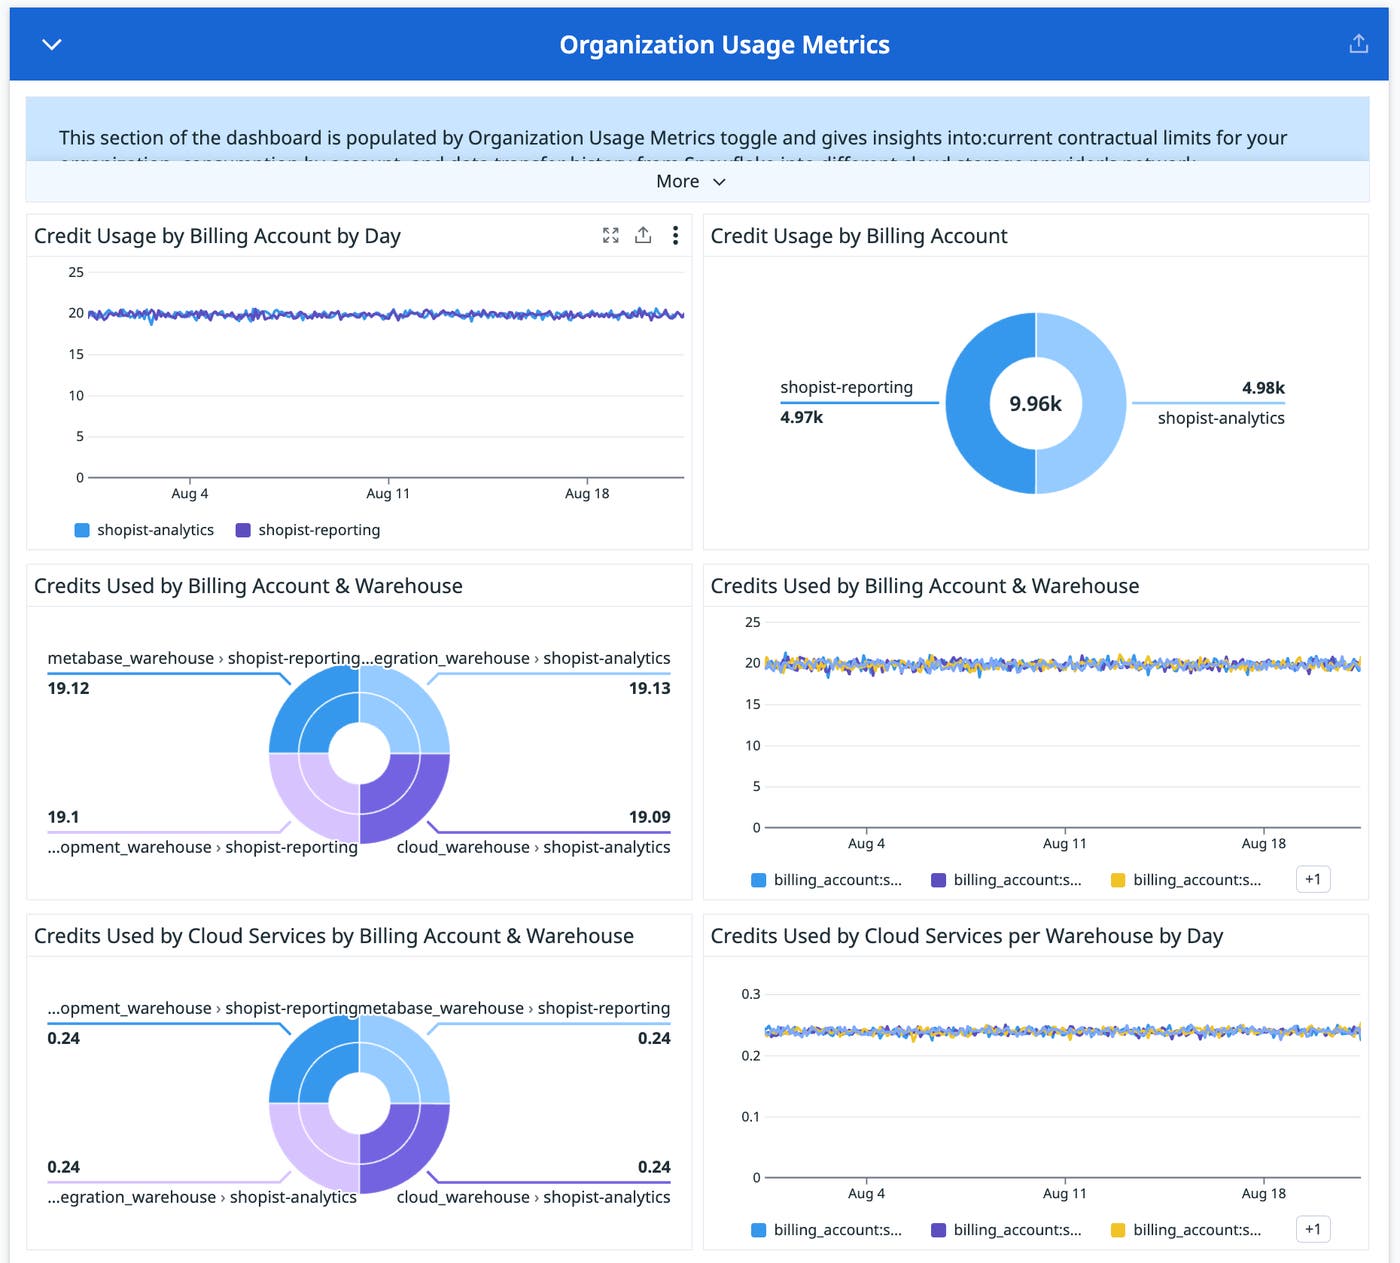
Collecting organizational metrics allows you to monitor credit usage across any number of associated accounts. You can measure overall usage throughout your organization (snowflake.organization.storage.credits), and track precisely how and where credits are being used across accounts (snowflake.organization.warehouse.total_credit.sum or snowflake.organization.warehouse.total_credit.avg). You can also track how credits are used across warehouses (snowflake.organization.warehouse.virtual_warehouse.sum or snowflake.organization.warehouse.virtual_warehouse.avg). Yet another option is to monitor usage across cloud services (snowflake.organization.warehouse.cloud_service.sum or snowflake.organization.warehouse.cloud_service.avg).

You can also review your contract information (snowflake.organization.contract.amount) and track your available balance (snowflake.organization.balance.capacity) and effective rates (snowflake.organization.rate.effective_rate) based on your organization’s credit usage.
Datadog tags offer even deeper insight into how your Snowflake compute credits are being used across your organization. You can slice and dice the total number of credits your warehouses consume by the user, role, and warehouse_name tags in order to see which teams and team members are running the most expensive workloads.

Monitoring at an organizational level and parsing your metrics with tags can facilitate an in-depth understanding of Snowflake at any scale, helping you make informed decisions about usage and how and where to allocate credits in the future.
While these metrics provide a good starting point, Datadog Cloud Cost Management (CCM) is the best way to stay on top of Snowflake costs. CCM provides a unified place to view and analyze cost and observability data from across your cloud infrastructure, including a wealth of features, such as cost per query metrics (in preview).
Once you’ve enabled CCM to start collecting Snowflake data, you can scope your CCM data to the specific services running on Snowflake and the teams responsible for those services, enabling you to understand their total usage. This visibility, alongside the metrics ingested from the Snowflake integration, can help you identify spikes in cost and make decisions about which teams and services in your organization would benefit the most from optimization.
Stay ahead of security vulnerabilities
Snowflake’s cloud services layer, which is managed entirely by Snowflake, is often referred to as the “brain” of the system. It handles tasks such as authentication, authorization, and query optimization, and it is responsible for ensuring that all warehouses can access the most up-to-date data without experiencing performance degradation. The cloud services layer is also home to the metadata store, which enables key Snowflake capabilities such as zero-copy cloning, Time Travel, and data sharing.
Because the cloud services layer is responsible for authentication, it provides us with metrics related to login history. The graph below compares the number of successful login attempts (in blue) and failures (in red). Datadog also collects logs to track login history, which can complement login history metrics. You may also want to configure a monitor to alert you to an increase in failed login attempts from any single account, user, or type of client by using tags like account, username, and client_type. A spike in failed login attempts could indicate a security threat or a misconfiguration.

In order to reduce the risk of attackers accessing, collecting, and exfiltrating sensitive data, you can send Snowflake security logs directly to Cloud SIEM. The integration offers 13 out-of-the-box detection rules, which can be used to identify and remediate events such as brute-force logins, suspicious data exfiltration, known malicious client application sessions, and many more. The logs can be viewed and analyzed in the Log Explorer or our out-of-the-box Snowflake Overview Dashboard. Additionally, the out-of-the-box dashboard surfaces security logs and query history, providing further context for your investigations. Customers can also choose to route these logs to Flex Tier storage for cost-effective analytics and long-term retention in order to support other DevOps, compliance, and security use cases, such as tracking failed logins by IP address, location, or user. This increased visibility can prevent potential financial losses and reputational damage. To learn more, see our dedicated blog post.
Monitor the quality & usage of your Snowflake data
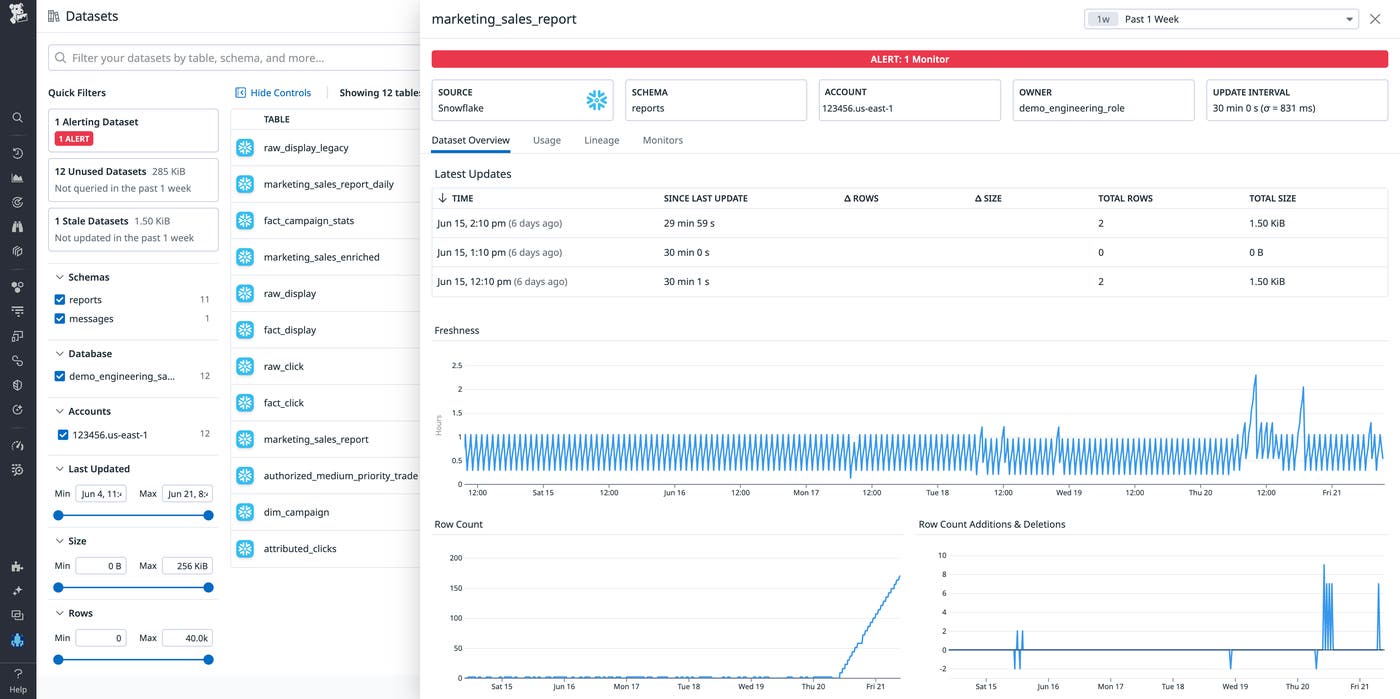
It’s important to know if the Snowflake tables your business relies on can be trusted to deliver accurate insights. With Datadog’s new capability for monitoring data (in preview), you can detect data quality issues by monitoring data freshness and volume metrics, use data lineage to determine the downstream tables impacted, and analyze table usage to identify frequently accessed tables that need additional monitoring or those that aren't being queried and should be cleaned up.

These capabilities help you catch issues in your data, whether you’re training LLMs or optimizing an e-commerce site based on trends in customer data. To learn more, check out our blog post or sign up for the preview.
Bring Snowflake data into Datadog
Users can write their own SQL queries directly in the integration tile to collect their own set of custom metrics and tags from Snowflake. These can be used to access more granular views around events such as elevated memory usage or merge queue errors set to a specific list of jobs, tasks, tables, or users. This new functionality also allows users to access views from other Snowflake services their company may use, such as total records loaded via Snowpipe, or the average lag of their Dynamic Tables. Users can even stream in business data from Snowflake to track sales trends or product usage. Datadog also offers a new feature (currently in preview) that allows users to stream Snowflake data into Datadog as a reference table, enabling them to enrich logs and improve product analytics segmentation.
Get full visibility into Snowflake
Datadog provides crucial insight into every layer of the Snowflake architecture so that you can carefully monitor and optimize your usage, or that of your entire organization. And because Datadog integrates with over 1,000 other technologies, including Spark, Airflow, and Kafka, you can be sure that you’ll have a complete picture of all data-related activity in your system, no matter which services you use in tandem with Snowflake.
To learn more about how to use Datadog to monitor Snowflake, check out our documentation or our monitoring guide. Already a Datadog customer? Log in to your environment, and search for the Snowflake tile after navigating to "integrations" at the bottom of the left sidebar. And if you’re not yet a Datadog customer, get started with a 14-day free trial.

