Roman Olynyk

Ashwin Kamath
Senior Product Manager, Snowflake
Snowflake is an AI data cloud platform that breaks down silos within an organization to enable wider collaboration with partners and customers for storing, managing, and analyzing data. With Snowpark and Snowpark Container Services (SPCS), organizations can leverage a set of libraries and execution environments directly in Snowflake to build applications and pipelines with familiar programming languages like Python and Java, all without having to move data across tools or platforms.
Snowflake Trail allows developers and data engineers to observe and act on their applications and data pipelines through Snowsight or third-party tools by leveraging Snowflake's Query History, Event Tables, alerts, and notifications as telemetry.
The Datadog Snowflake integration already gives you the visibility to optimize your storage usage, monitor warehouse performance and compute credit consumption, and detect misconfigurations and security threats. Now, our integration provides visibility into Snowpark performance through Event Table logs via Snowflake Trail. Event Tables unify the collection of metrics, traces, and logs for all Snowflake developer services and applications, allowing app developers and data engineers to detect and resolve issues in their data, code, or environment.
In this post, we’ll show you how you can ingest Event Table logs and events into Datadog to quickly take action on Snowpark bottlenecks and failures.
Visualize logs and events from Snowflake Event Tables
With our integration, Snowpark developers and data engineers can ingest logs from all deployments, accounts, and regions into a single Datadog account. When you build apps and pipelines that use Snowpark stored procedures and functions, you can capture logs and events in the Event Table and access them in Datadog via the new integration and standard logging and metrics.
Before setting up our integration, you’ll first want to make sure you’ve created an Event Table in Snowflake and set it to active. You’ll also want to set the appropriate log level for your account or database and configure your logs. If you’re not familiar with Event Tables, check out the quickstart guide.

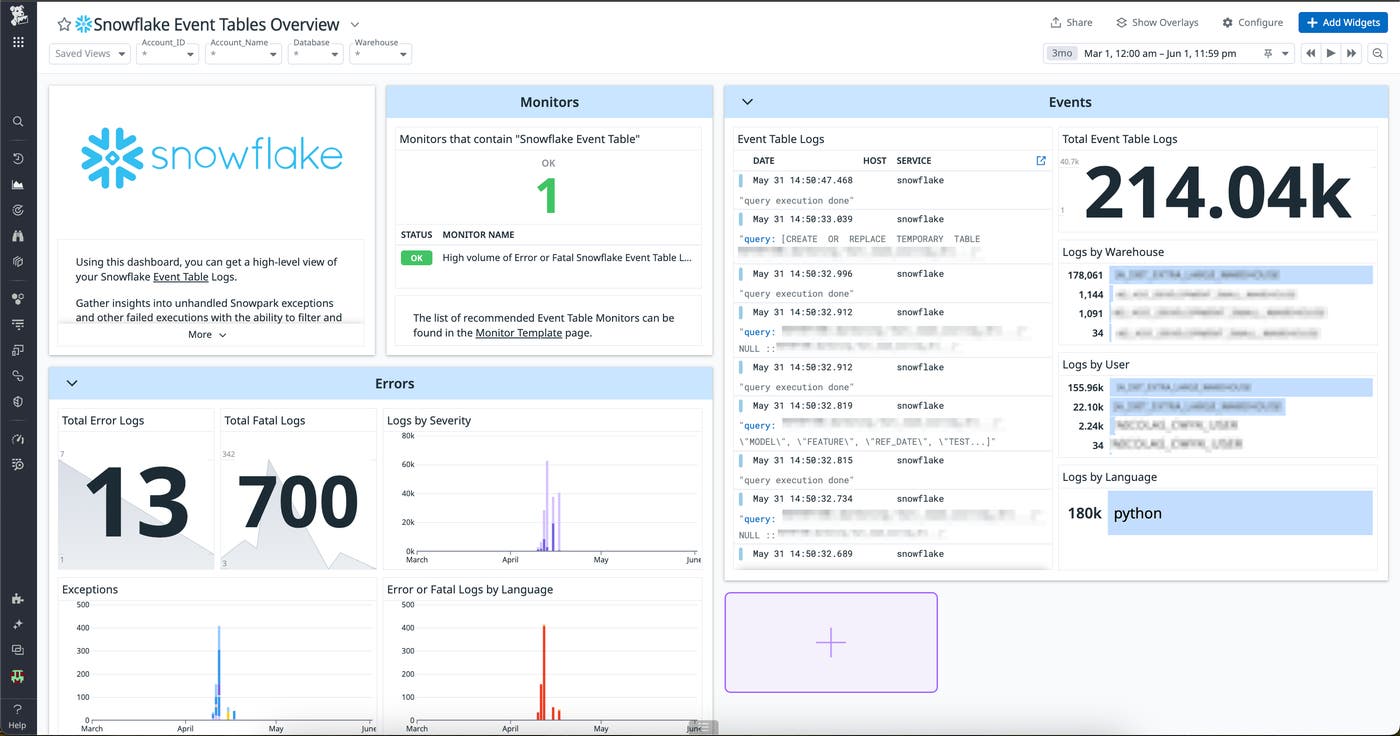
Datadog makes it easy to start collecting Event Table logs with a one-click opt-in from the integration tile. With the out-of-the-box dashboard, you can see all your Event Table logs in one place. You can view logs by status, severity, or exception type while also being able to filter views across your different accounts, databases, and warehouses.
Debug bottlenecks and failures with Event Tables
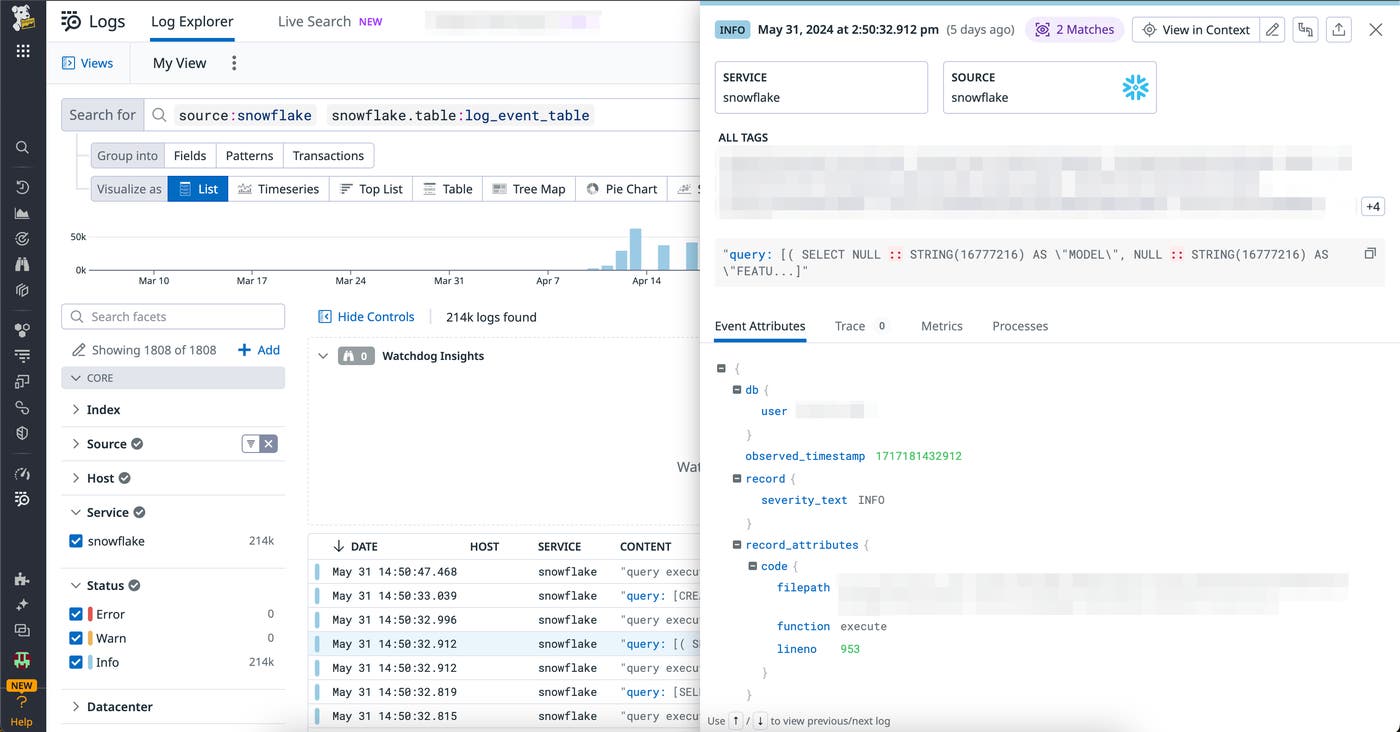
Once your Event Table logs are ingested into Datadog, Log Explorer enables you to quickly search for specific events or logs to detect patterns. You can filter events by user, warehouse, database, schema, or any string that could be present in your logs.

The Event Table also captures unhandled exceptions thrown from your Python and Java stored procedures or user-defined functions (UDFs). For example, if a UDF is processing a row with unexpected data and throws an exception—or if a request to an external system sends back an unexpected response—all unhandled Python exceptions will be routed to the Event Table.
You can create custom monitors to alert you if there are issues with specific logs or events, or you can use our recommended monitor template to easily set preconfigured monitors on common issues.
Monitor Snowpark performance with Datadog
The Datadog Snowflake integration now lets you ingest Event Table logs into a single account to quickly visualize and take action on your Snowpark performance. You can easily see your Snowpark logs alongside monitoring data from the rest of your infrastructure with Datadog’s 1,000+ integrations, including key technologies such as Apache Airflow.
To learn more about our Snowflake integration, visit our documentation. If you’re new to Datadog, get started with a 14-day free trial.

