
Maxim Brown
This post is the last part of a four-part series about monitoring the health and performance of Pivotal Platform (formerly known as Pivotal Cloud Foundry), focusing specifically on the Pivotal Application Service runtime. Pivotal Platform is now part of VMware Tanzu following VMware's acquisition of Pivotal in late 2019.
In part three of this series, we showed you a number of methods and tools for accessing key metrics and logs from a Pivotal Platform deployment. Some of these tools help Pivotal Platform operators monitor the health and performance of the cluster, whereas others allow developers to view metrics, logs, and performance data from their applications running on the cluster.
In this post, we’ll show you how you can use Datadog to collect and monitor metrics and logs from Pivotal Platform, whether you are an operator or a developer. By monitoring Pivotal Platform with Datadog, you can visualize the data from all your applications, cluster components, and cloud services in one place, set sophisticated alerts, and view historical data on demand. To get you started, we’ll cover:
- Datadog’s Cluster Monitoring tile, which operators can use to collect, visualize, and alert on metrics from Pivotal Platform components
- Datadog’s Application Monitoring tile, which enables developers to collect custom metrics, traces, and logs from their applications
- Ingesting and processing system logs with Datadog
Monitor a Pivotal Platform cluster with Datadog
Pivotal Platform operators can get deep visibility into their cluster by installing the Datadog Cluster Monitoring for Pivotal Platform tile. The tile deploys two components—a Firehose nozzle and the Datadog Agent—which together deliver metrics from your Pivotal Platform components as well as system-level resource metrics from the underlying VMs.
The Datadog Firehose nozzle consumes information from your deployment’s Loggregator, Pivotal Platform's system for aggregating deployment metrics and application logs. The Datadog nozzle collects Loggregator CounterEvents, which report an incrementing value; ValueMetrics, which represent an instantaneous measurement; and ContainerMetrics, which provide resource metrics for the containers running applications. Armed with these metrics, you can monitor and alert on the key indicators discussed in part two of this series as well as hundreds of additional metrics that are available from the Firehose.
Because the nozzle will read any and all information included in the Firehose stream, you can use it to collect metrics from services such as Pivotal Healthwatch, which transforms raw Pivotal Platform metrics into per-minute or per-hour rates, percentages of available capacity, and other useful computed metrics. For example, the Healthwatch metric Diego.AvailableFreeChunks uses the cell Rep metric rep.CapacityRemainingMemory to calculate the number of available blocks of memory large enough to stage and run new applications. If you install Pivotal Healthwatch on your cluster, its metrics will be available in Datadog with the cloudfoundry.nozzle.healthwatch prefix.
The second component installed by the Datadog Cluster Monitoring tile is the open source Datadog Agent. The tile deploys the Agent as a BOSH release onto every host in your cluster. The Agent then automatically begins reporting system-level metrics from each VM, so you can monitor and aggregate CPU, memory, network, and other resource metrics from across your cluster.
Install the cluster monitoring tile
To install the Datadog Cluster Monitoring tile, operators can download it from the Pivotal Network. Once you download the service, you can then import it into the Ops Manager to configure and deploy it.

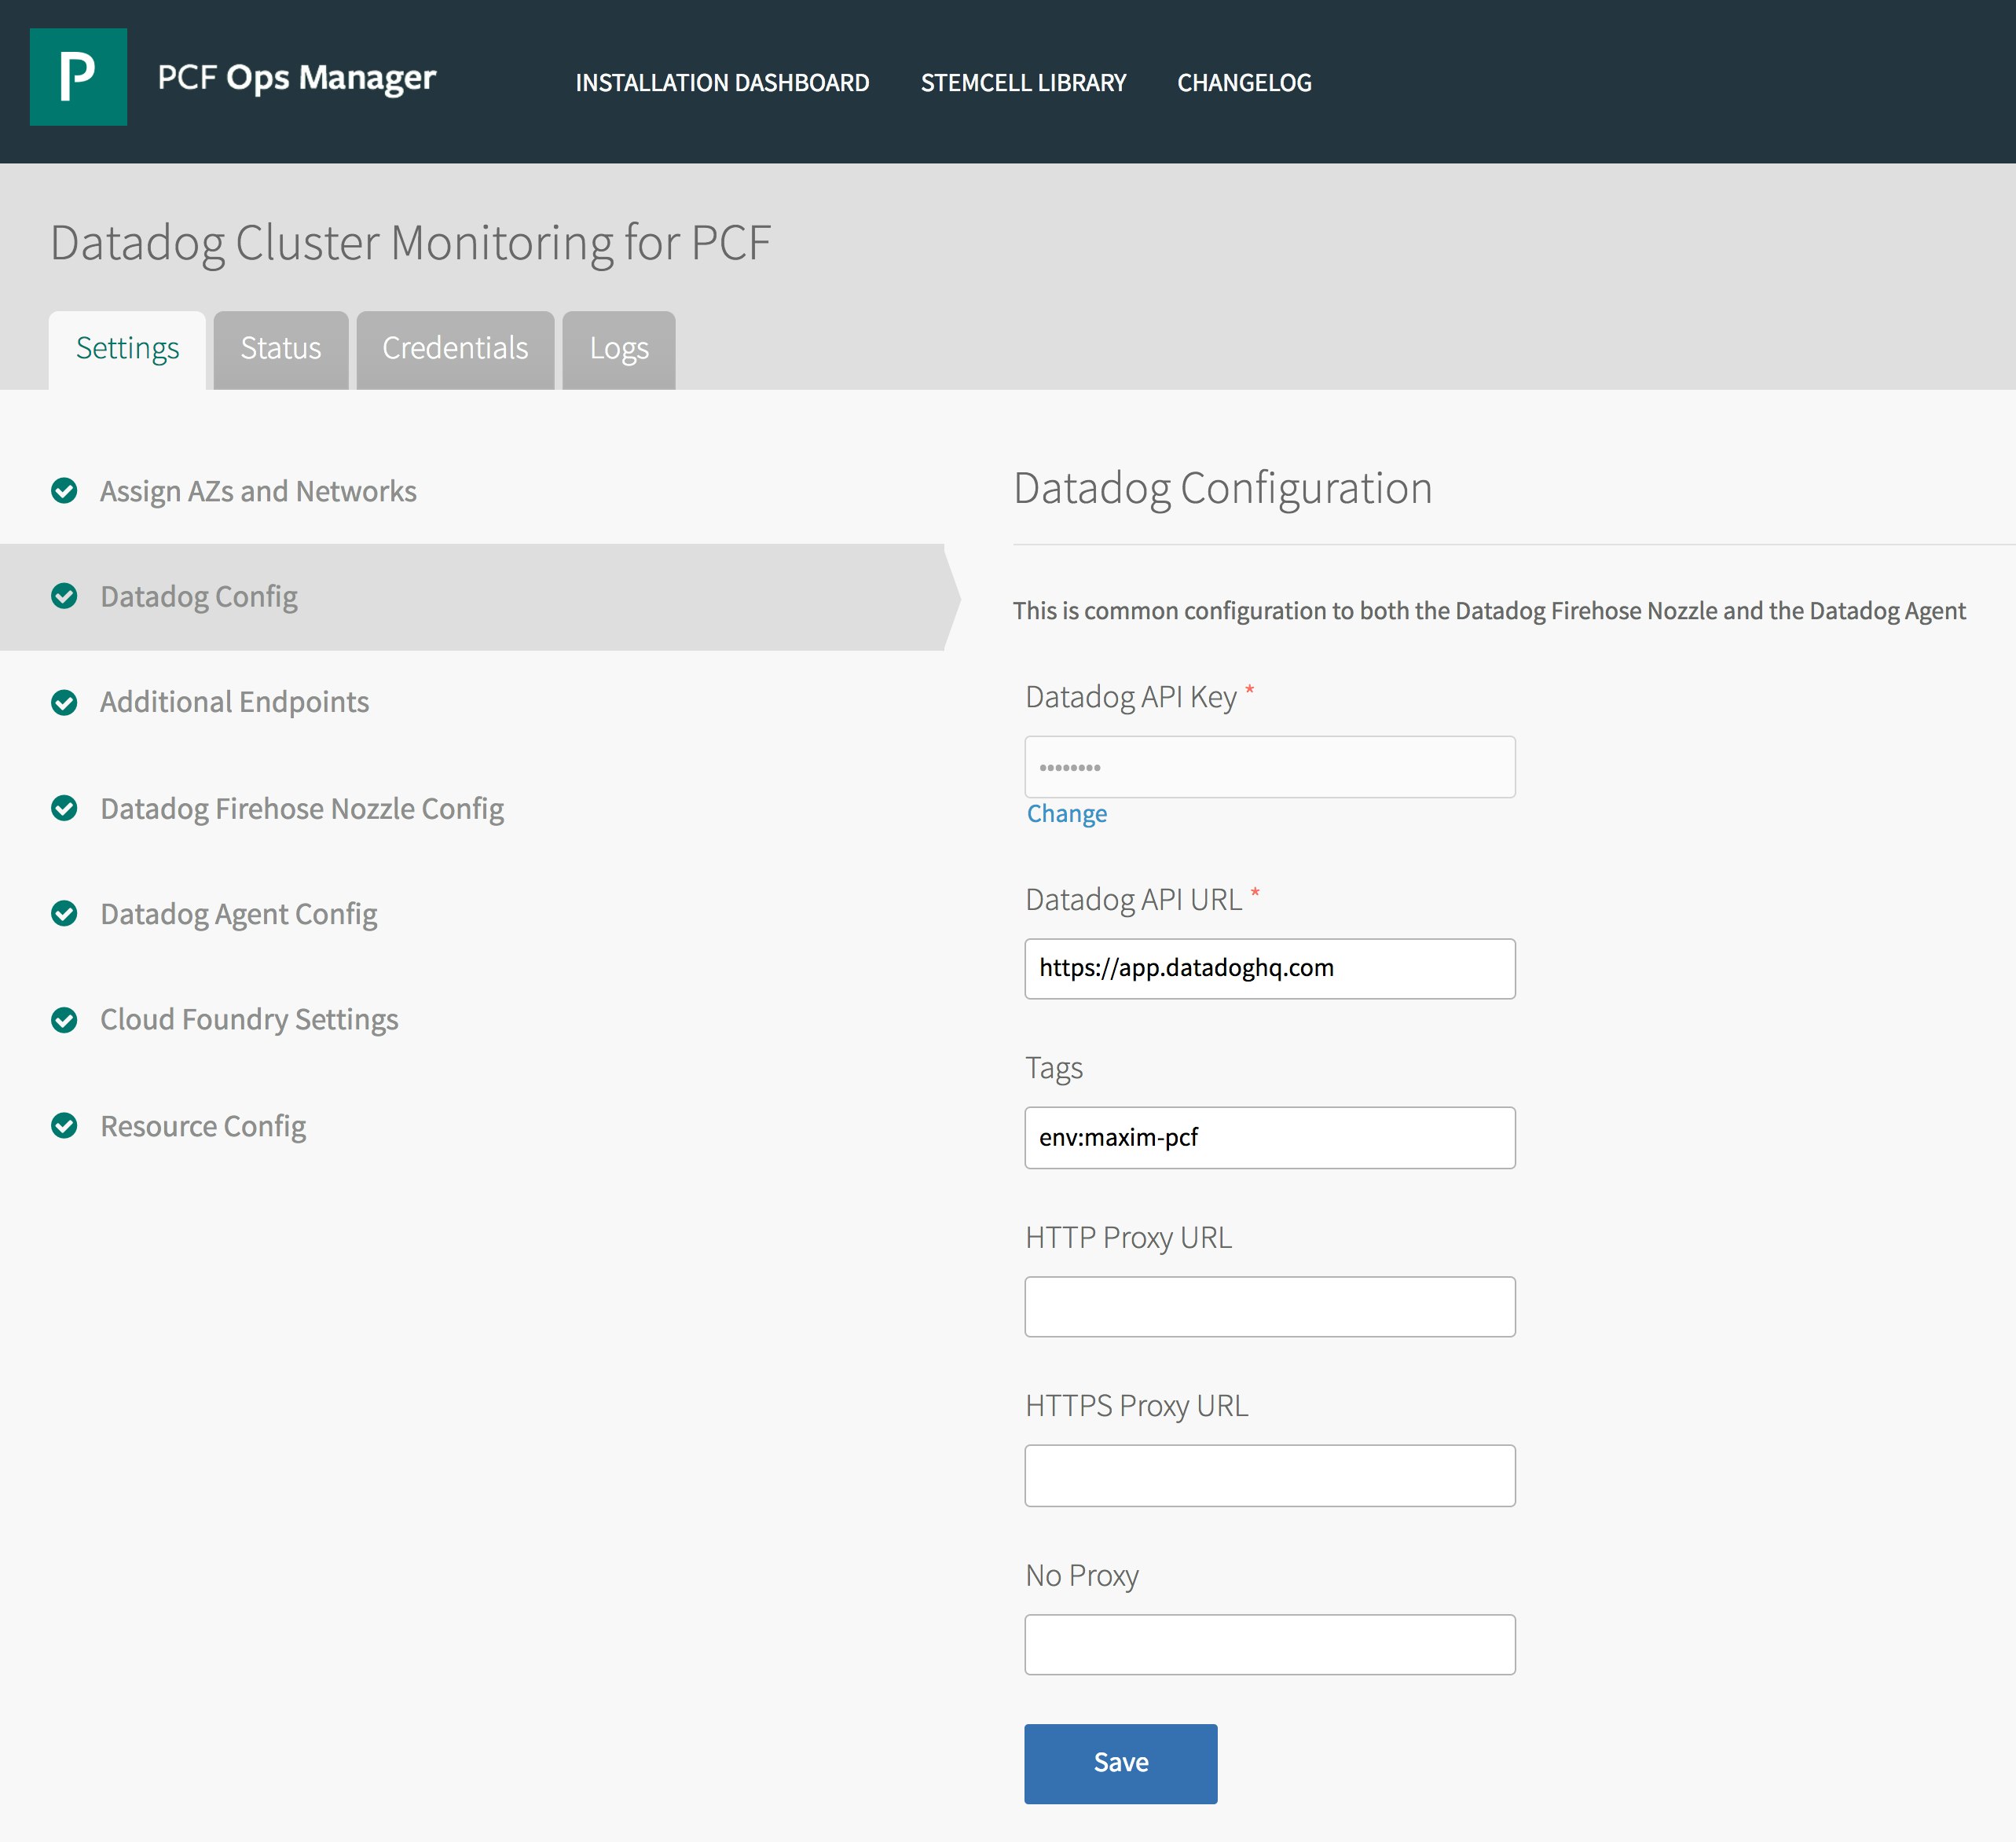
In the Ops Manager, under the tile’s Datadog Config tab, enter your Datadog API key. You can also add tags for your deployment, which will be applied to all VMs in your cluster so you can easily filter and aggregate your metrics using relevant attributes. For instance, if you are operating multiple Pivotal Platform clusters for different stages of the development process, you can tag them by the name of the environment, such as env:development and env:production.
The next configuration step is to create a UAA client account for Datadog that can access the Firehose data. First, using the UAA command line client, or UAAC, target your domain’s UAA server with the command:
uuac target uaa.<your-domain>.comThen retrieve an access token from the server with the following command, where the secret is the password for the admin client of your deployment (all deployment credentials are available from the Credentials tab of your Pivotal Application Services tile in the Ops Manager):
uaac token client get admin -s <secret>Once you’ve retrieved an admin client token, you can use the UAAC to create an account that can access the Firehose. Use the command below to create a new client account for the Datadog nozzle, assigning it a name and password:
uaac client add datadog-firehose-nozzle \ --name <datadog_client_name*> \ --scope doppler.firehose,cloud_controller.admin_read_only,oauth.login \ --authorities doppler.firehose,cloud_controller.admin_read_only,openid,oauth.approvals \ --authorized_grant_types client_credentials,refresh_token \ --access_token_validity 1209600 \ -s <datadog_client_password>*In the tile settings (configured below), the name defaults to datadog-firehose-nozzle.
Then, in the Cloud Foundry Settings tab, enter the client name (if different from the default) and the Datadog client password you created in the previous step. Save your configuration and apply the changes to deploy the nozzle and Datadog Agent.
Monitor your cluster with Datadog graphs and alerts
Once you’ve deployed Datadog’s Cluster Monitoring tile, you will see your Pivotal Platform infrastructure appear in Datadog and reporting metrics. Datadog automatically tags your metrics and infrastructure components with attributes from the cloud provider your cluster is running on (such as the availability zone and instance type), as well as various BOSH settings. For example, each VM is tagged with a deployment ID and a BOSH job identifying what role that VM is running. Tags let you easily organize and group your cluster’s VMs using visualizations such as the Datadog host map.
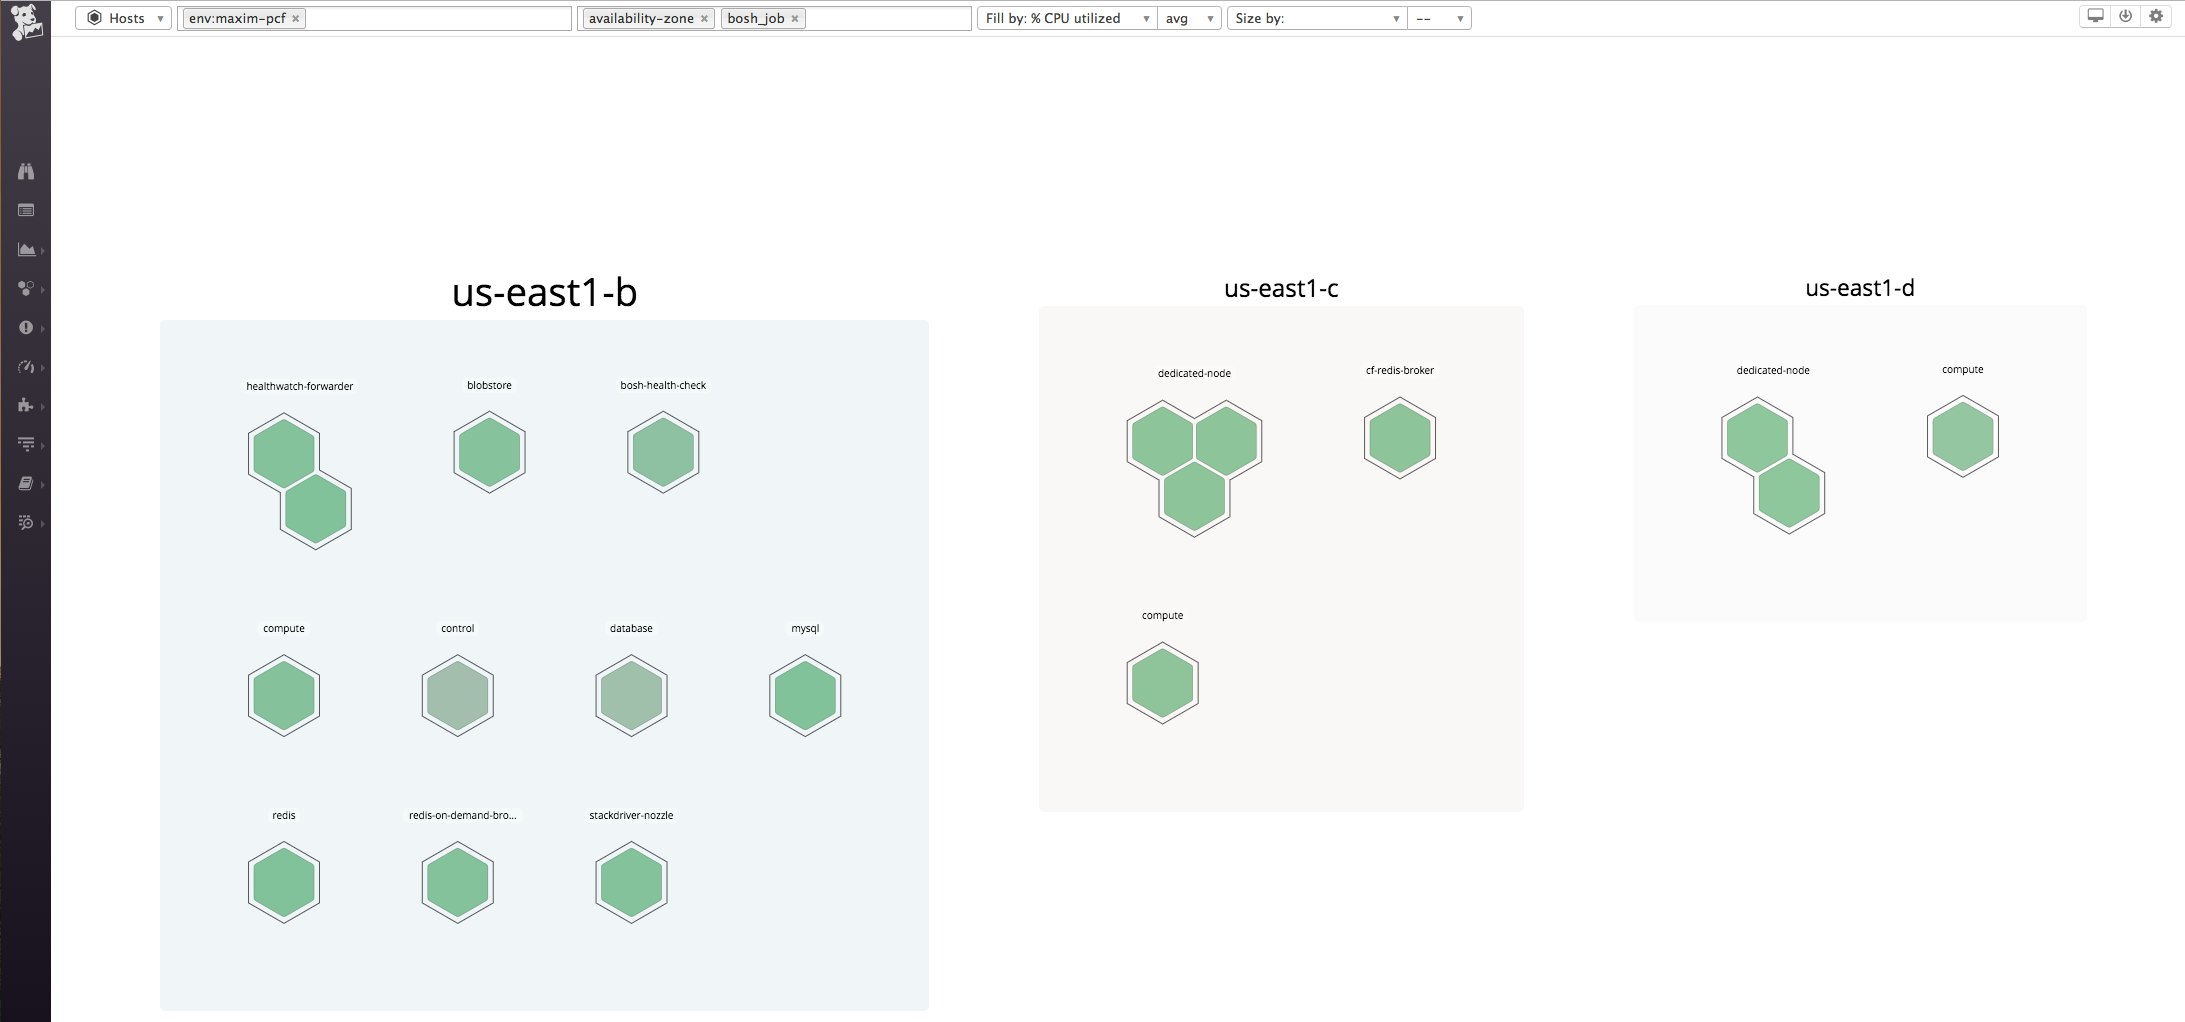
This high-level view is useful for quickly identifying hot spots in your cluster. For example, you can see if a certain Diego cell or UAA server is running with a particularly high level of CPU utilization, which can have significant effects on performance.
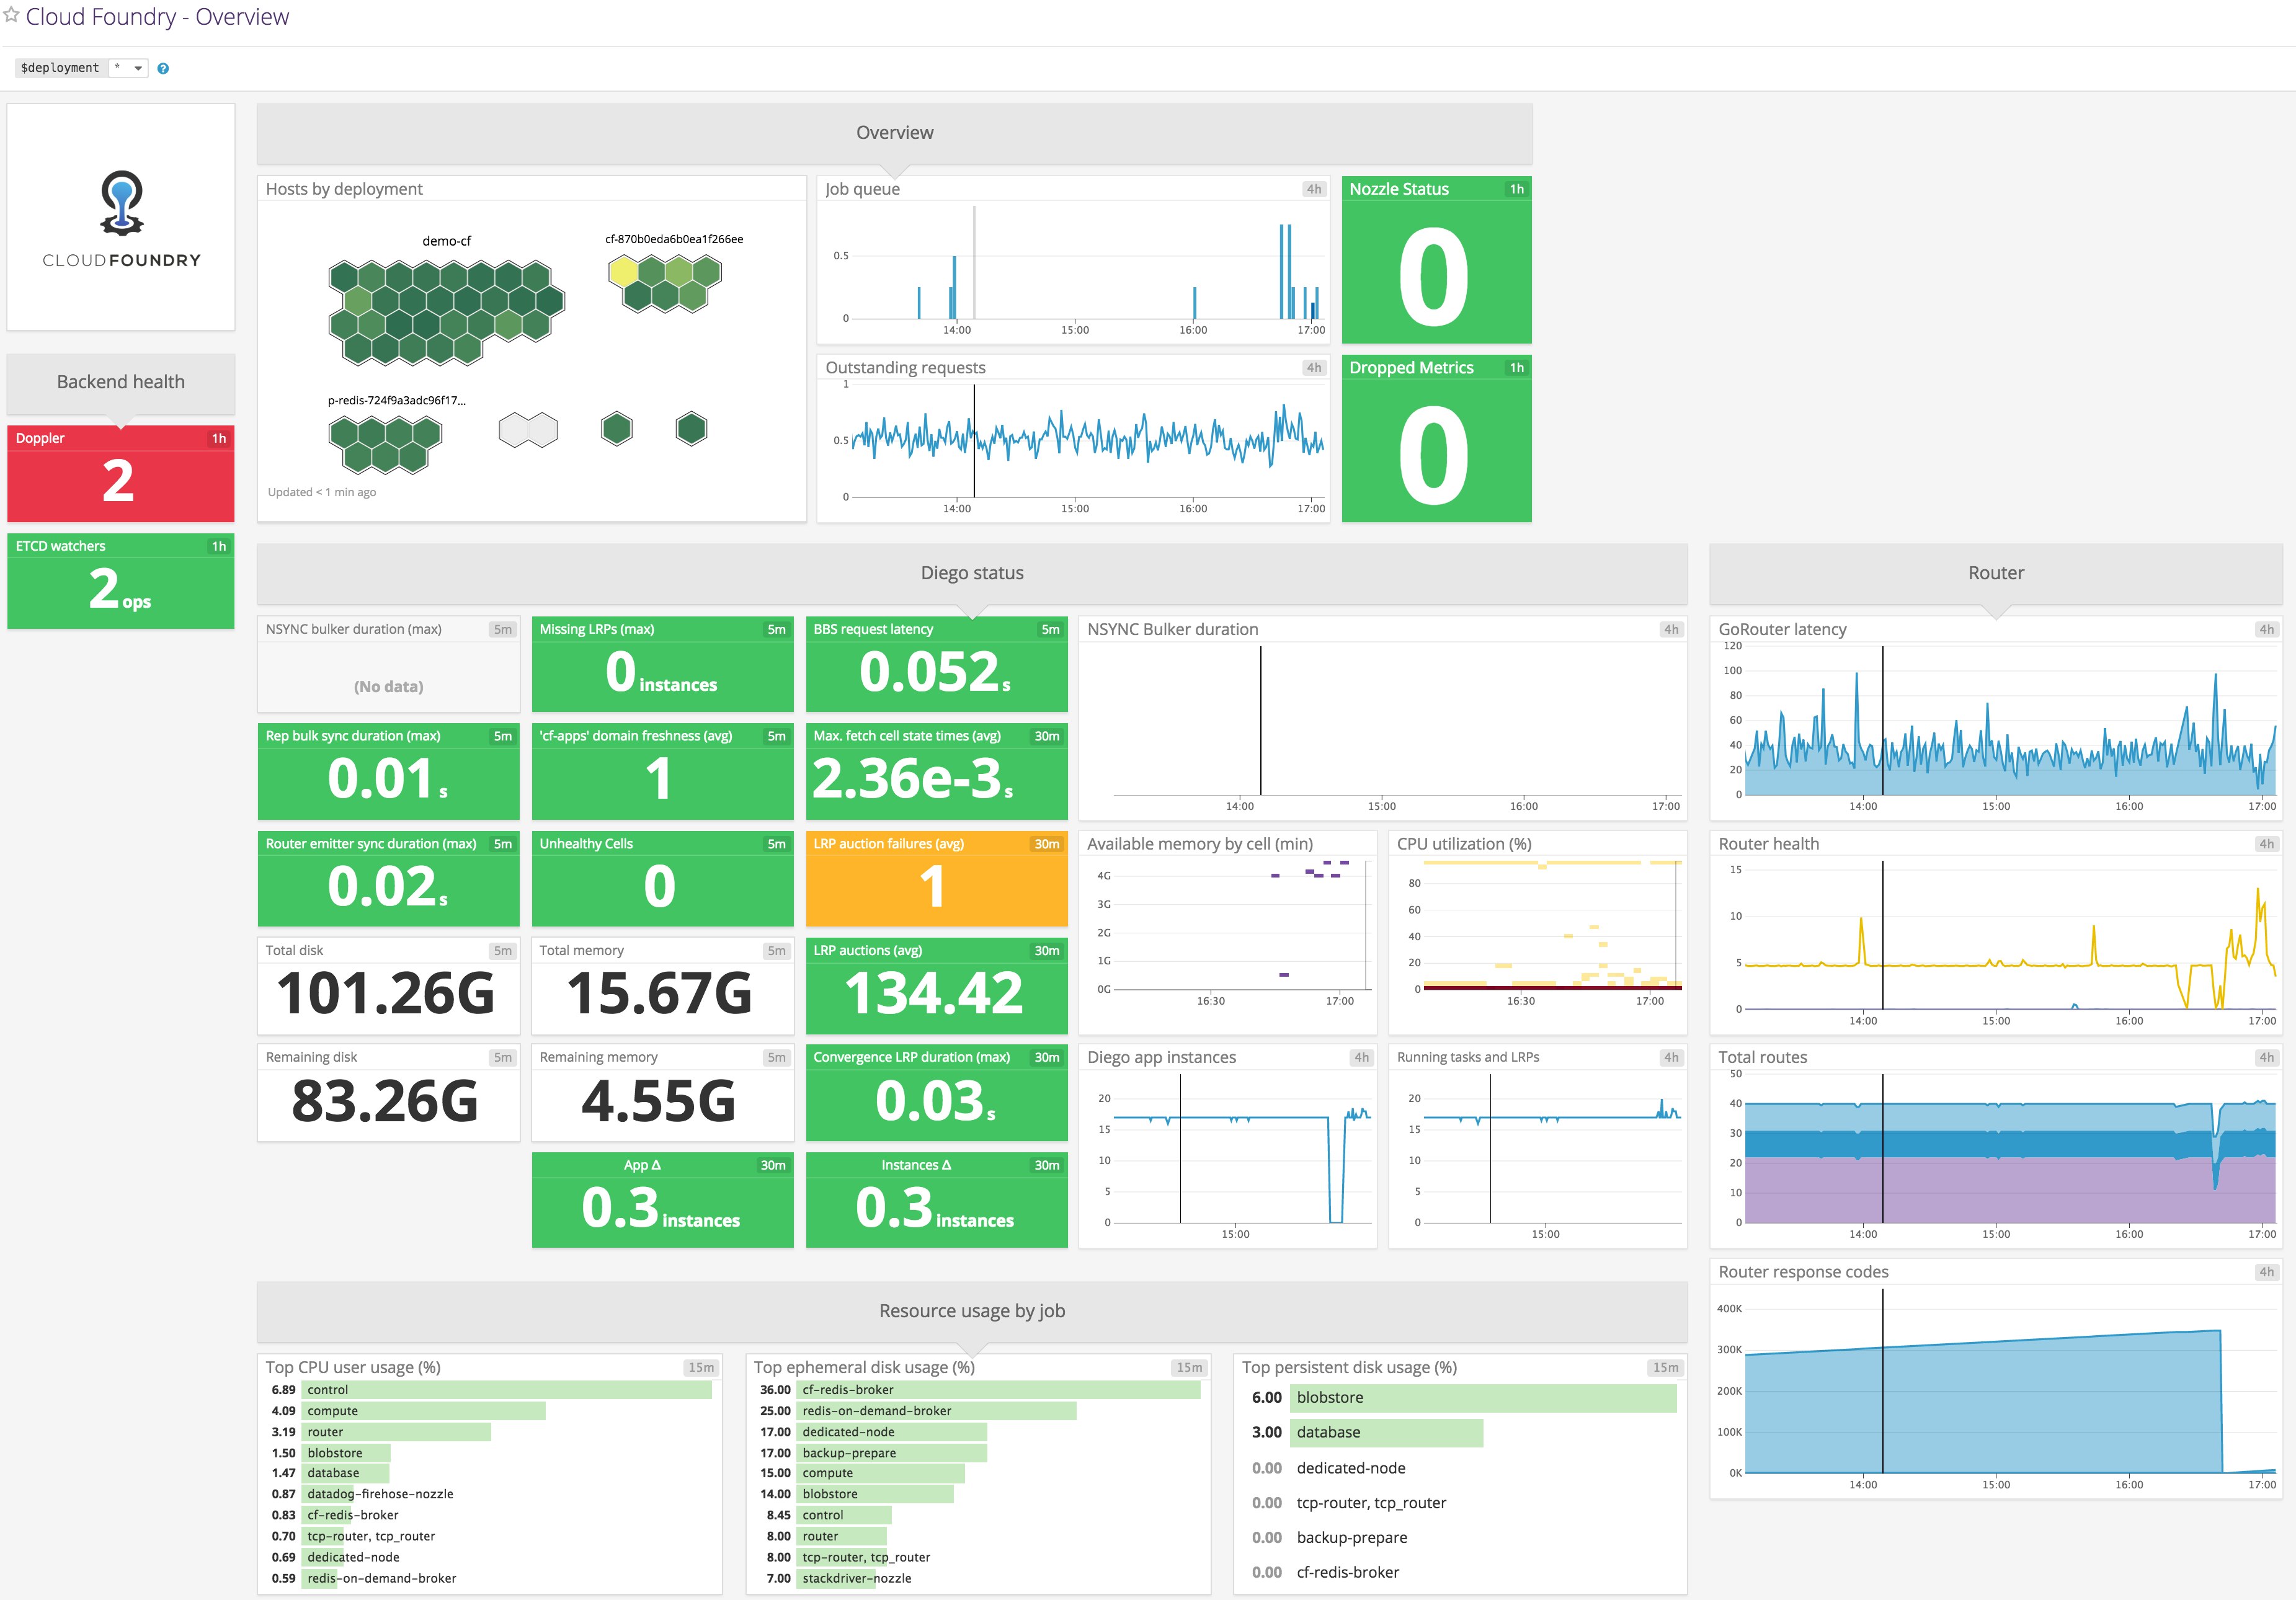
Datadog dashboards allow you to visualize and correlate any of the metrics coming from the Firehose. You can easily clone and customize Datadog’s out-of-the-box Cloud Foundry dashboard, or you can create one from scratch to focus on the performance indicators that are most important to your organization.

Alerting
In addition to dashboards, Datadog lets you set alerts on any metrics coming from Pivotal Platform. These include threshold alerts as well as machine learning–driven alerts based on metric forecasts as well as outlier and anomaly detection.
For example, below we are creating an outlier alert that evaluates the metric RepBulkSyncDuration for each Diego cell. This alert will trigger if one cell is taking significantly longer than the other cells to synchronize the number of LRPs running on its containers with the ActualLRP count from the BBS, indicating a possible communication problem between that cell and the BBS.

Alert on slow consumers
The Datadog Firehose nozzle that is deployed with the Cluster Monitoring tile generates a metric called datadog.nozzle.slowConsumerAlert. This metric provides a status check to indicate if the nozzle is ingesting messages as quickly as the Firehose is sending them. If the slowConsumerAlert metric's value is 1, that means the nozzle is not able to keep up with the Firehose. By setting an alert on this metric, operators can quickly be notified if Datadog’s connection to the deployment’s Traffic Controllers is slow or down.
Monitor applications running on Pivotal Platform with Datadog
Just as Pivotal Platform operators use Datadog’s Cluster Monitoring tile to gain visibility into their deployments, developers can use Datadog’s Application Monitoring tile to track the status and performance of their applications. The Application Monitoring tile enables developers to collect custom metrics, distributed traces, and logs from their applications running in Pivotal Platform.
Install the Application Monitoring tile
The process of installing the Datadog Application Monitoring tile is similar to installing the Cluster Monitoring tile. First, download the service tile from Pivotal Network. Then upload it to the Ops Manager and apply the changes to deploy it to your cluster.

Installing this tile will add Datadog’s Application Monitoring buildpack to your list of available buildpacks. If you list installed buildpacks via the cf buildpacks command, you should see something similar to the following:
buildpack position enabled locked filenamemeta_buildpack 1 true false meta_buildpack.zipstaticfile_buildpack 2 true false staticfile_buildpack-cached-cflinuxfs2-v1.4.28.zipjava_buildpack_offline 3 true false java-buildpack-offline-cflinuxfs2-v4.12.1.zipruby_buildpack 4 true false ruby_buildpack-cached-cflinuxfs2-v1.7.19.zipnodejs_buildpack 5 true false nodejs_buildpack-cached-cflinuxfs2-v1.6.25.zipgo_buildpack 6 true false go_buildpack-cached-cflinuxfs2-v1.8.23.zippython_buildpack 7 true false python_buildpack-cached-cflinuxfs2-v1.6.17.zipphp_buildpack 8 true false php_buildpack-cached-cflinuxfs2-v4.3.56.zipdotnet_core_buildpack 9 true false dotnet-core_buildpack-cached-cflinuxfs2-v2.0.7.zipbinary_buildpack 10 true false binary_buildpack-cached-v1.0.18.zipdatadog_application_monitoring 11 true false datadog-cloudfoundry-buildpack-v0.9.5.zipIn the next section, we'll show how you can push an application with the Application Monitoring buildpack. The buildpack includes Datadog’s DogStatsD library for collecting custom metrics and enables you to instrument your application to send traces and logs to Datadog.
Push the Application Monitoring buildpack with your application
To use Datadog’s Application Monitoring tile with your applications, you must push an application with multiple buildpacks. Adding multiple buildpacks requires a couple of additional steps beyond a standard cf-push.
First, push your application with the Cloud Foundry binary buildpack, while including a --no-start flag to keep the application from running:
cf push <app-name> --no-start -b binary_buildpackNext, you can push the application with the Application Monitoring buildpack and any other buildpacks your application needs. Pushing multiple buildpacks currently requires using the Cloud Controller’s v3 API, which you can specify by adding a v3- prefix before the push command. Note that the core required buildpack, which provides the application start command, must come last. Other buildpacks provide dependencies for the application.
cf v3-push <app-name> -b datadog-cloudfoundry-buildpack -b <second-buildpack>Configure Datadog using environment variables
Now that your application is up and running with the Datadog buildpack, you need to pass one or more configuration options to Datadog using environment variables for your application. You can either use the cf set-env command to set environment variables, or you can add the environment variables to a manifest file for your application. We'll detail each of those approaches below.
Option 1: Set environment variables from the command line
At minimum, you need to set an environment variable to provide your Datadog API key so that your application data will appear in your Datadog account:
cf set-env <app-name> DD_API_KEY <api-key>With Datadog APM, you can visualize distributed traces across your application. If you're using APM, it’s recommended that you attach a service name and add tags so you can easily search, filter, and aggregate the data from your application in Datadog. For example:
cf set-env <app-name> DD_SERVICE_NAME pcf-appcf set-env <app-name> DD_TRACE_SPAN_TAGS 'env:maxim-pcf'The DD_SERVICE_NAME variable tags all traces from our application with the service name (pcf-app, in this case), which lets you focus on performance data from individual services in Datadog and correlate request traces with other monitoring data from that same service. The DD_TRACE_SPAN_TAGS variable adds the provided tags to all traces from your application, so that you can quickly and easily drill down into the specific subsets of your data (e.g. request traces from different environments).
Finally, restage your application to pick up the changes:
cf restage <app-name>Option 2: Set environment variables using a manifest file
Rather than configuring Datadog via cf set-env, you can also use a manifest.yml file to set these variables when pushing your application. When you initiate cf push, Cloud Foundry will automatically detect a manifest file in the current working directory. Or you can point to a file in a different directory:
cf push -f path/to/manifest.ymlA manifest file can also be used to include other requirements specific to your application, such as the dd-java-agent.jar for tracing requests to Java applications. A simple manifest file that configures an application to send traces to Datadog for application monitoring might resemble the following:
applications:- name: <app-name> memory: 1G env: JAVA_OPTS: '-javaagent:BOOT-INF/lib/dd-java-agent.jar' DD_API_KEY: <api-key> DD_SERVICE_NAME: pcf-app DD_TRACE_SPAN_TAGS: 'env:maxim-pcf'Whether you set your environment variables via the command line or using a manifest file, you should now have a running application that is configured to report custom metrics and distributed traces to Datadog.
Instrument your application to send custom metrics to Datadog
The DogStatsD binary included in the Datadog Application Monitoring buildpack lets you emit custom metrics from your application using an appropriate client library.
For example, in a Spring Boot Java application, we can use the java-dogstatsd-client library. First we initialize the StatsDClient, including any tags we want to apply to our metrics:
private static final StatsDClient statsd = new NonBlockingStatsDClient( "pcf.app", /* prefix to any stats; may be null or empty string */ "localhost", /* common case: localhost */ 8125, /* port */ new String[] {"env:maxim-pcf"} /* Datadog extension: Constant tags, always applied */);Then, we can use the client to create and increment our custom metrics. For example, in a simple dictionary application, you can increment a searches metric when a search is performed and a missedWords metric if no definition is found:
statsd.incrementCounter(“searches”);statsd.incrementCounter(“missedWords”);Your custom application metrics will automatically appear in Datadog. You can then visualize them, correlate them with metrics from the underlying infrastructure, and set alerts so you can be notified of any unexpected application behavior. Below, we’ve graphed searches and missedWords. Note that pcf.app has been prepended to both metrics, as we specified when configuring the client.

Instrument your Pivotal Platform application for tracing
Using Datadog APM lets you visualize how individual requests were executed and provides request throughput, latency, and error statistics for every service, endpoint, and database query. Datadog APM supports distributed tracing in Java, Python, Ruby, Go, Node, and .NET. Visit the APM documentation for your language to learn how you can start instrumenting your application.
By instrumenting your code for APM, you can get granular insights into application performance, as well as how your application interacts with other services. Datadog APM provides out-of-the-box support for various data stores that are available as managed services for Pivotal Platform, so developers using those data stores will have instant visibility into the data layer of their applications. And with the Datadog Service Map, you can visualize the request traffic between your application and any related services to identify dependencies and potential bottlenecks.
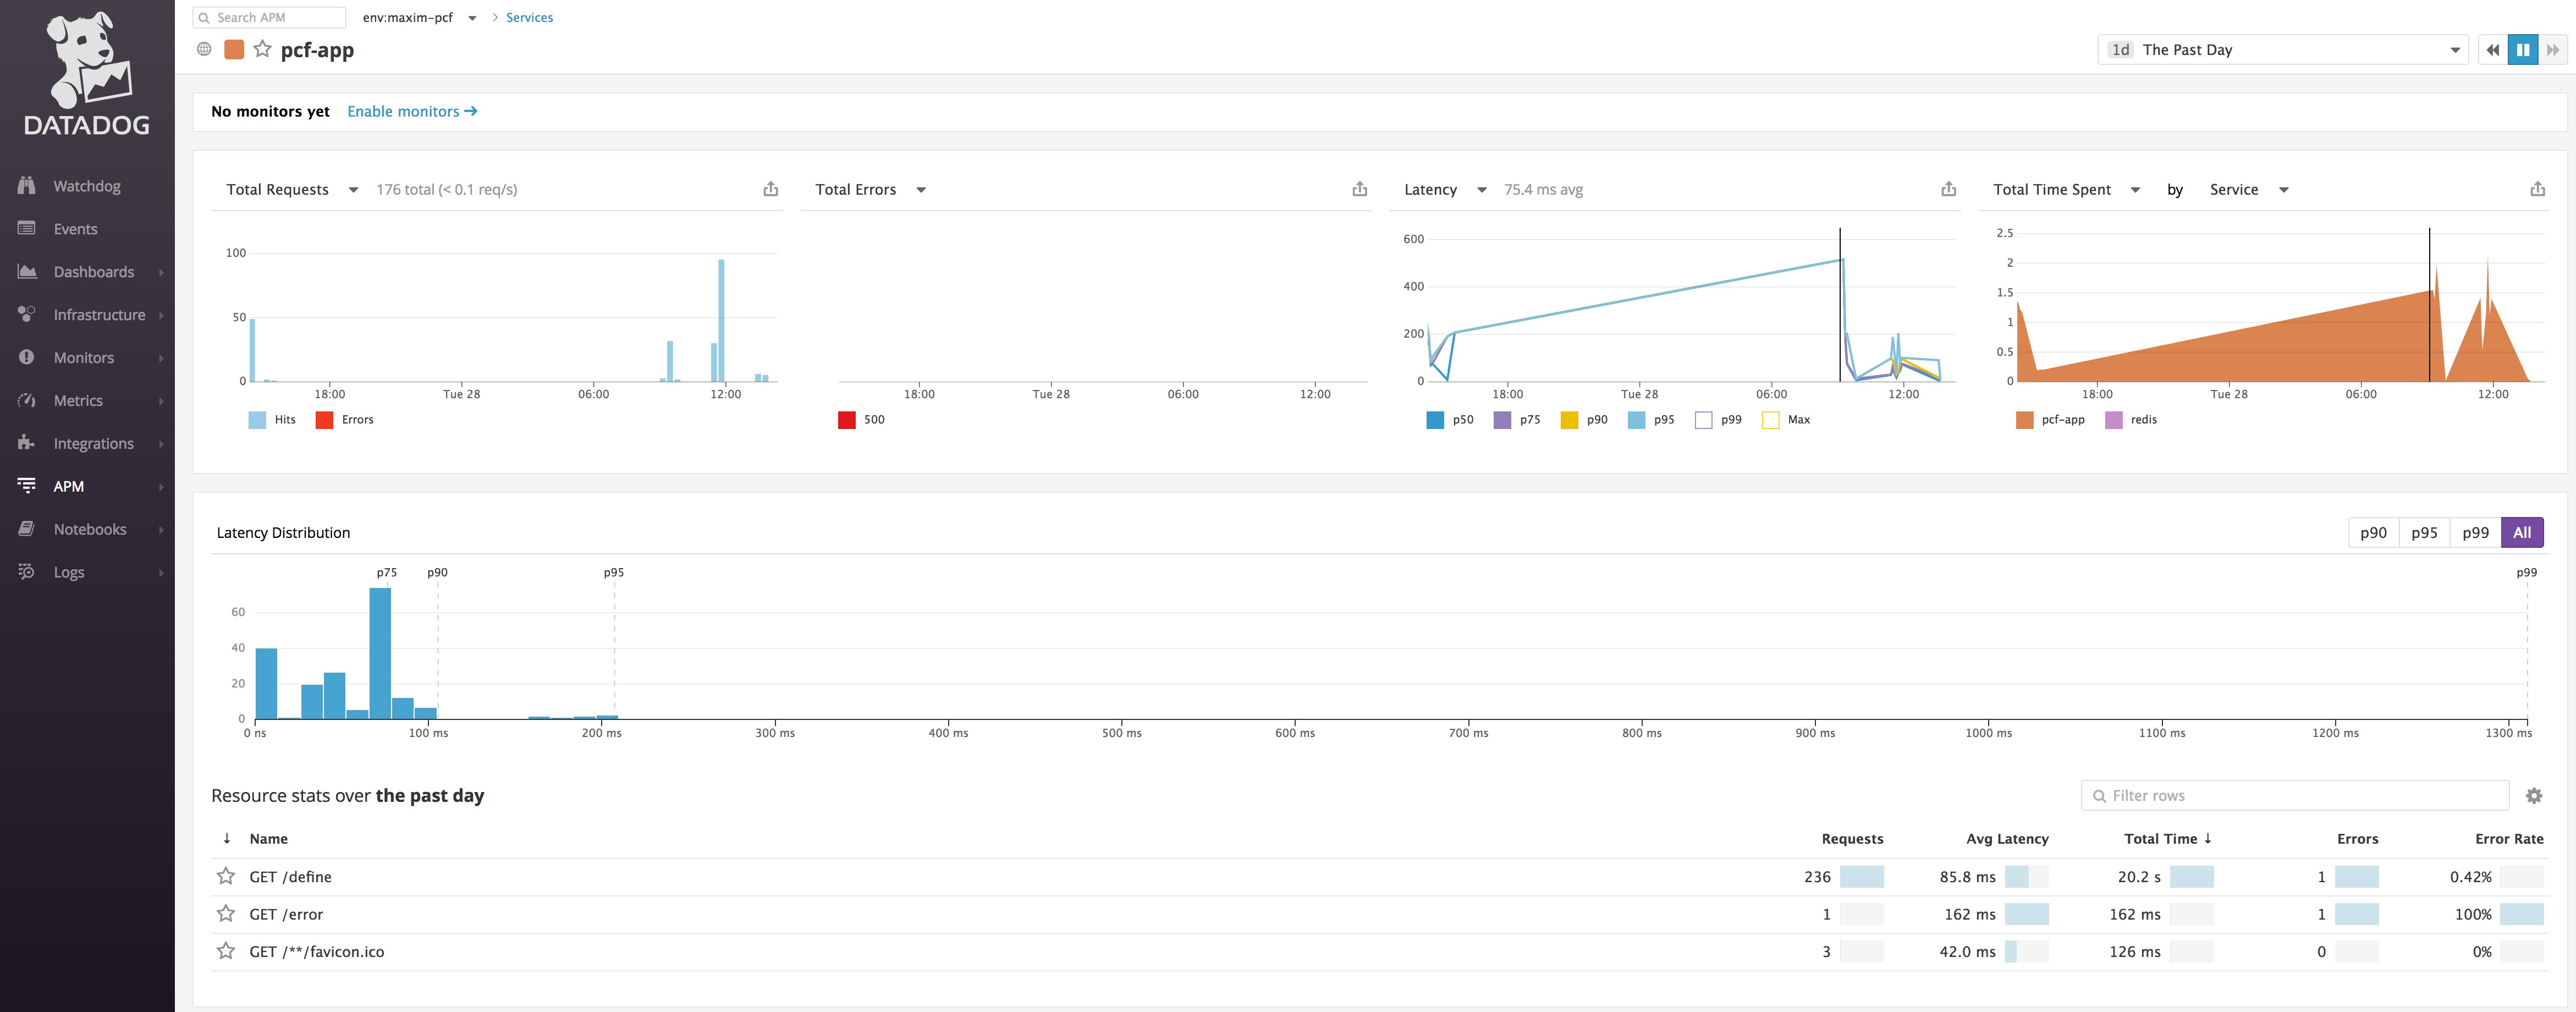
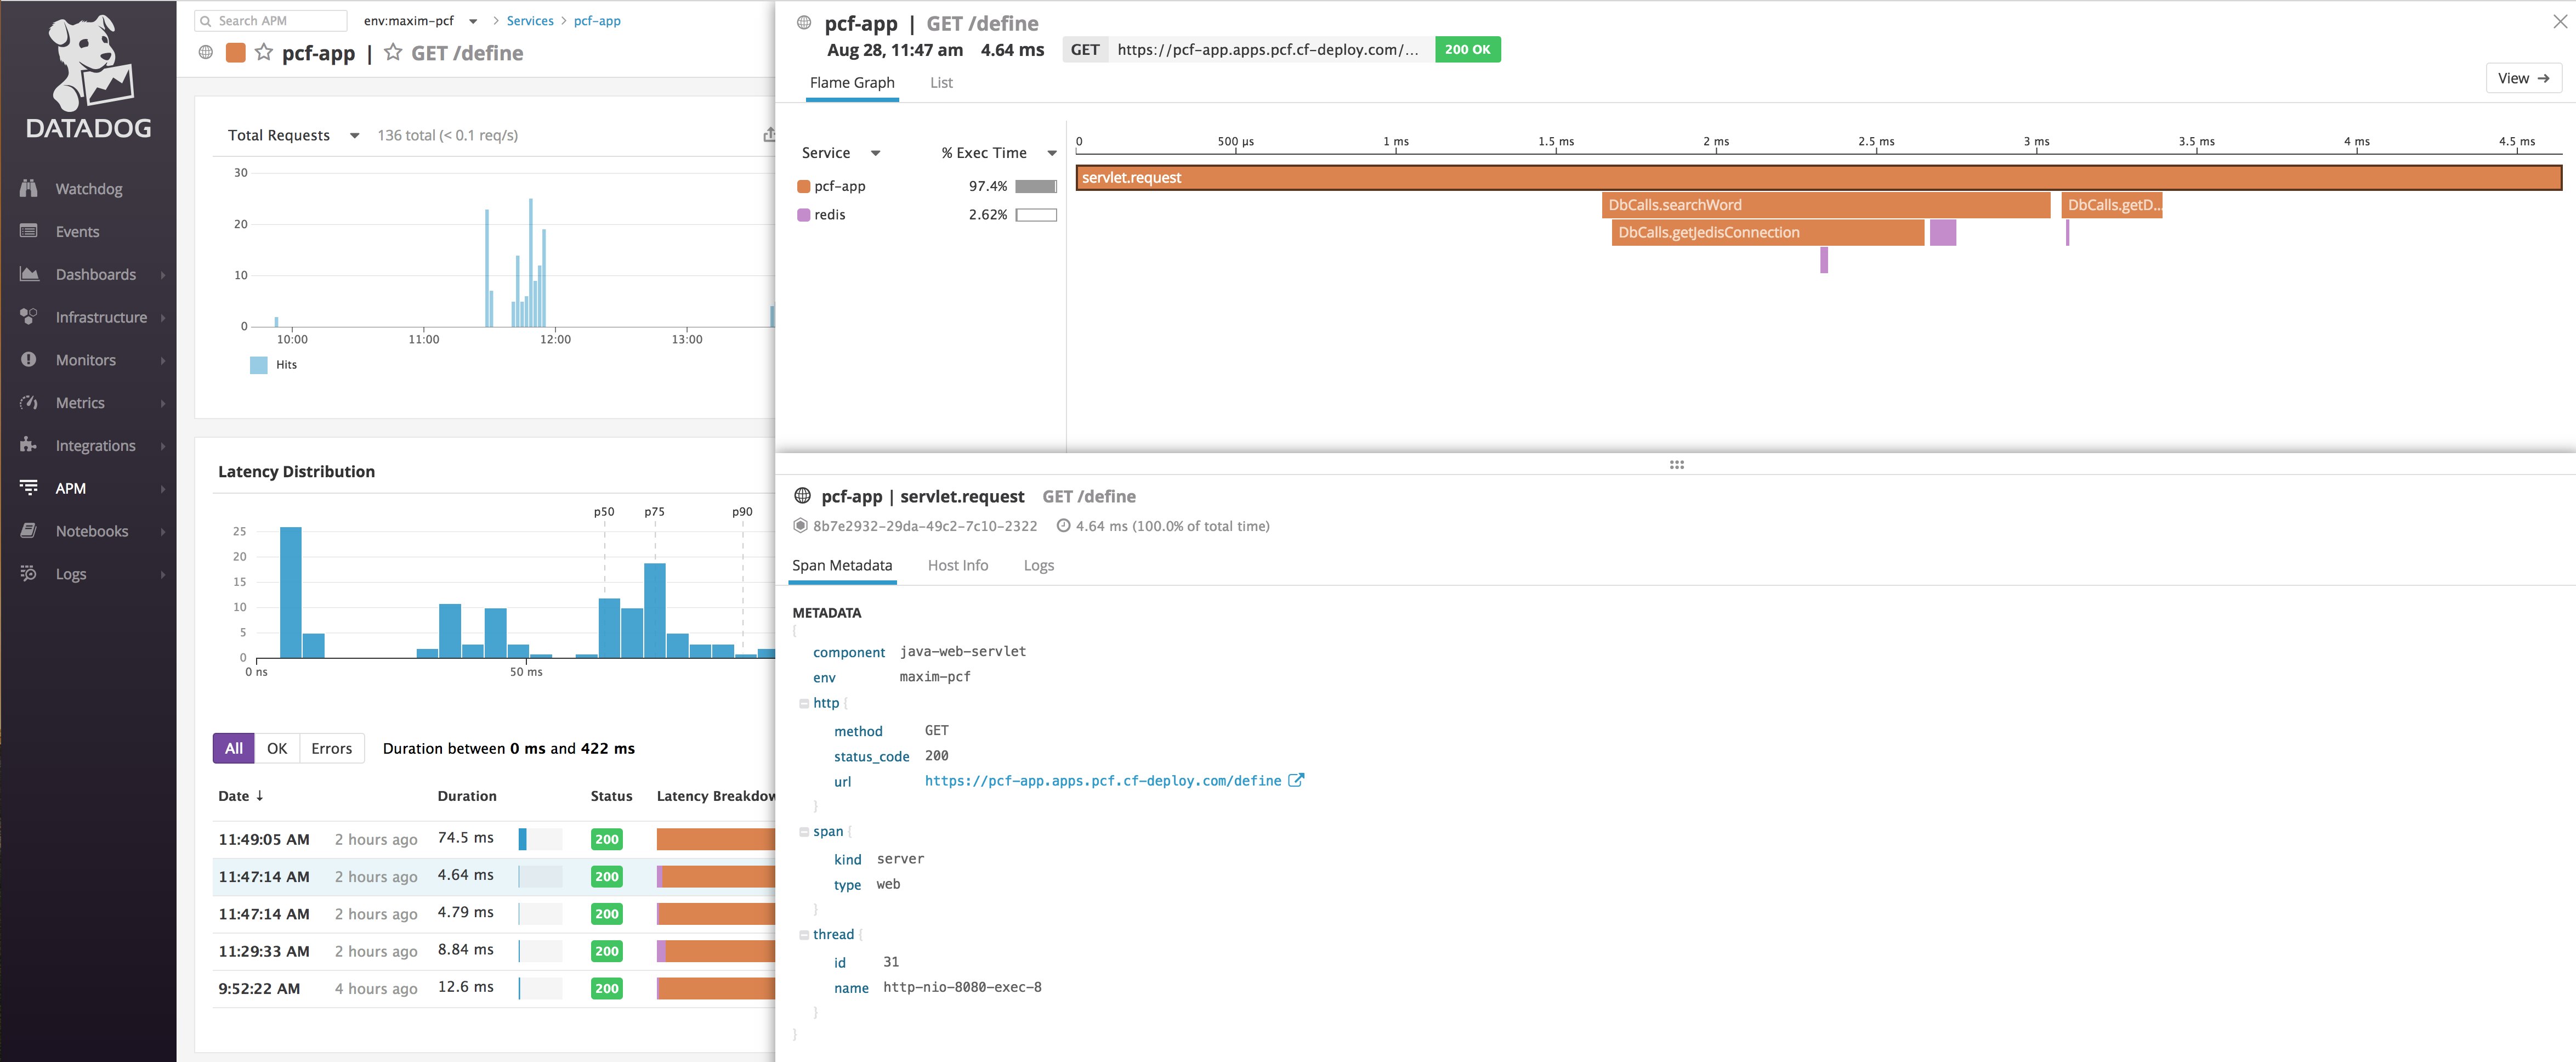
Datadog filters APM data by environment and then by service name. Both of these can be set using environment variables as described above. (If you do not provide values, Datadog will default to env:none and attempt to pull the service name from the application.) In Datadog APM, you can view graphs of performance metrics that are automatically aggregated for any service or for individual resources (application endpoints, request types, or specific database queries) within a service, including request throughput, error rates, and latency percentiles.
Drilling down to a single trace will display a flame graph that provides a detailed breakdown of how a particular request was executed. You can see at a glance which services helped fulfill the request, how long each operation in the request took, and where any errors arose in the request pathway. You can also see metrics from the application host, to identify any infrastructure issues or resource constraints, as well as relevant logs from the same timeframe.
Collect application logs in Datadog
As of version 0.9.5 of the Datadog Application Monitoring tile, developers can use the tile to collect application logs in addition to custom metrics and traces. The log collection feature of the Application Monitoring tile automatically collects and forwards application logs to Datadog for alerting, correlation, analysis, and archiving.
To enable log collection, set the following environment variables, either from the command line or using a manifest file:
RUN_AGENT trueDD_LOGS_ENABLED trueDD_ENABLE_CHECKS falseSTD_LOG_COLLECTION_PORT <port>LOGS_CONFIG '[{"type":"tcp","port":"<port>","source":"<source>","service":"<service>"}]'STD_LOG_COLLECTION_PORT is used when collecting stdout/stderr logs to redirect them to a specific local port, for example 10514.
The final variable, LOGS_CONFIG, includes a few pieces of information. First, it tells the Agent to listen to the port specified by STD_LOG_COLLECTION_PORT. It also sets the source and service parameters for logs coming from the application. The source makes it easy to route logs to the appropriate log processing pipelines in Datadog. The service tag lets Datadog automatically unify the metrics, traces, and logs from your application so you can navigate between them. For example, if you are alerted to a higher than normal number of error logs, you can dive into corresponding APM data from the service to identify which endpoint or resource is having issues. Below is an example of this configuration:
LOGS_CONFIG '[{"type":"tcp","port":"10514","source":"cloud_foundry","service":"pcf-app"}]'Once you restage your application, logs will start streaming into the Log Explorer:
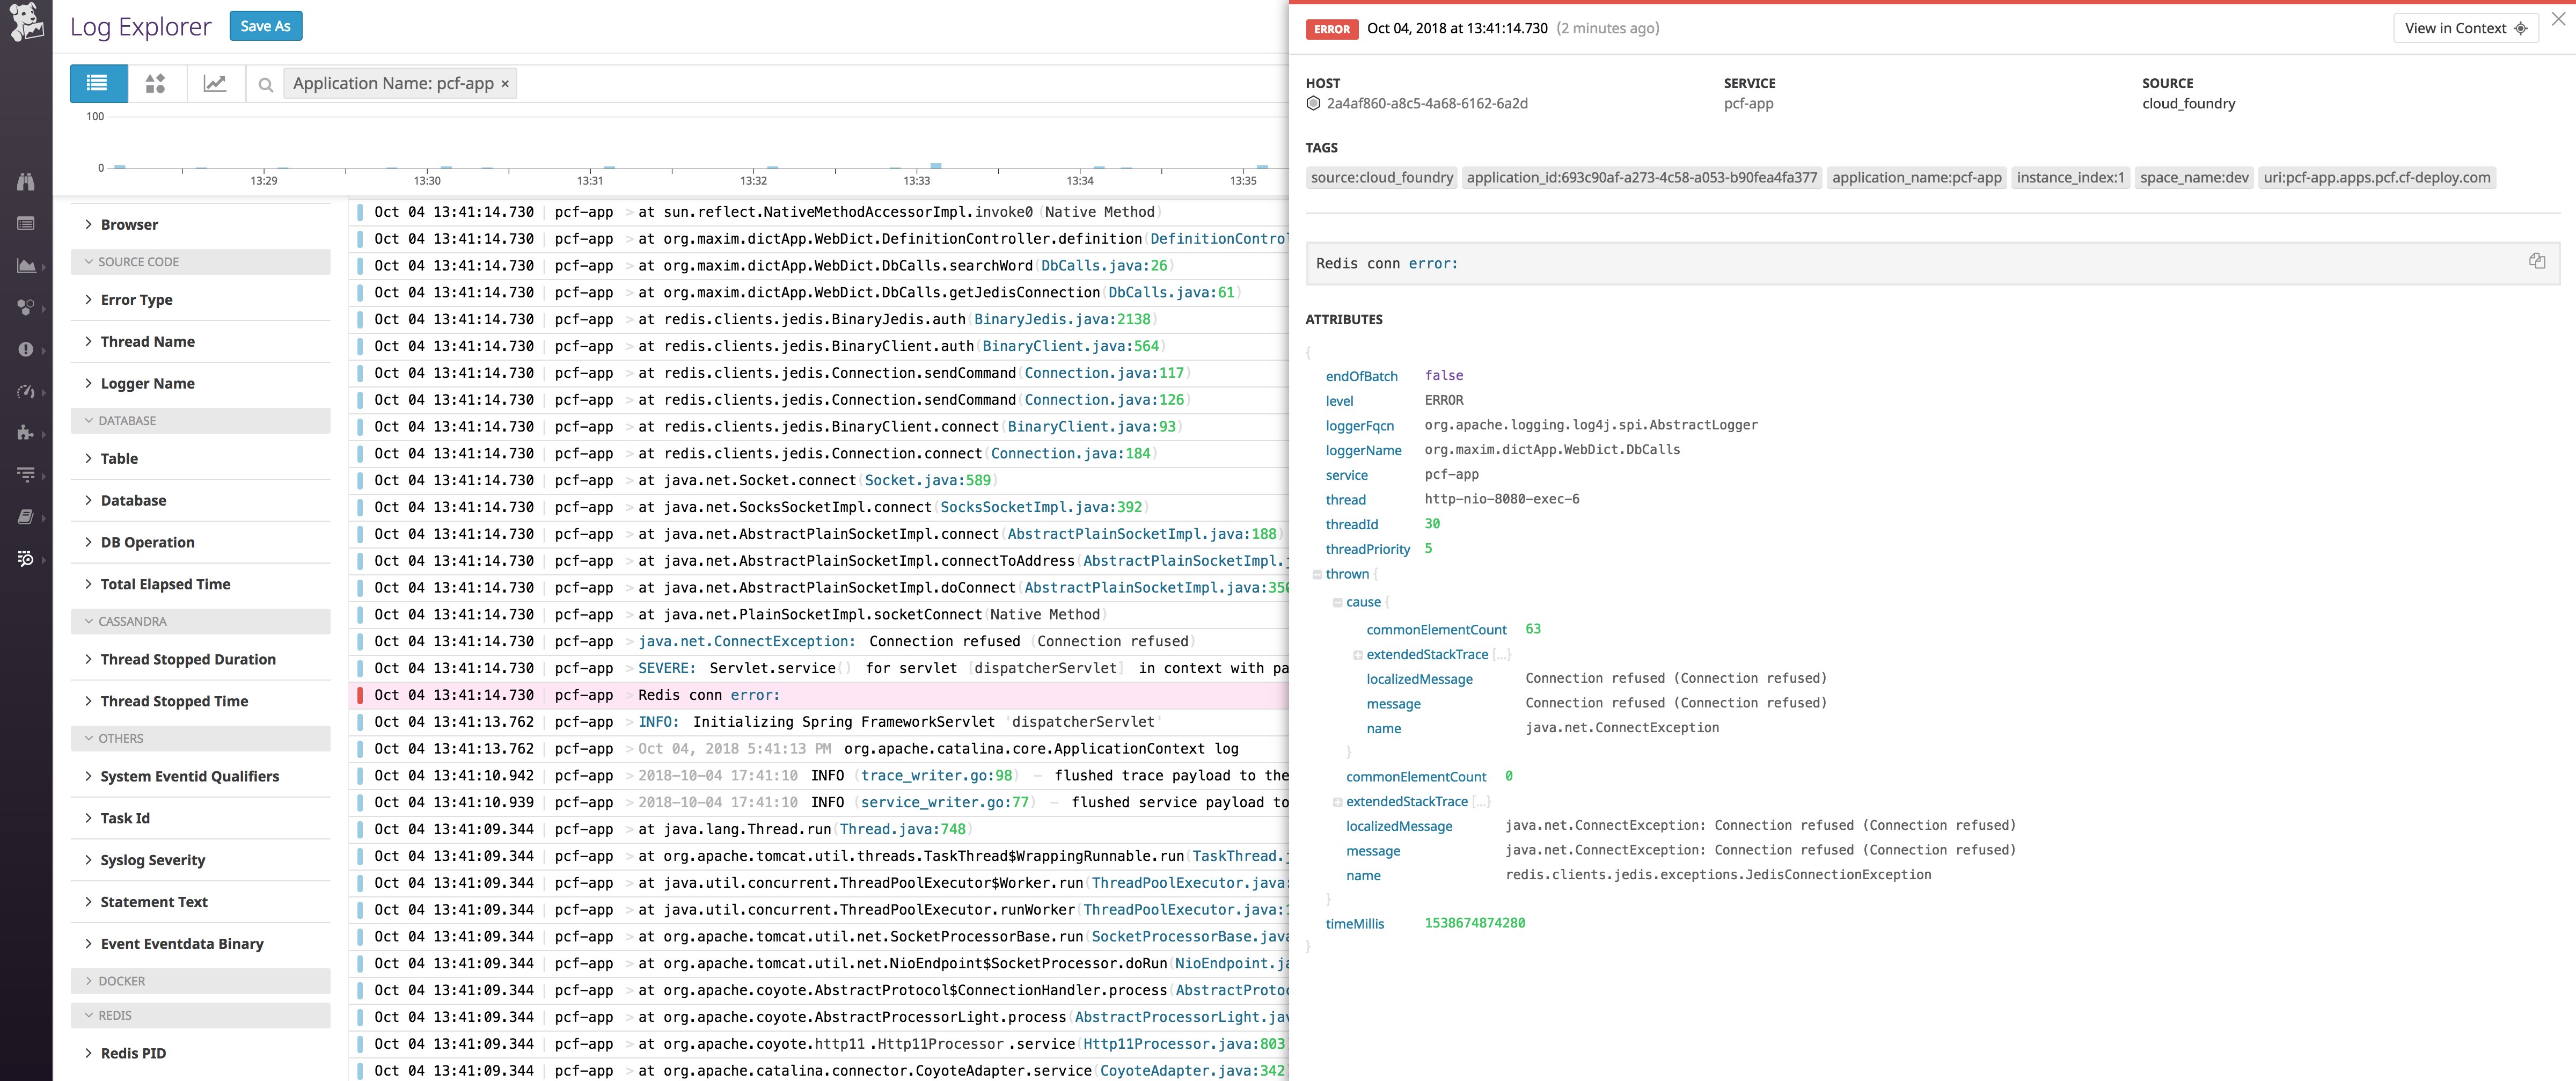
cf restage <app-name>Datadog automatically applies certain Cloud Foundry properties as tags to your logs. For example, the logs will include an application_name tag. Creating facets from these tags allows you to easily search, filter, and drill down into a specific application’s log data.
To make it even easier to parse and view log data, you can configure your application to write logs in JSON format, if your logging library supports it. Datadog will automatically read the logs’ data fields and create attributes from them:
With custom metrics, traces, and logs, the Datadog Application Monitoring tile lets developers get deep insight into the performance of their applications and makes it easy to investigate and troubleshoot problems.
Collect system logs with Datadog
Recall from part three of this series that Pivotal Platform component system logs, or logs from the internal processes running on the individual components that make up a Pivotal Platform cluster, are sent via rsyslog to a syslog drain, or an external syslog endpoint. They are not collected by Loggregator.
You can collect Pivotal Platform component system logs with Datadog by setting up your platform to forward them to a syslog server. Then, you can configure a log processor (for example, rsyslog) to route them to Datadog.
To enable your deployment to forward system logs, first click on the System Logging tab of the Pivotal Application Services tile in the Ops Manager. Then provide the URL or IP address of your syslog endpoint or server and an open TCP port. Note that your syslog server must use the RELP protocol in order to receive syslogs from Pivotal Platform.
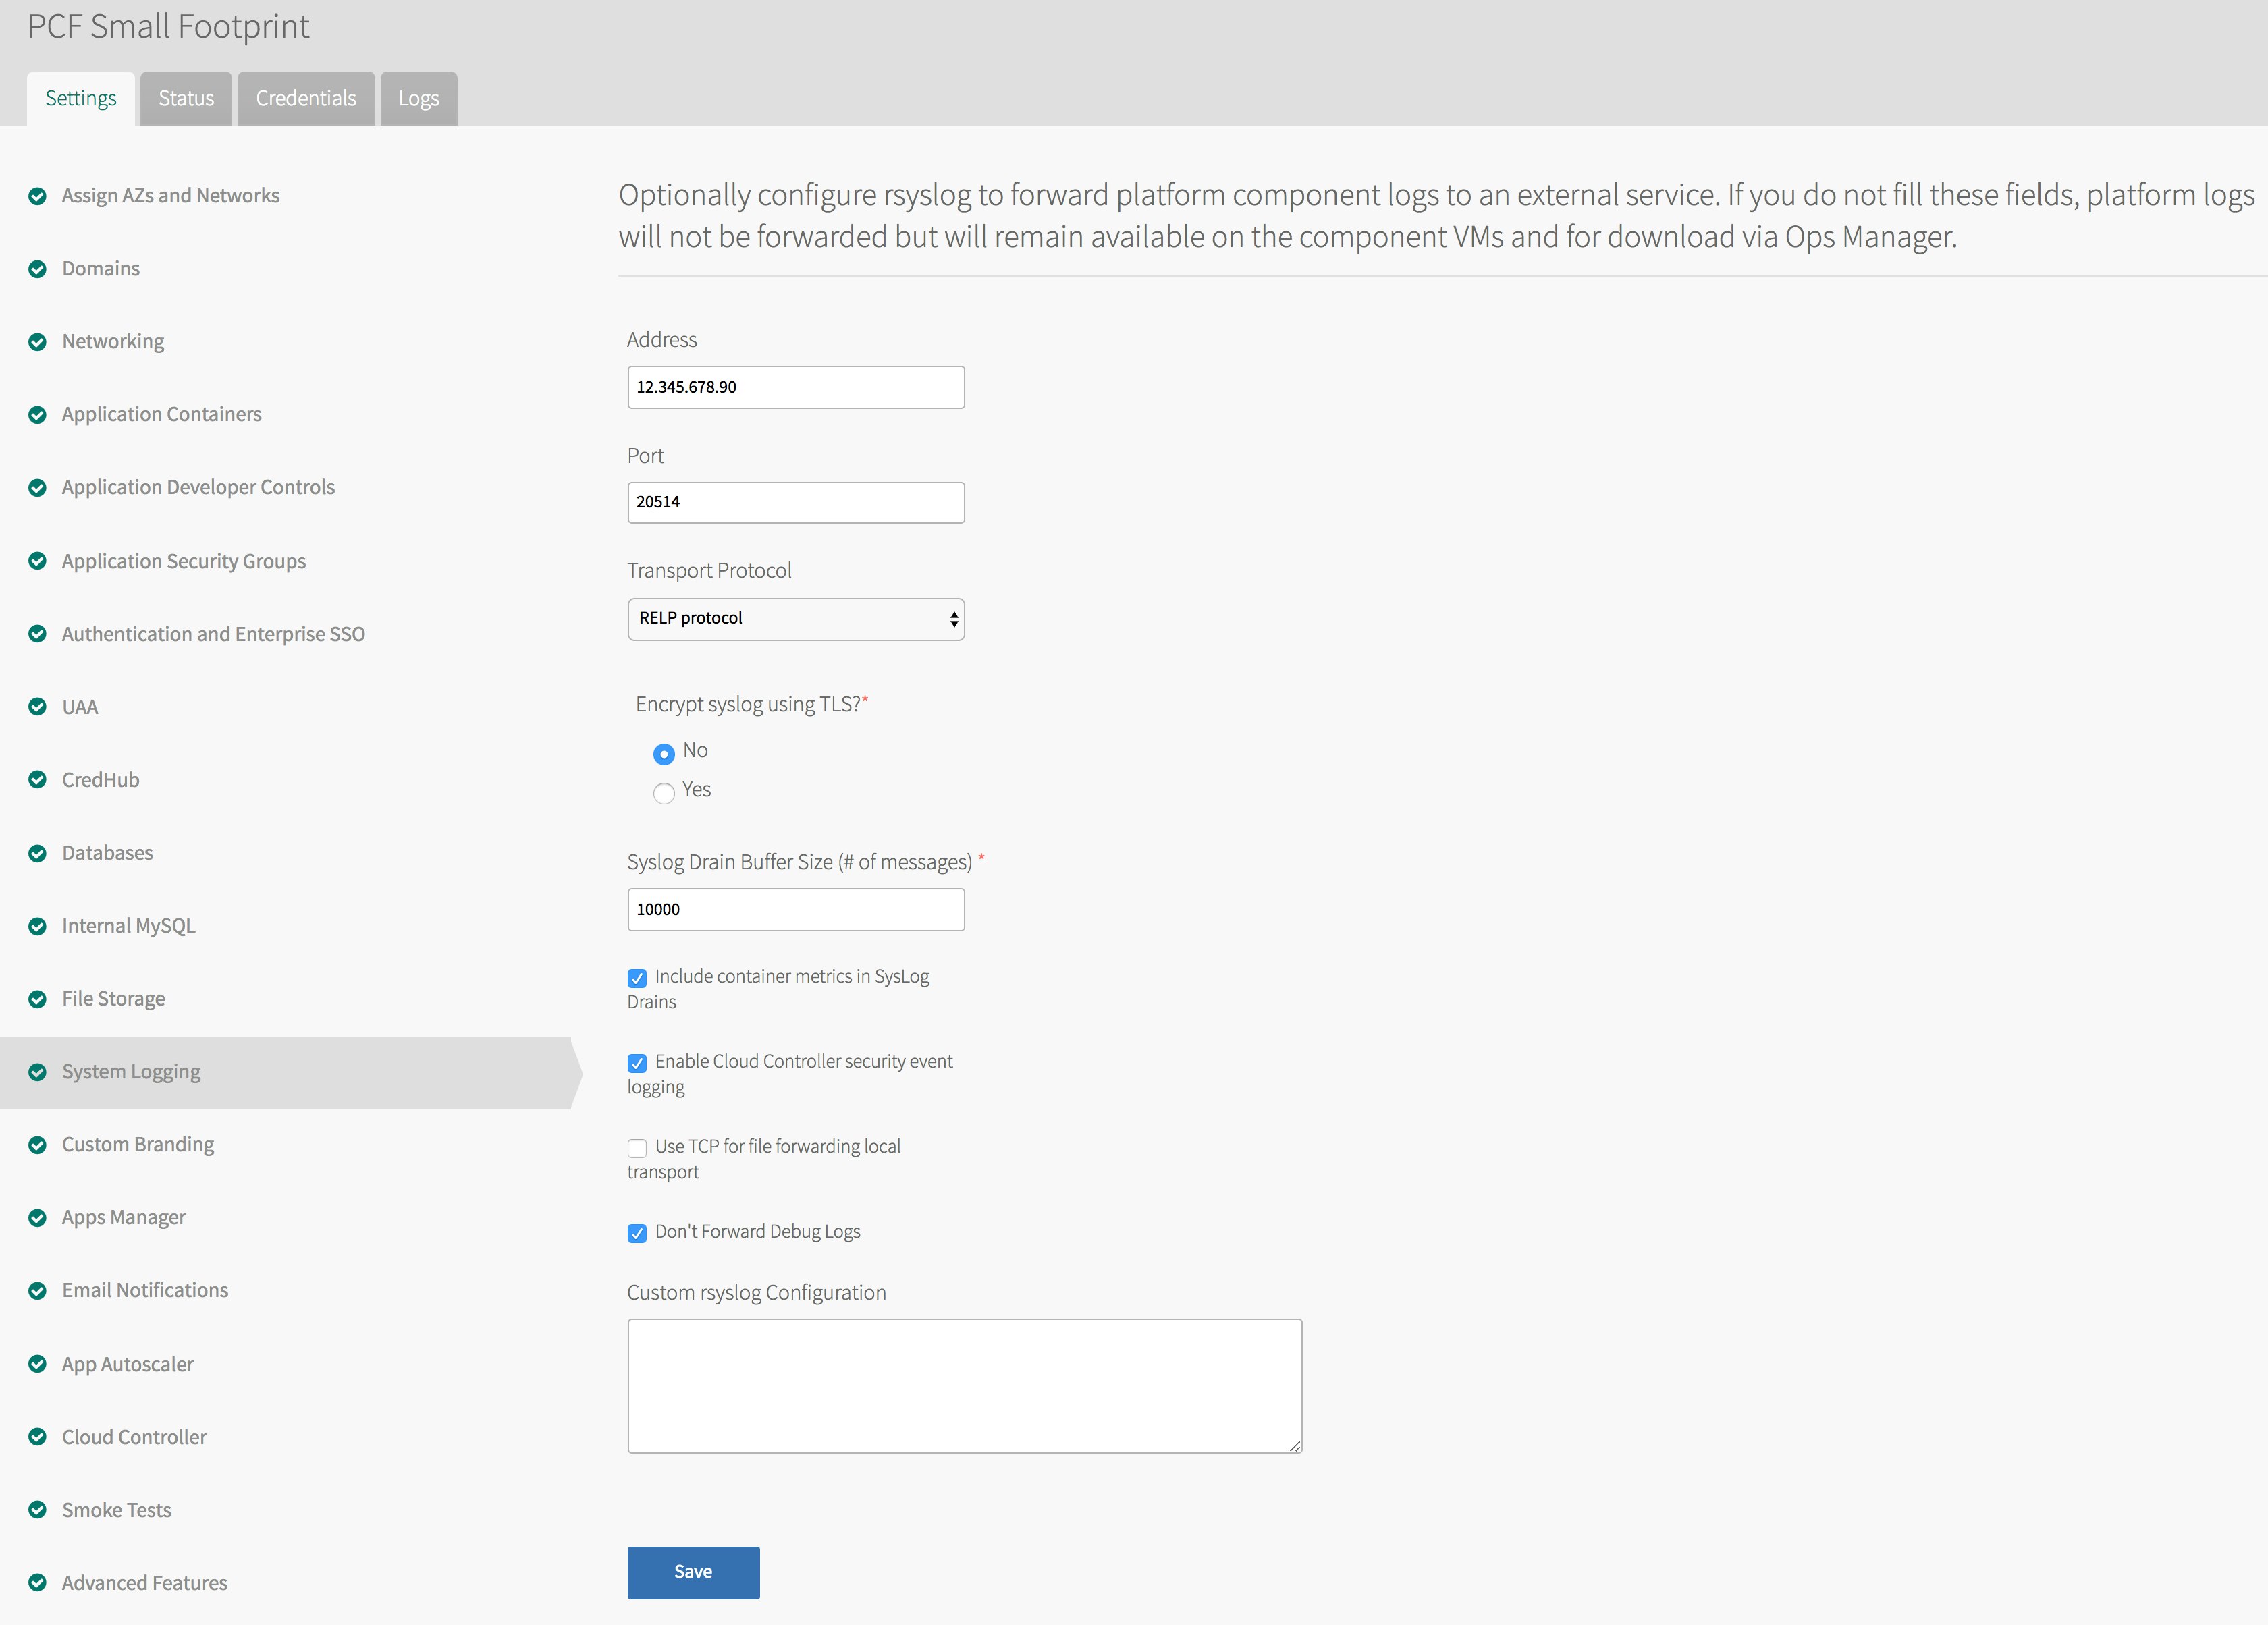
Once you deploy these changes, your cluster will begin forwarding all system logs to the endpoint. Note, however, that these forwarded logs do not include system logs produced by the VMs for add-on services, such as Redis or Pivotal Healthwatch. You will need to follow similar steps to configure log forwarding for those services that support it. For example, the Redis service tile has a tab labeled Syslog where you can enter your endpoint’s information.
Separate your cluster’s logs from the server’s logs
By default, an external syslog server will treat incoming system logs like its own and write them to its syslog file. Configuring rsyslog to write these incoming logs to a separate file makes it much easier to forward only the cluster’s system logs to Datadog.
A syslog-format message includes the hostname or IP address of the log’s source. We can use this to target logs from our cluster because the VMs' internal IP addresses all begin the same way, in most cases.
For example, to target logs from IP addresses beginning with 10.0.4., create an rsyslog configuration file in the /etc/rsyslog.d folder and add the following lines:
if $hostname startswith '10.0.4.' then /var/log/pcf-sys.logif $hostname startswith '10.0.4.' then stopThis configuration instructs rsyslog to look for logs coming from any of our deployment’s VMs (as identified by their IP addresses) and write them to a separate file, pcf-sys.log. The second line prevents rsyslog from also writing them to the standard syslog file. You can adjust your rules to segregate logs as you see fit. See rsyslog’s documentation for more details.
Forward logs to Datadog
Now that we have our Pivotal Platform system logs in their own file, we can configure rsyslog to forward them to Datadog. First, create a datadog.conf file in the /etc/rsyslog.d directory on your syslog server. Add the following lines to the newly created config file, replacing <API-KEY> with the API key for your Datadog account and <ENV-TAG> with the name of your environment:
input(type="imfile" ruleset="infiles" File="/var/log/pcf-sys.log")
$template DatadogFormat,"<API-KEY> <%pri%>%protocol-version% %timestamp:::date-rfc3339% %HOSTNAME% %app-name% - - [metas ddsource=\"cloud_foundry\" ddtags=\"env:<ENV-TAG>\"] %msg%\n"
ruleset(name="infiles") { action(type="omfwd" target="intake.logs.datadoghq.com" protocol="tcp" port="10514" template="DatadogFormat")}The first line of the config snippet above instructs rsyslog to look for logs in our Pivotal Platform system log file.
Next, the config provides the log template that includes our Datadog API key. Note that in the example above, we’ve set the logs’ source and added tags. Adding tags such as env makes it easier to drill down and find the logs you want to view.
Finally, the configuration creates a ruleset for the applicable logs, specifying the Datadog endpoint where logs should be sent. Save the file and restart rsyslog:
sudo service rsyslog restartLogs will now be flowing into Datadog, where you can build custom log-processing pipelines. These pipelines let you parse and enrich logs so you can more easily search, filter, and aggregate the data in your logs on the fly. You can also build alerts and graphs from your logs to visualize and correlate with your metrics.
Logging without Limits™
Pivotal Platform produces a large volume of system logs, and managing them all can be a challenge. Datadog’s Logging without Limits™ approach means that you can ship all your logs, without worrying about gaps or missing data, and use Datadog to filter or retain them on the fly. By sending all your logs to Datadog, you have full visibility when you need it for troubleshooting and analysis, but you can also customize your processing pipelines and filters to exclude unnecessary logs.
If, however, your syslog server becomes a bottleneck for log forwarding, the System Logging tab of the Ops Manager provides the option to customize which system logs Pivotal Platform will forward, allowing you to limit the volume of messages. The Ops Manager supports syslog rules using RainerScript syntax. So, for example, the following rule would filter out any system logs not emitted by the cell Reps:
if not ($app-name startswith 'rep') then stopYou can create additional rules and filter conditions to have Pivotal Platform forward only those logs you want to monitor, analyze, or archive with Datadog.
Get started
In this post we’ve covered how both Pivotal Platform operators and developers can use Datadog to get deep visibility into their cluster and applications, respectively. The Datadog Cluster Monitoring tile gives operators key insights into their Pivotal Platform infrastructure by tapping into the Firehose stream, letting them visualize and alert on all of the key metrics covered in part two of this series, plus many more. And, with Datadog's integrations with cloud providers including AWS, Google, Azure, and others, operators can easily visualize their Pivotal Platform metrics alongside those from their underlying infrastructure.
Developers deploying applications to a Pivotal Platform cluster can push them with the Datadog Application Monitoring buildpack so that they can monitor the performance of their applications with custom metrics and traces. Finally, we outlined how to ship both application logs and Pivotal Platform system logs to Datadog, letting you apply Datadog’s powerful log analytics features to the full range of logs available from Pivotal Platform.
If you’re new to Datadog, you can sign up for a free 14-day trial to start monitoring your Pivotal Platform deployment and applications today.


