Brad Menezes
Open, transparent, extensible instrumentation has always been a core part of Datadog. From our open source Agent to our instrumentation libraries for custom metrics to our distributed tracing clients for APM, we pride ourselves on the openness of our client-side instrumentation.
So we are excited to announce Datadog support for OpenTracing, the vendor-neutral, open standard for distributed tracing. Our Go tracer now supports OpenTracing, and other tracing clients for Datadog APM will follow soon.
As part of our continued dedication to open source, today we are also joining the Cloud Native Computing Foundation, which hosts OpenTracing as a member project, and we are joining the OpenTracing Specification Council to play an active role in shaping the future of the standard.
About OpenTracing
OpenTracing provides APIs in several languages that can be used to log request spans to a number of pluggable backends. Because it is a vendor-neutral standard, OpenTracing enables you to easily port your applications from one distributed tracing backend to another, with minimal changes to code-level instrumentation. The OpenTracing project began in 2015 and was accepted into the CNCF (the foundation that also hosts the Kubernetes project and several others) in October 2016.
OpenTracing and you
Adopting the OpenTracing standard will allow our customers to tap into the deep, request-level visibility provided by distributed tracing, without concern for vendor lock-in or the need for costly code changes in the future. And by joining the OpenTracing Specification Council, we can ensure that our customers’ voices are heard as the standard evolves.
Set up monitoring and distributed tracing with open instrumentation and Datadog APM.
Instrumenting a Go app

To see how Datadog and OpenTracing work together, let’s look at a simple Gin web application (source code available here) that is instrumented for request tracing using the OpenTracing API. Thanks to the portability of vendor-neutral instrumentation, you can then plug in Datadog’s Go tracer, or any other compatible tracer, in just a few lines of code.
Adding Datadog as a tracing backend
The example code is already instrumented using the opentracing-go library. Now, to start sending data to Datadog, you can import the Datadog Go tracer:
import ( // Import Datadog tracer datadog "github.com/DataDog/dd-trace-go/opentracing"
"github.com/gin-gonic/gin" "github.com/opentracing/opentracing-go"
// ...)Finally, you just need to initialize the Datadog Tracer and use the OpenTracing API to set it as a Global Tracer so that it can be retrieved everywhere in the application code:
func main() { // configure and initialize the Datadog Tracer config := datadog.NewConfiguration() config.ServiceName = "api-intake" tracer, closer, _ := datadog.NewTracer(config) defer closer.Close()
// Set it as a Global Tracer opentracing.SetGlobalTracer(tracer)
router := gin.Default() // ...}The snippet above sets some configurations for our tracer—in particular, adding the ServiceName to identify the service in Datadog.
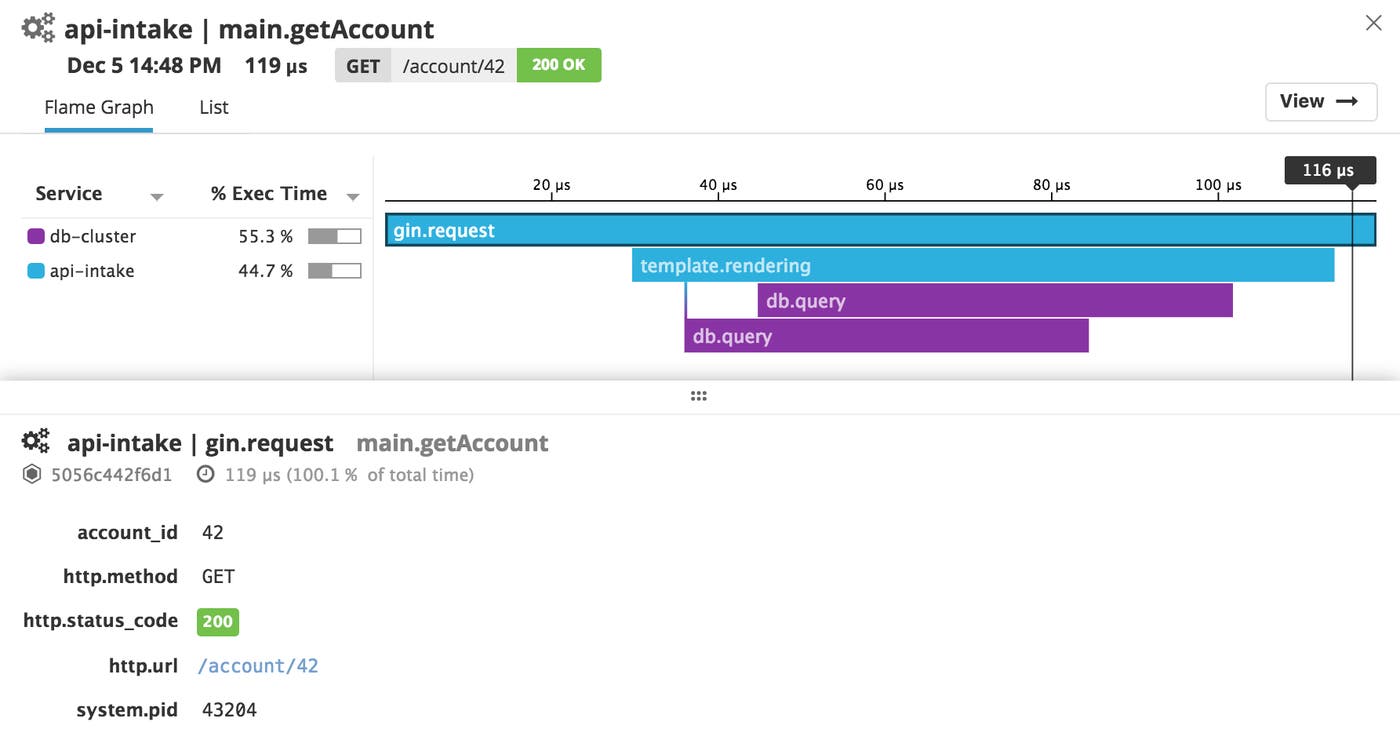
With those simple code changes, Datadog is now tracing all requests to the application, so that you can track application performance in Datadog APM. You can view metrics on app throughput, latency, and errors; graph latency distributions; and explore individual traces for request-level visibility.
Open roads ahead
We are thrilled to be joining CNCF and the OpenTracing project to further our contributions to the open source community.
If you’re not using Datadog yet, we invite you to start a free trial to explore the benefits of full-stack monitoring with distributed tracing and APM, all built on open, fully customizable instrumentation.

