Micah Kim

Will Roper
Today, many DevOps and security teams operate in a world of complex, hybrid, or multi-vendor environments. As more teams look to avoid lock-in by adopting open standards, OpenTelemetry (OTel) is quickly gaining adoption as the primary open source method for DevOps and security teams to instrument and aggregate their telemetry data. However, OTel alone may lack the advanced processing functions, native volume control rules, and hybrid environment support that large organizations need. This results in a fragmented setup, where teams struggle to reduce the noise sent to their downstream destinations and enforce standardized tagging.
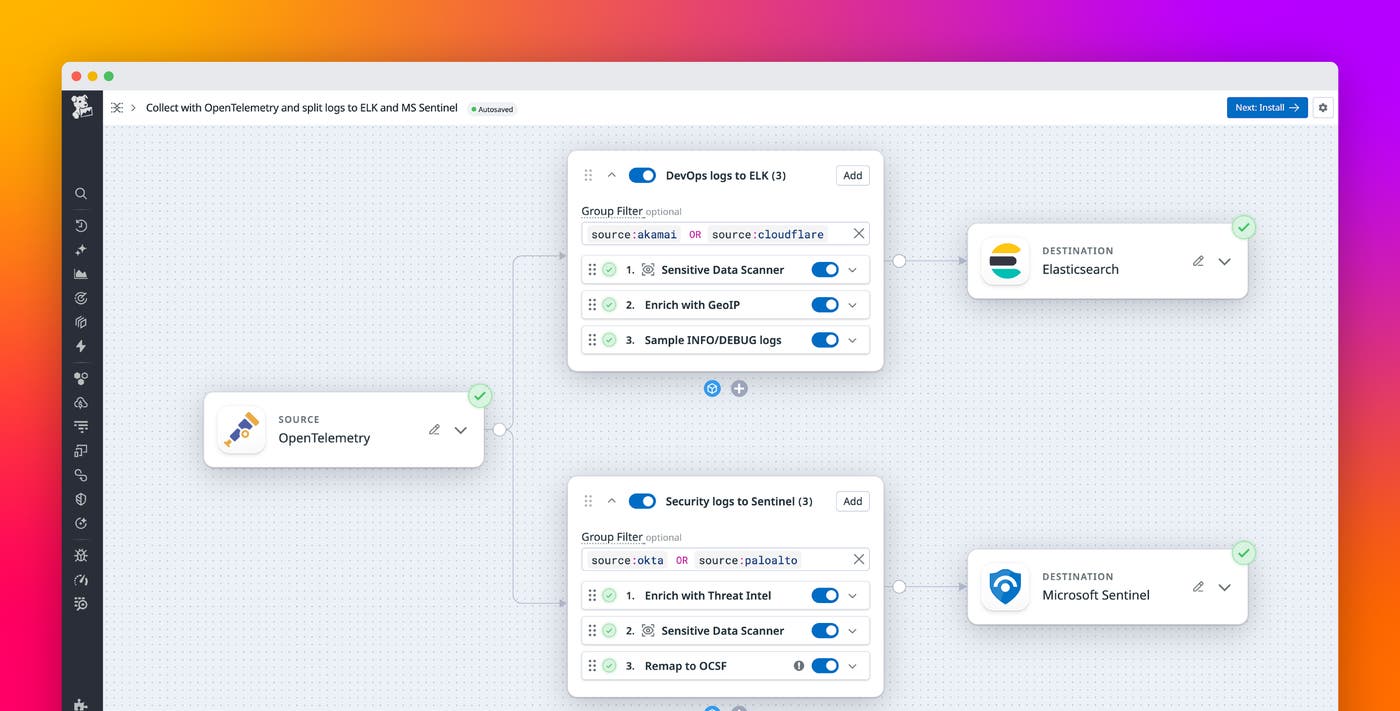
Datadog Observability Pipelines now supports the OTel Collector as a logs source, enabling your teams to instrument and collect telemetry data with OTel before processing and routing to your preferred destinations. Using OTel with Observability Pipelines helps teams maintain a vendor-neutral architecture and ensure their telemetry data is shaped for their desired taxonomy.
In this post, we’ll describe how to:
- Collect, process, and route data with a vendor-neutral architecture
- Unify OTel collection with pre-ingestion volume control and parsing rules
- Automatically handle the OTLP protobuf for simplified data manipulation
Collect, process, and route data with a vendor-neutral architecture
For DevOps and security teams, managing growing data volumes while staying within budget is a never-ending battle with various sources and different formats. As a result, many teams are turning to vendor-neutral tooling, schemas, or instrumentation. Observability Pipelines already supports open source frameworks by providing out-of-the-box normalization to the Open Cybersecurity Schema Framework (OCSF), a vendor-neutral data format for security teams that use vendors such as Splunk, Datadog Cloud SIEM, Amazon Security Lake, Google SecOps (Chronicle), Microsoft Sentinel, and CrowdStrike. Additionally, Datadog enables DevOps teams to take advantage of Vector Remap Language (VRL) using the Custom Processor for advanced data transformation and historical logs migrations.
Now, with OTel and OCSF support, Observability Pipelines gives you a single solution to collect and transform your logs in open standards for both DevOps and security use cases. This enables you to easily instrument telemetry collection with OTel, process and remap to OCSF with Observability Pipelines, and route data to your preferred tools under a fully vendor-agnostic architecture.
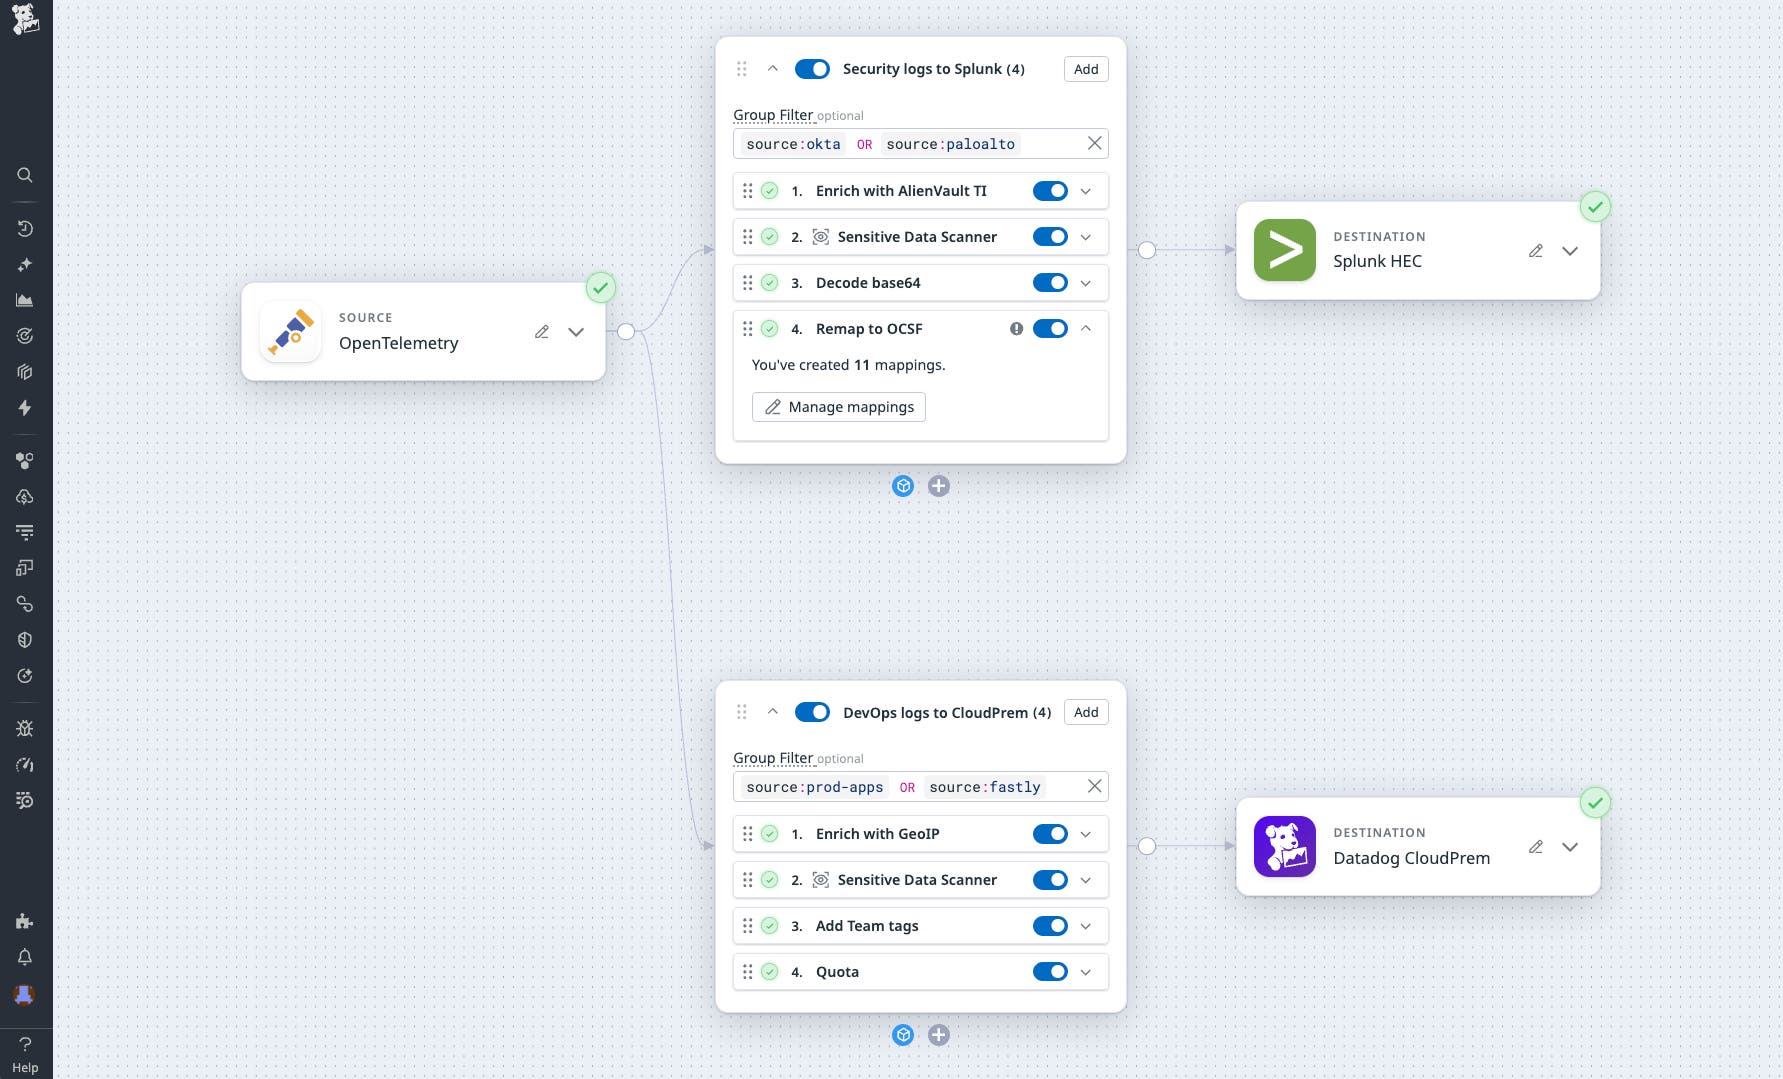
For example, let’s say you’re an architect at a large fintech organization responsible for standardizing your telemetry instrumentation with OTel for on-premises observability and security. Your company uses Datadog CloudPrem for DevOps troubleshooting along with Splunk for security. While OTel enables you to minimize vendor lock-in for telemetry collection, you still need the ability to preprocess and split logs for ingestion into your preferred tools. With Observability Pipelines, your team can easily ingest logs from OTel and route without compromising visibility, sacrificing compliance, or breaking any of your current security or DevOps workflows.
Unify OTel collection with pre-ingestion volume control and parsing rules
While collecting logs, metrics, and traces with OTel enables teams to use an open source schema and data export method, using OTel alone does not meet all of the modern DevOps requirements. For example, OpenTelemetry offers minimal data normalization capabilities, lacks sophisticated volume management, and struggles to operate efficiently across hybrid environments. This increases the barrier of adoption and forces teams to further rely on legacy or proprietary tooling to accomplish their goals.
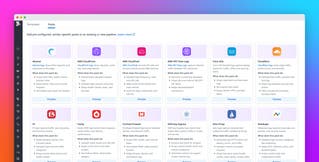
To help mitigate conflicts between OTel and third party instrumentation in hybrid environments, Observability Pipelines enables you to centralize data aggregation across OTel and non-OTel source integrations—including Splunk HEC, HTTP, Syslog, and more. This flexibility allows you to centralize data processing across hybrid and multi-cloud environments, regardless of whether data originates from VMs, Kubernetes, Docker, on-prem forwarders, or cloud services.
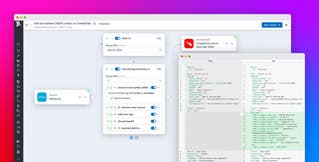
Once you’ve connected your sources to Observability Pipelines, you can take advantage of out-of-the-box processors—including 150+ preset parsing rules in the Grok Parser—to help you parse unstructured data on-stream before routing to your preferred tools. Additionally, you can enforce compliance requirements by redacting sensitive data on-premises before routing to your preferred destinations.
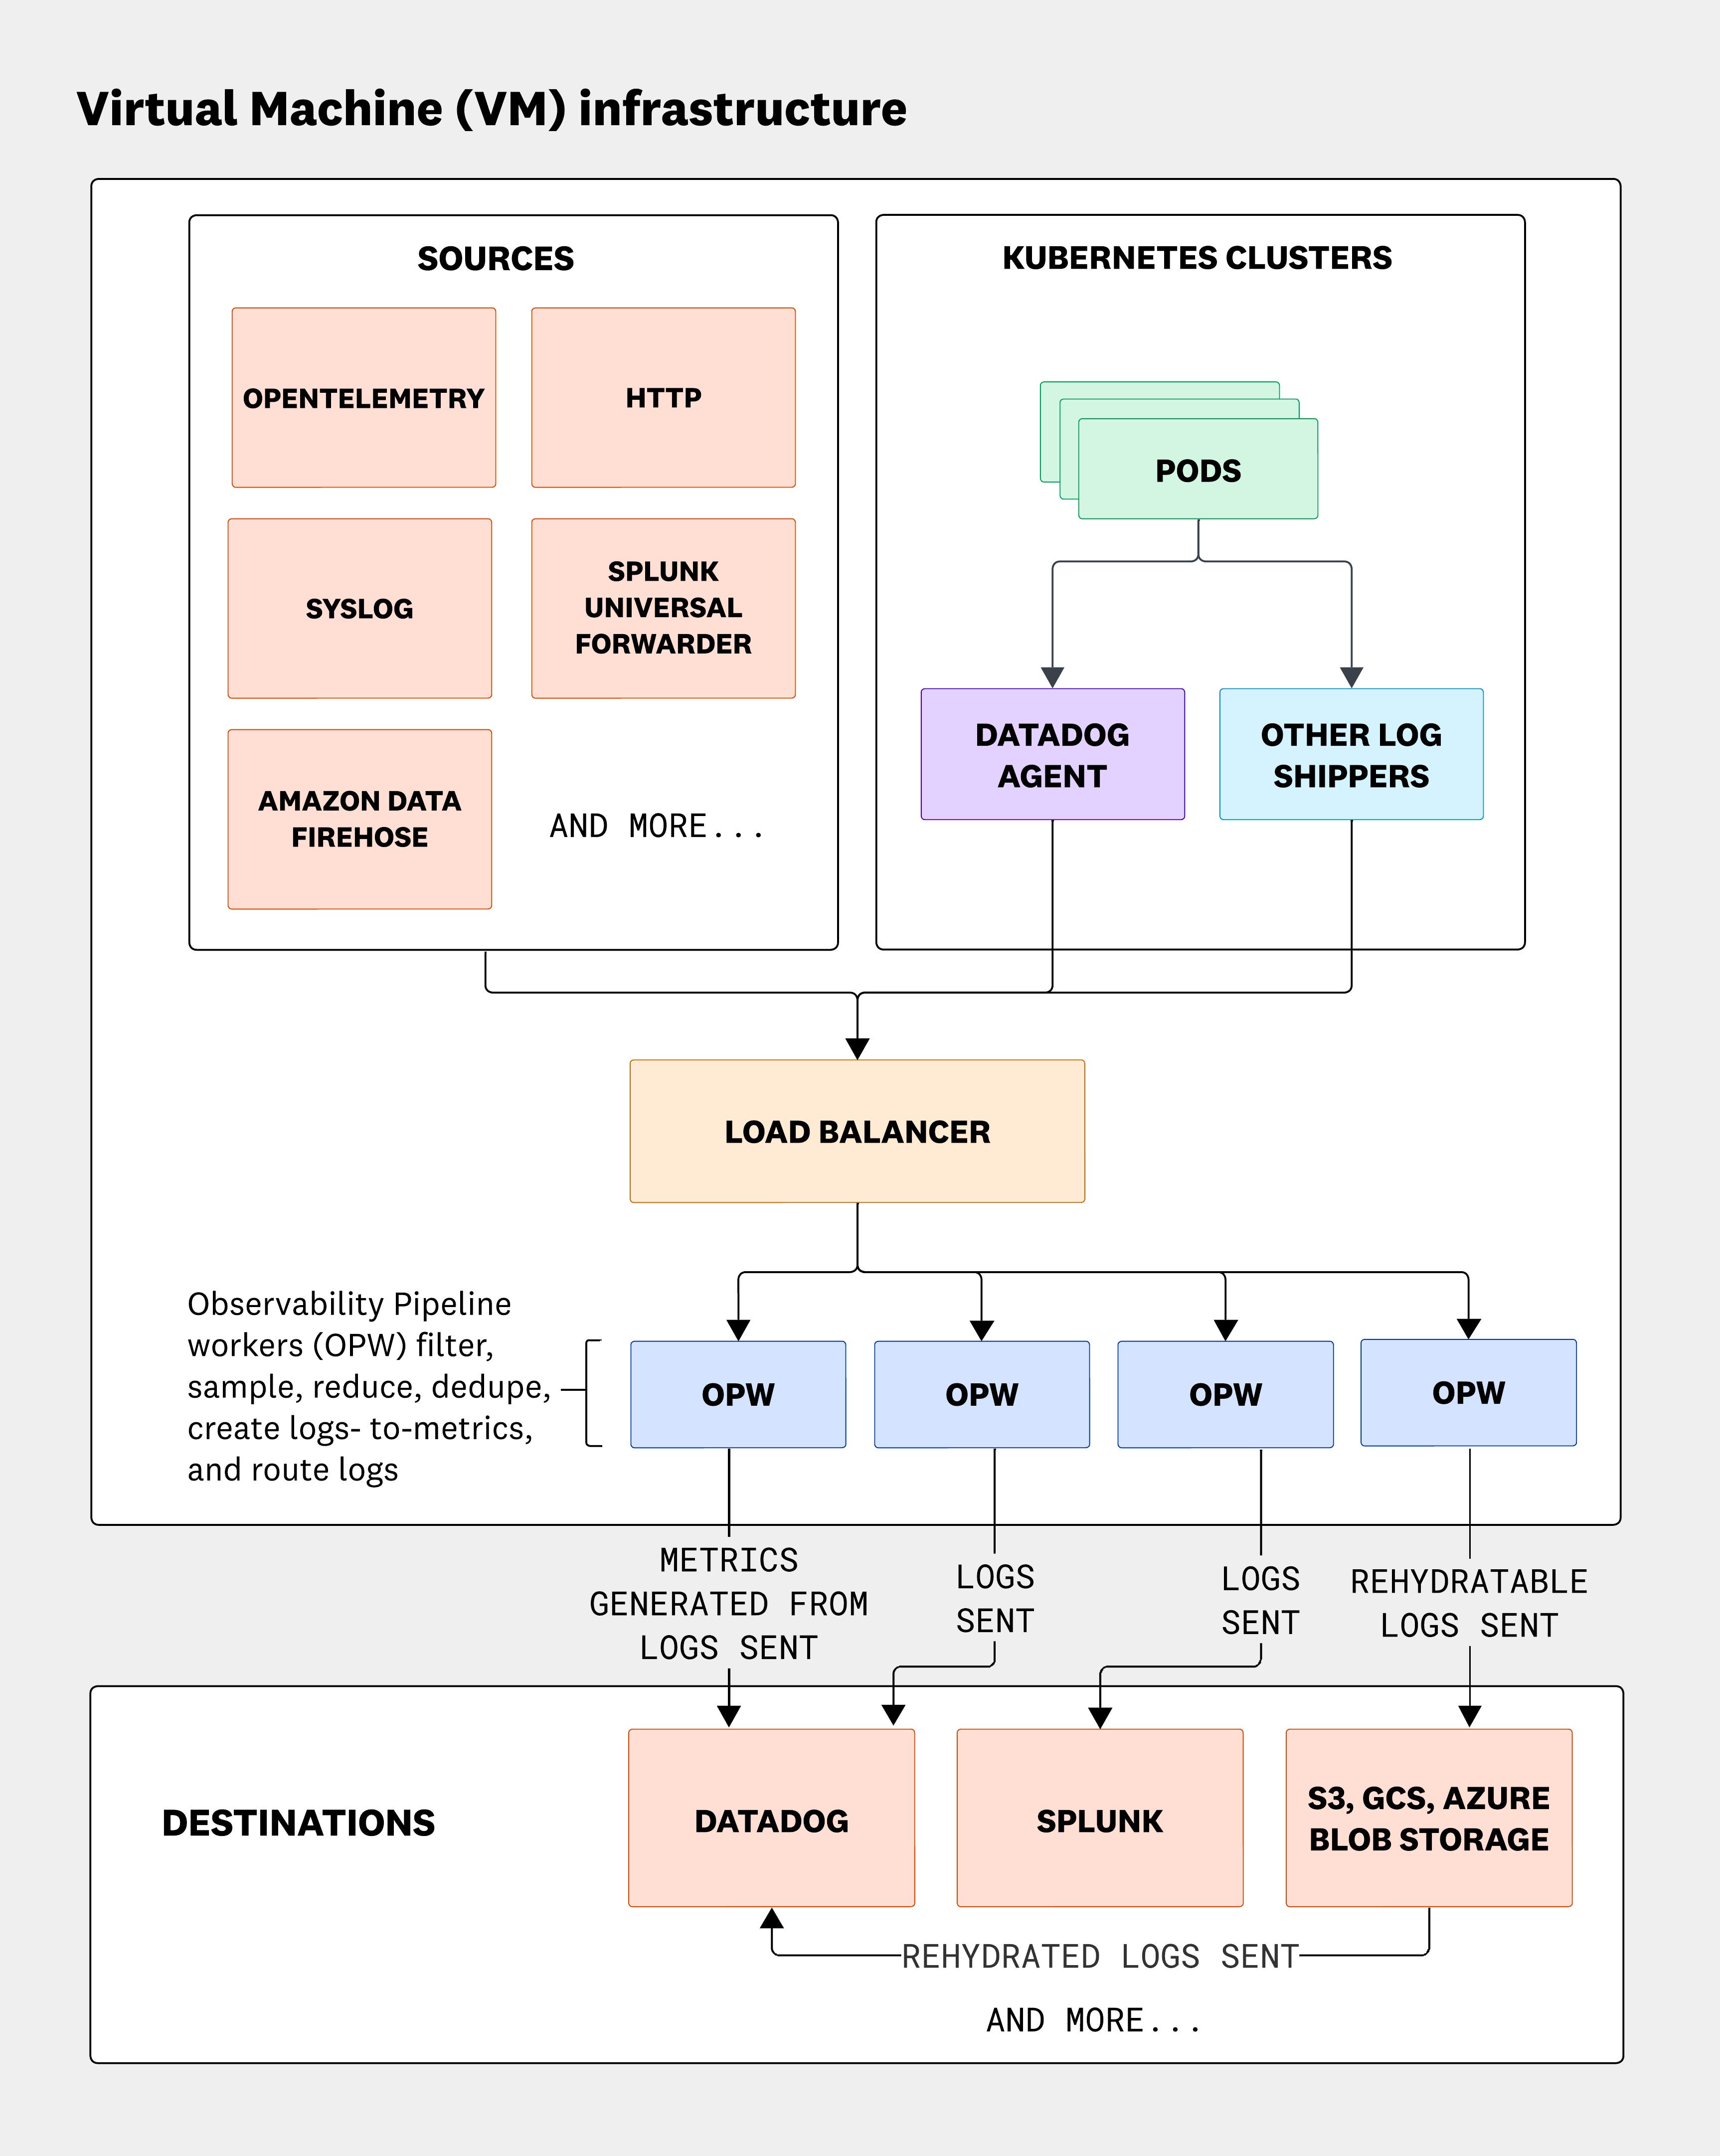
Once data is normalized, you can generate metrics from higher volume datasets like CDN logs from popular vendors such as Akamai, Fastly, and Cloudflare. This ensures any KPI is extracted, while the log can be dropped or routed directly to cloud storage archives such as Amazon S3, Azure Blob Storage, or Google Cloud Storage.
For example, let’s say you’re the Head of Platform Engineering at a large telecommunications organization. Your security team runs CrowdStrike in Kubernetes, while your DevOps team has a large on-prem footprint in Splunk. As your organization standardizes on OTel, you need a way to reliably collect telemetry data from both your on-prem and cloud-native environments. With Observability Pipelines, you can unify data collection across VMs, clusters, and legacy forwarders using both OTel and non-OTel sources. This ensures your teams can use one tool to process and route data to their destinations without disrupting existing workflows or sacrificing visibility.
Automatically handle the OTLP protobuf for simplified data manipulation
As teams look to standardize on OTel, manipulating logs requires data to be in a transformable format. The OTel Collector natively outputs log data through gRPC or HTTP in a Protocol Buffers (protobuf) format called OTLP (OpenTelemetry Protocol), resulting in a nested structure:
ResourceLogs: object containing a single Resource and 1+ ScopeLogs ScopeLogs: object containing a single Scope and 1+ LogRecords LogRecords: log eventBecause of the nested format, teams are forced to parse and flatten upon ingestion, creating extra effort and delay. However, Observability Pipelines automatically extracts each LogRecord as its own event and lifts contextual metadata such as resource.attributes and scope.name into the log as a field or metadata. This use case is similar to splitting nested arrays, where each unique LogRecord entry retains the resource and scope from its parent objects. To visualize this, here is an example of an Okta User Session Start log event that is commonly used by security teams to understand potential IAM threats.
The following log reflects an example of a web store app in the OTLP protobuf:
logs_data { resource_logs { resource { attributes { key: "service.name" value { string_value: "web-store" } } attributes { key: "host.name" value { string_value: "i-082a019146cfa596a" } } attributes { key: "env" value { string_value: "prod" } } attributes { key: "team" value { string_value: "shopist-web" } } attributes { key: "k8s.pod.name" value { string_value: "rails-storefront-main-7b9cb88476-gvsdr" } } attributes { key: "k8s.container.name" value { string_value: "rails-storefront" } } }
scope_logs { scope { name: "datadog.op.pipeline" }
log_records { time_unix_nano: 1763599982812000000 severity_number: SEVERITY_NUMBER_ERROR severity_text: "ERROR"
body { string_value: "/checkout.json" }
attributes { key: "dd.id" value { string_value: "AwAAAZqeLaTc..." } } attributes { key: "log.level" value { string_value: "ERROR" } } attributes { key: "logger.name" value { string_value: "Rails" } } attributes { key: "controller" value { string_value: "ShoppingCartController" } } attributes { key: "action" value { string_value: "checkout" } }
attributes { key: "http.method" value { string_value: "POST" } } attributes { key: "http.status_code" value { string_value: "503" } } attributes { key: "url.path" value { string_value: "/checkout.json" } }
attributes { key: "duration.ms" value { double_value: 6041.41 } }
attributes { key: "error.stack" value { array_value { values { string_value: "PaymentServiceUnavailableError" } values { string_value: "Payment service reported 503 Unavailable." } } } }
attributes { key: "params" value { string_value: "{\"checkout\":{...},\"format\":\"json\"}" } } } } }}The following log reflects an example of a web store app in parsed JSON:
{ "id": "AwAAAZqeLaTcduNdewAAABhBWnFlTGFyMkFBQXRSRm9TUHdzVFFRUGMAAAAkZjE5YTllMmQtYTRkZC00NTZlLWE1NDMtNjA2NjkyYzE1NWZhAAAAAQ", "content": { "timestamp": "2025-11-19T22:13:02.812Z", "tags": [ "env:prod", "kube_replica_set:rails-storefront-main-7b9cb88476", "swarm_service:web-store", "kube_container_name:rails-storefront", "image_id:172597598159.dkr.ecr.us-east-1.amazonaws.com/rails-storefront@sha256:38d30266f98f38f8cbdb872ebbebbe51aca7eb705f2574c37bb7f6281d398dd1", "chart_name:rails-storefront", "container_name:rails-storefront", "short_image:rails-storefront", "deployment_group:main", "tags.datadoghq.com/service:web-store", "filename:117.log", "kube_qos:burstable", "app:rails-storefront", "pod_name:rails-storefront-main-7b9cb88476-gvsdr", "image_tag:3875212b", "kube_namespace:default", "kube_deployment:rails-storefront-main", "swarm_namespace:web", "service:web-store", "team:shopist-web", ], "host": "i-082a019146cfa596a", "service": "web-store", "message": "/checkout.json", "attributes": { "controller": "ShoppingCartController", "level": "ERROR", "logger": { "name": "Rails" }, "format": "json", "source_type": "datadog_agent", "source": " nginx", "params": { "shopping_cart": { "checkout": { "cvc": 736, "card_number": "fa55e253024cdcff", "exp": "10/21" } }, "format": "json", "checkout": { "cvc": 736, "card_number": "fa55e253024cdcff", "exp": "10/21" } }, "error": { "stack": [ "PaymentServiceUnavailableError", "Payment service reported 503 Unavailable." ] }, "ddsource": "ruby", "duration": 6041.41, "view": 0, "allocations": 1740522, "action": "checkout", "http": { "url_details": { "path": "/checkout.json" }, "status_code": "503", "method": "POST", "status_category": "ERROR" }, "exception_object": "Payment service reported 503 Unavailable.", "timestamp": "2025-11-19T22:13:02.812408Z", "status": "ERROR" } }}Aggregate from OTel and process with Observability Pipelines
Datadog Observability Pipelines can aggregate telemetry data from the OTel Collector and supports your taxonomy requirements with out-of-the-box volume control and no vendor lock-in. Observability Pipelines also enables Grok parsing with over 150 preconfigured parsing rules and custom parsing capabilities, GeoIP enrichment, JSON parsing, and more.
Observability Pipelines can be used without any subscription to Datadog Log Management or Datadog Cloud SIEM. For more information, visit our documentation. If you’re new to Datadog, you can sign up for a 14-day free trial.
