Cat Yao

Anusha Podila
As modern infrastructure becomes increasingly distributed across on-premises data centers, multi-cloud environments, ISPs, and remote offices, understanding how traffic flows across your network is critical to delivering reliable performance and great user experiences. But pinpointing the source of network slowdowns remains one of the most persistent challenges for operations, network, and IT teams. Traditional troubleshooting often requires manually running traceroutes from individual hosts, piecing together fragmented data from a variety of tools, and guessing where latency or packet loss originates.
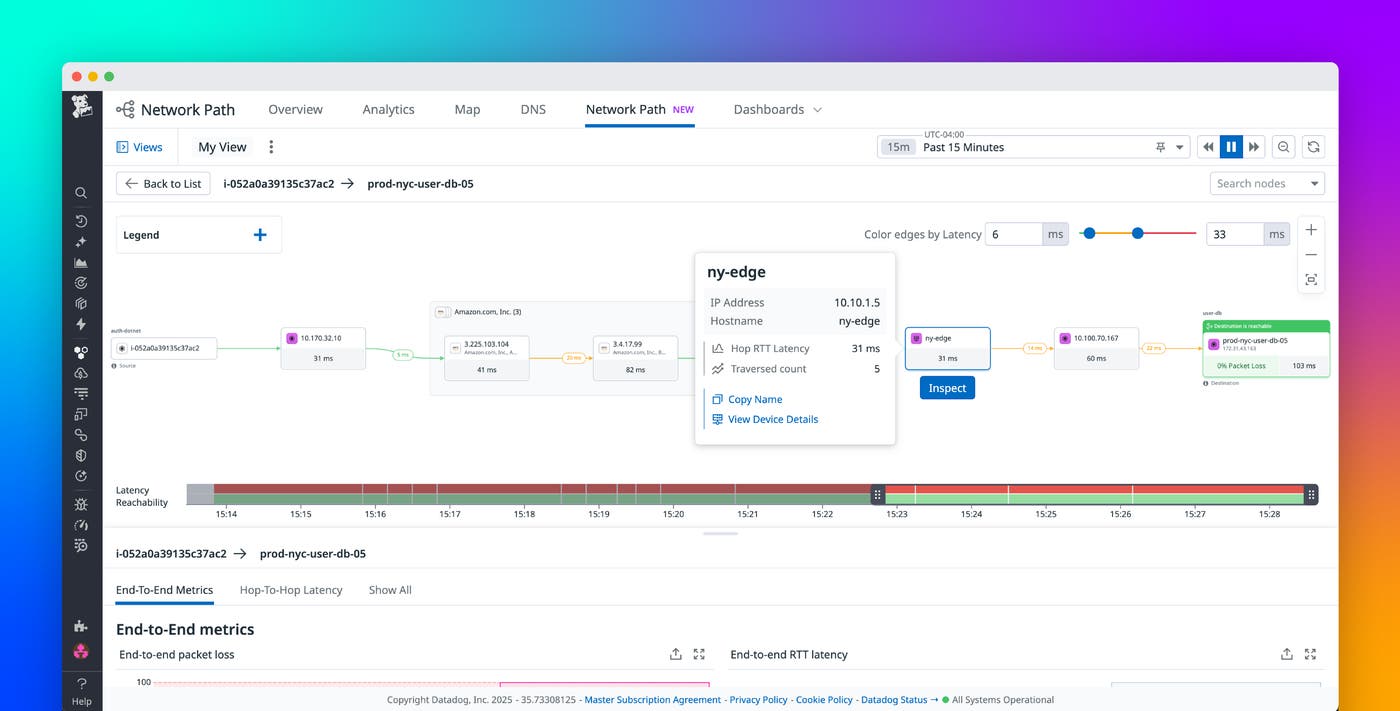
Datadog Network Path, now generally available as part of Datadog Network Monitoring, addresses these issues by helping you visualize the journey of packets, hop by hop, from a source to a destination. Network Path works by running traceroutes (TCP, UDP, or ICMP) from the Datadog Agent at user-configured intervals and consolidating the results into path views that provide quick insight. Network Path shows latency and failures at each step across all layers of your network, providing clear visibility of problems so that you can resolve them faster.
In this post, we’ll show you how Network Path can help you:
Troubleshoot on‑premises networks
When internal service-to-service communication slows down in on-premises environments, traditional tools often fall short of identifying the root cause. Network engineers who investigate such slowdowns need more than surface-level anomaly detection. They also need actionable insights across the entire path.
Network Path provides a visual representation of traceroutes across your internal networks, helping you pinpoint problematic hops such as overloaded switches and misconfigured routers that can cause latency issues. By integrating with Datadog Network Device Monitoring (NDM), Network Path offers detailed device-level metadata and metrics such as CPU utilization and device uptime that enable more comprehensive troubleshooting and performance monitoring.
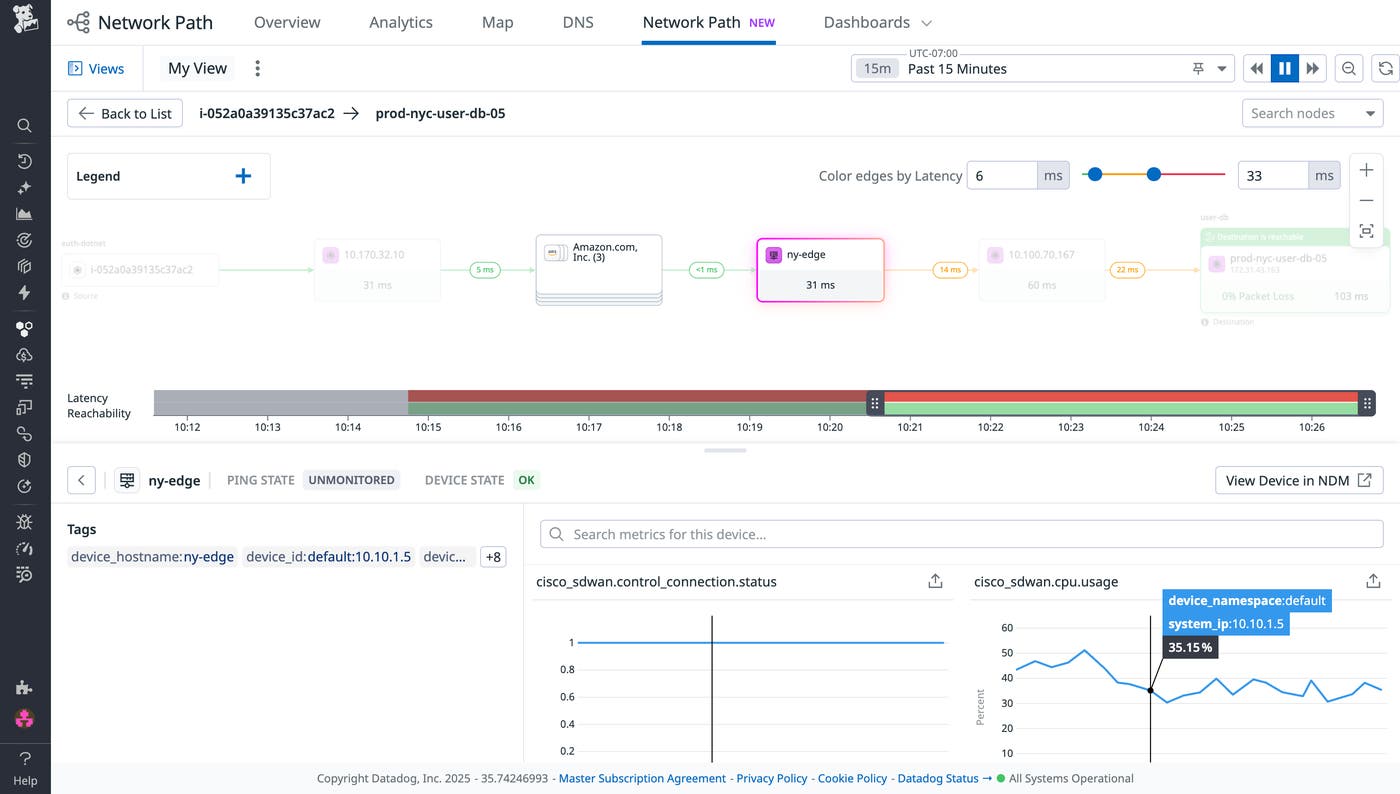
For example, the following screenshot includes a physical networking device that is named ny-edge. Network Path shows you the details of the ny-edge hop, along with data about connection status and CPU usage from NDM.

You can also pair Network Path with NetFlow Monitoring, which surfaces traffic patterns and volume. The combined data allows your engineers to correlate symptoms with root causes. As a result, you can reduce your mean time to resolution (MTTR) and improve your on-premises network reliability.
Uncover network issues that lead to increased application anomalies
SREs who manage cloud or hybrid environments need to distinguish between application-level and network-level problems to identify the root cause of application slowdowns. When applications experience intermittent slowdowns or request timeouts, application performance monitoring tools can surface symptoms. However, these tools often lack the granularity that is necessary to trace the issue back to the network.
Network Path provides a detailed, hop-by-hop view of service communication paths, highlighting where latency spikes and packet loss occur. By visualizing every hop between distributed services, your SREs can quickly identify issues such as misconfigured route tables, congested links, and degraded cloud infrastructure.
When integrated with Datadog Cloud Network Monitoring (CNM) and Datadog Application Performance Monitoring (APM), Network Path connects infrastructure behavior with application performance. Your teams can then correlate, diagnose, and resolve issues with speed and precision.
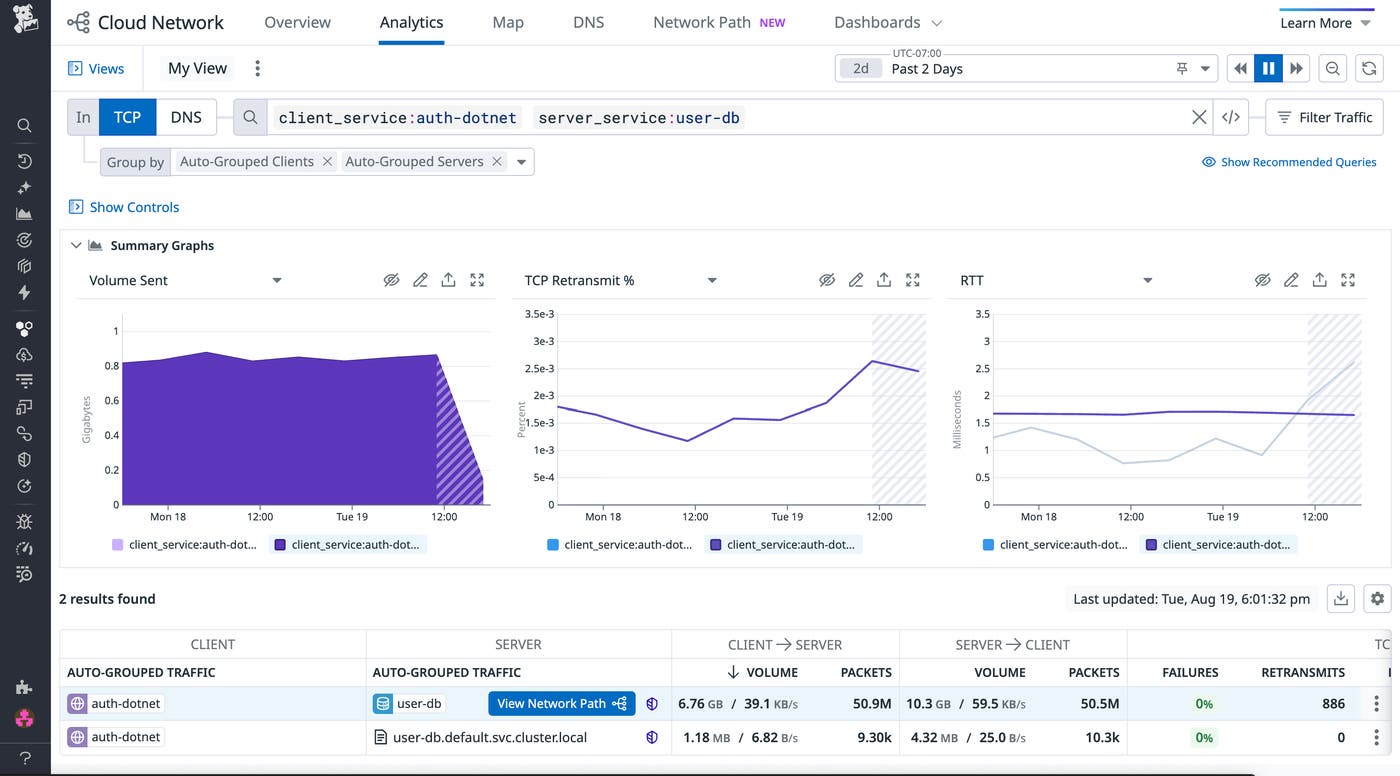
The following screenshot shows how you can pivot to Network Path from CNM by using the Network Analytics page. Let’s say that you’re viewing your TCP metrics between client service auth-dotnet and server service user-db. You can quickly shift to examining the hops between those services by choosing View Network Path from the results in the table.

Improve end-user experiences across office locations
When employees report sluggish access to cloud-hosted applications, corporate IT teams often need to untangle a complex web of potential culprits: the local network, ISP performance, and cloud infrastructure, among others. These teams that are responsible for network performance and digital experience across offices and remote users must identify the root cause of the slowdowns that their end users are experiencing. To accomplish this goal, they need more than siloed metrics.
You can use Network Path alongside End User Device Monitoring (EUDM) to gain end-to-end visibility from each user’s device to the application destination. When the Datadog Agent is installed on an end user’s device, Network Path highlights latency issues and packet loss across segment access points, WAN connections, ISP routes, and cloud endpoints.
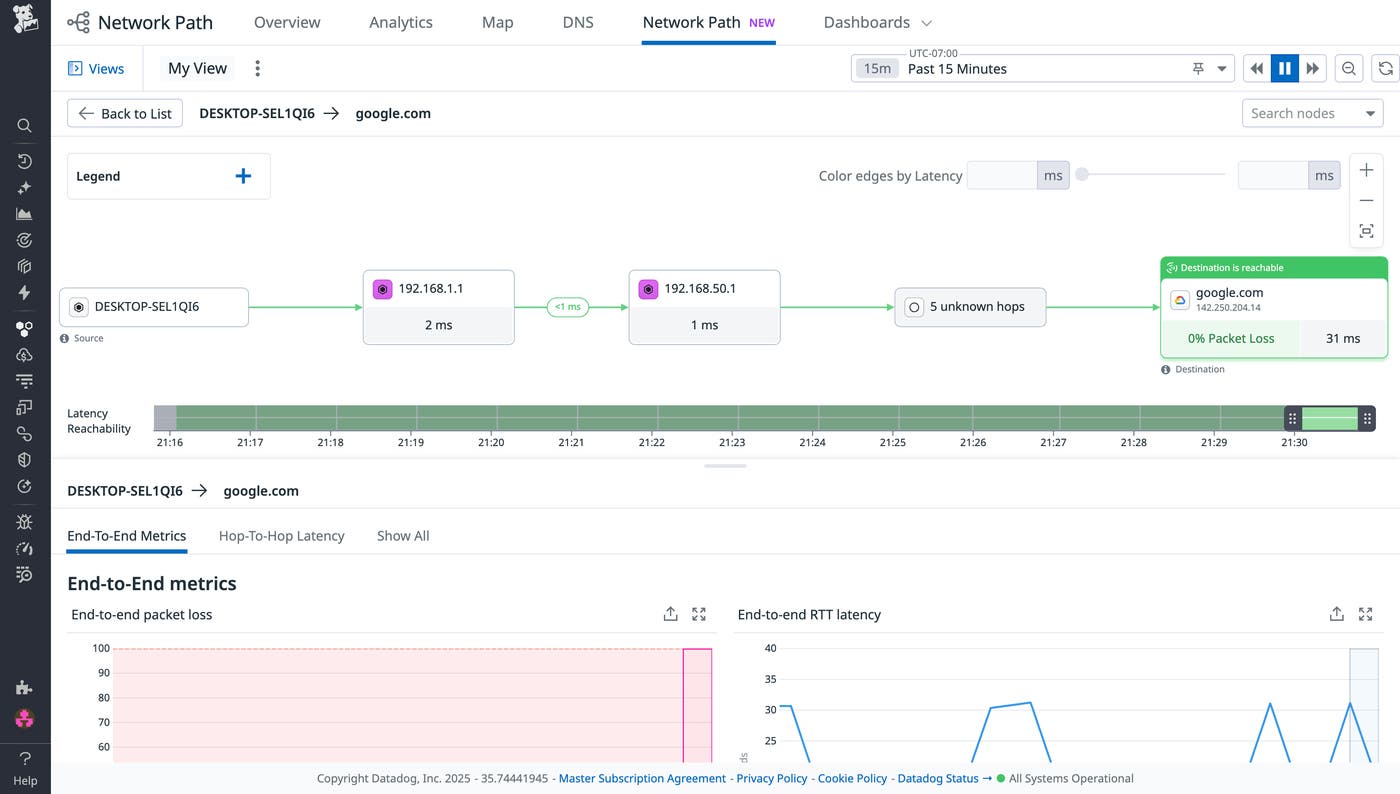
For example, the following screenshot shows the path of traffic from a desktop to domain google.com. Network Path presents a visualization of the intermediate hops between the desktop and the destination, including information about packet loss and latency that occur along the way.

These insights are enriched with Datadog Synthetic Monitoring synthetic tests and Datadog Real User Monitoring (RUM) data, allowing your IT teams to correlate network degradation with real-world user experience metrics like page load times and satisfaction scores. This unified perspective enables faster root cause identification, targeted remediation, and data-backed validation of performance improvements.
Gain full-stack network visibility today
Network Path extends unified observability to every part of your network, from physical infrastructure and the cloud to remote endpoints and end-user devices. It combines with NDM for device-level context, NetFlow Monitoring for traffic-level insight, EUDM and RUM for user-side visibility, and APM and CNM for application and cloud network telemetry data, giving you a correlated view of network performance across all layers. By visualizing the flow of traffic across hybrid and multi-cloud environments, your teams can quickly identify where and why slowdowns occur and then take action to improve performance and user experiences.
To learn more, check out our Network Path documentation. If you’re not yet a Datadog customer, you can sign up for a 14-day free trial.

