Olivier Pomel
Few tools in the open-source Devops toolchain have inspired such a tempestuous relationship with their users as Nagios. We love and use it because it works. It always does. But boy, does it take a lot of effort to see past the torrents of notifications and byzantine UIs.

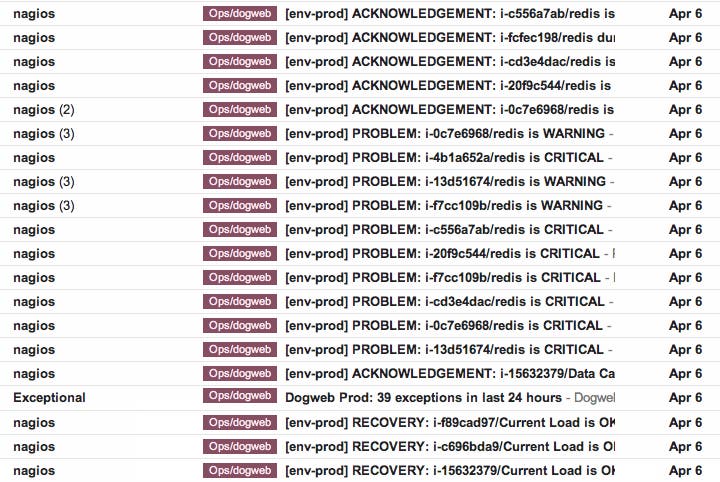
This is a picture of our inboxes when things start failing; the Nagios web UI is just as bad, and that's exactly the kind of painful mess we built Datadog to fix! We spent the past year using and tuning our Nagios integration, and we think it will make your life quite a bit easier. Here's how:
Step 1: Cut through the Nagios alert noise

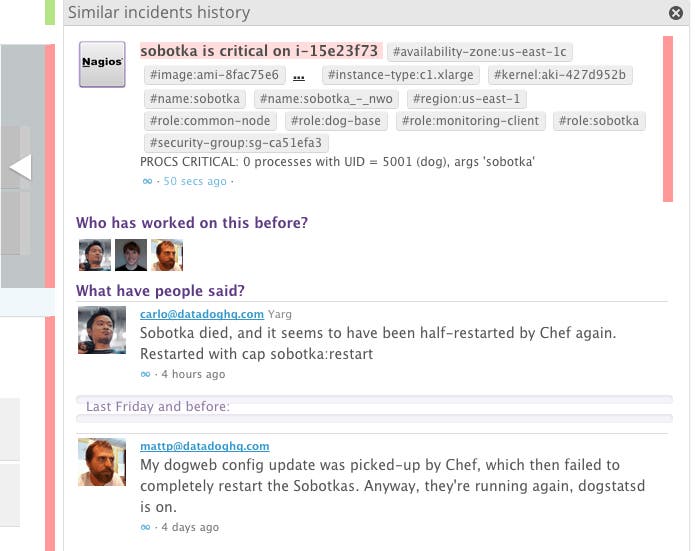
Things failed and you're getting alerts. But instead of a barrage of obscure Nagios notifications, Datadog:
aggregates Nagios alerts, here 60 of them
lets you see what successive states the check has gone through
gives you additional info with tags, such as your AWS availability zone
shows the alert in-context with other events, such as AWS downtime or Chef runs
Step 2: Fix it, with the help of your team
Since you saw the alert first, better fix it!
Besides the additional context I just mentioned, Datadog recalls what was done the last time a similar alert took place, and brings it right back to you, in-context. It also tells you who worked on it in the past, so you know who to ask. This is particularly useful if you have a large ops team, or want to give developers operational responsibilities.

Once you've fixed the issue, be sure to share what you did. This way Datadog will remember it the next time you or someone else gets an alert.
Step 3: Post-mortem. Understand what really happened
Ok, so you've stabilized the problem. Phones stopped ringing and everyone's blood pressure went down a notch. In many cases you'll want to look back at the alert, understand what combination of factors led to it, and identify what code or systems you should durably fix.
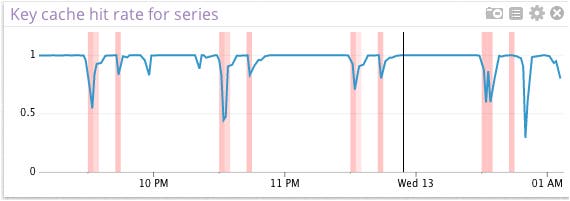
To that end, Datadog lets you easily correlate events and metrics across tools and services: all events can be searched and overlaid over metrics graphs.

On this picture, we're showing Nagios alerts related to our faulty process as red bars—darker means “more alerts”—overlaid over a cache hit rate metric sourced from our Cassandra integration. Looks like big waves of cache misses correlate pretty strongly with alerts here.
Step 4: Trend analysis. See the big picture, improve what matters.
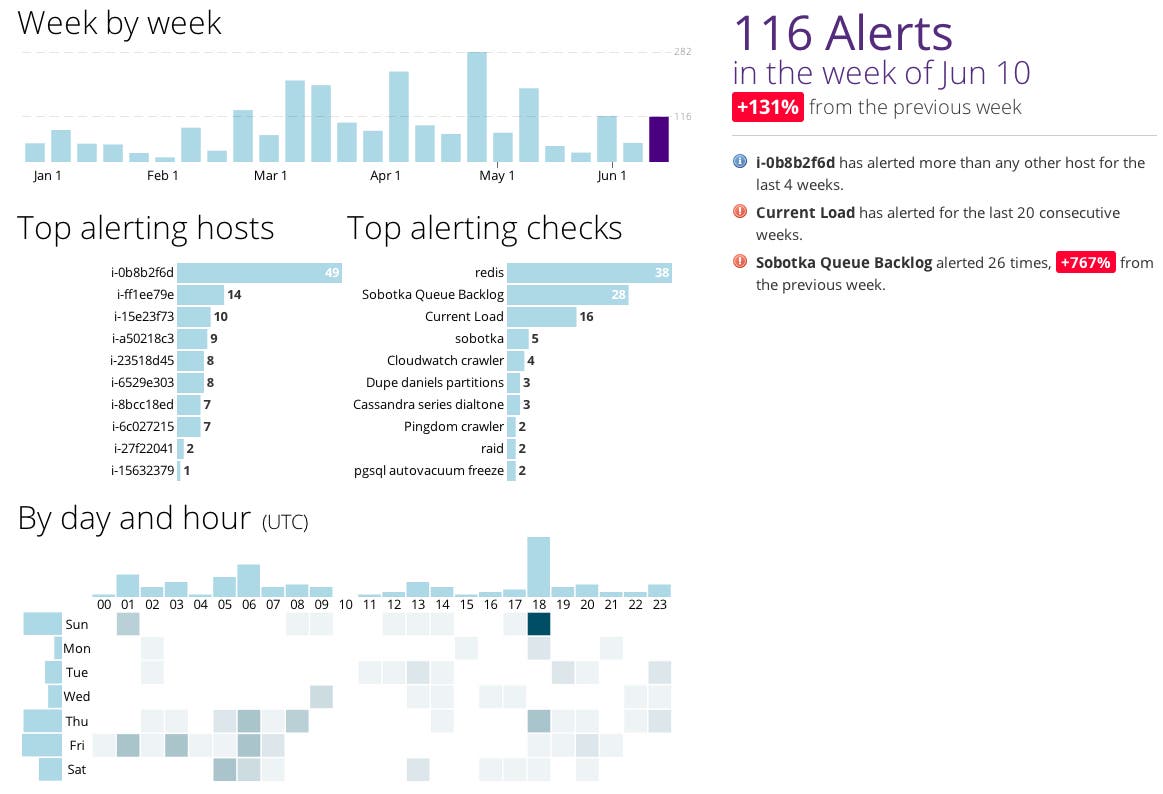
Last but not least, you need to step back on a regular basis, assess your overall situation, and verify that you are—indeed—improving as time goes by, not just knocking down one alert after another.
Datadog sends you weekly reports identifying notable alerting trends. And because there's more than one way to slice your data, you can explore it all interactively!
<a target="_blank" href="http://player.vimeo.com/video/44332451?title=0&byline=0&portrait=0&color=ffffff&autoplay=1">

</a>
Wait, there's more.
Nagios is only one of the many tools and services integrated by Datadog, and although a number of them have interesting interactions with Nagios, such as Chef, Puppet, and Pagerduty, I'll leave them for another day.
If you found this interesting, use Nagios, and want to do better than your inbox for alert management, do create your Datadog account now. It only takes a few minutes.

