Paul Gottschling
As we explained in Part 1, it’s important to monitor task status and resource use at the level of ECS constructs like clusters and services, while also paying attention to what’s taking place within each host or container. In this post, we’ll show you how Datadog can help you:
- Automatically collect metrics from every layer of your ECS deployment
- Track data from your ECS cluster, plus its hosts and running services in dashboards
- Visualize your ECS deployment with the container map
- Detect services running on your ECS cluster automatically
- Get real-time insights into the health and performance of your ECS services and processes
- Collect and analyze your ECS logs to show trends beyond those visible to CloudWatch
- Create alerts to track potential issues with your ECS cluster
From ECS to Datadog
Datadog gathers information about your ECS clusters from two sources. First, Datadog queries CloudWatch for metrics and tags from ECS and any other AWS services you’d like to monitor. Second, you can deploy the Datadog Agent to your ECS clusters to gather metrics, request traces, and logs from Docker and other software running within ECS, as well as host-level resource metrics that are not available from CloudWatch (such as memory).
In this section, we’ll show you how to set up Datadog to collect ECS data from both of these sources—first, by configuring the AWS integration, then by installing the Datadog Agent on your clusters. If you’re new to Datadog, you can follow along with this post by signing up for a free trial.
Set up Datadog’s AWS integration
Datadog’s AWS integration automatically collects ECS metrics from CloudWatch—and it expands on those metrics by querying the ECS API for additional information, including ECS events and tags, and the status of container instances, tasks, and services. To set up Datadog’s AWS integration, you’ll need to delegate an AWS Identity and Access Management (IAM) role that gives Datadog read-only access to ECS (and any other services you’d like to monitor), as specified in our documentation.
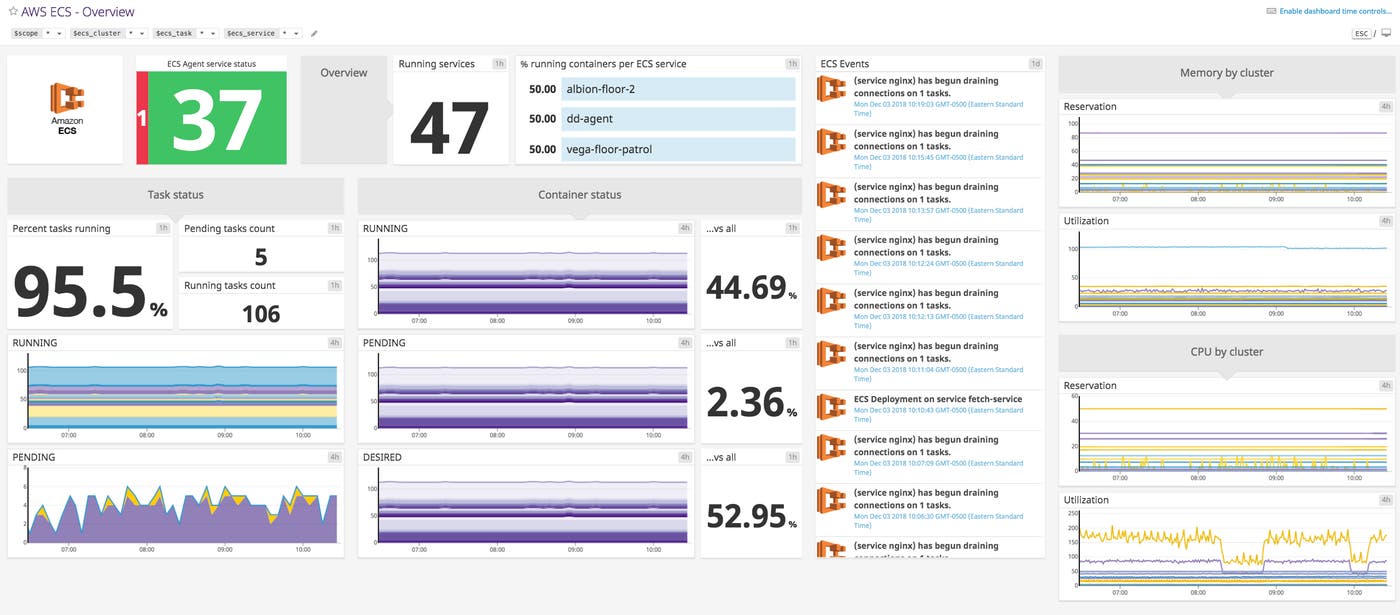
In the AWS integration tile, add the name of this IAM role, and make sure to check the “ECS” box under “Limit metric collection”. You should start to see metrics and events populating the out-of-the-box dashboard for ECS, making it possible to get full visibility into the health and performance of your cluster.
Deploying the Datadog Agent on ECS
The Datadog Agent is open source software that collects metrics, request traces, logs, and process data from your ECS environment, and sends this information to Datadog. The Agent runs inside your ECS cluster, gathering resource metrics as well as metrics from containerized web servers, message brokers, and other services.
You can deploy the containerized Datadog Agent to your ECS cluster in the same way as any other container: within the containerDefinitions object of an ECS task. The definition will vary based on whether the task is running in the Fargate or the EC2 launch type, as explained below.
Deploying the Agent in the Fargate launch type
If you’re using the Fargate launch type, add the following object to the containerDefinitions array within a new or existing task definition:
{ "name": "datadog-agent", "image": "datadog/agent:latest", "environment": [ { "name": "DD_API_KEY", "value": "<YOUR_DATADOG_API_KEY>" }, { "name": "ECS_FARGATE", "value": "true" } ]}You’ll need to include two objects within the environment array: one that specifies your Datadog API key (available in your account) and another that sets ECS_FARGATE to true.
After you’ve declared the Datadog Agent container within a task definition, name the task within a service to run it automatically. To enable Datadog’s Fargate integration, navigate to the Datadog integrations view and click “Install Integration” in the Fargate tile. Once the task that includes the Datadog Agent reaches a RUNNING status, the Agent has begun to send metrics to Datadog.
The Fargate integration complements the ECS integration, gathering system metrics from each container in your Fargate cluster. This makes it easier to monitor Docker containers within Fargate, taking away the need to write your own scripts to query the ECS task metadata endpoint and process the response to track container-level resource metrics.
Deploying the Agent in the EC2 launch type
Deploying the Agent to your EC2 container instances is similar: add a task definition that names the container image of the Agent. You’ll find the JSON for the Agent container definition in our documentation.
You’ll notice that this container definition looks slightly different from what we used with Fargate, mainly in that it specifies volumes and mount points. Once you’ve defined a task that includes the Datadog Agent, create a service that runs it. We recommend running the Datadog Agent as an ECS daemon task to make sure the Agent deploys to, and can collect system metrics from, each EC2 instance in your cluster.
Get comprehensive visibility with Datadog dashboards
Once you’ve enabled Datadog’s AWS integration, you’ll have access to an out-of-the-box dashboard (see above) that provides detailed information about your ECS clusters, including the status of your deployments, cluster-level resource utilization, and a live feed of ECS events. You can also clone your ECS dashboard and add graphs of Docker metrics to see how the health and performance of your containers correlates with that of the tasks running them. And if you want to drill into issues with your ECS container instances, or a specific container, you can turn to the out-of-the-box dashboards for EC2 and Docker.
Use Datadog to gather and visualize real-time data from your ECS clusters in minutes.
Datadog pulls tags from Docker and Amazon CloudWatch automatically, letting you group and filter metrics by ecs_cluster, region, availability_zone, servicename, task_family, and docker_image. This makes it possible to, for instance, monitor ECS CPU utilization for a single cluster, then drill in to see how each Docker container contributes—a view that’s not available with ECS CloudWatch metrics alone.
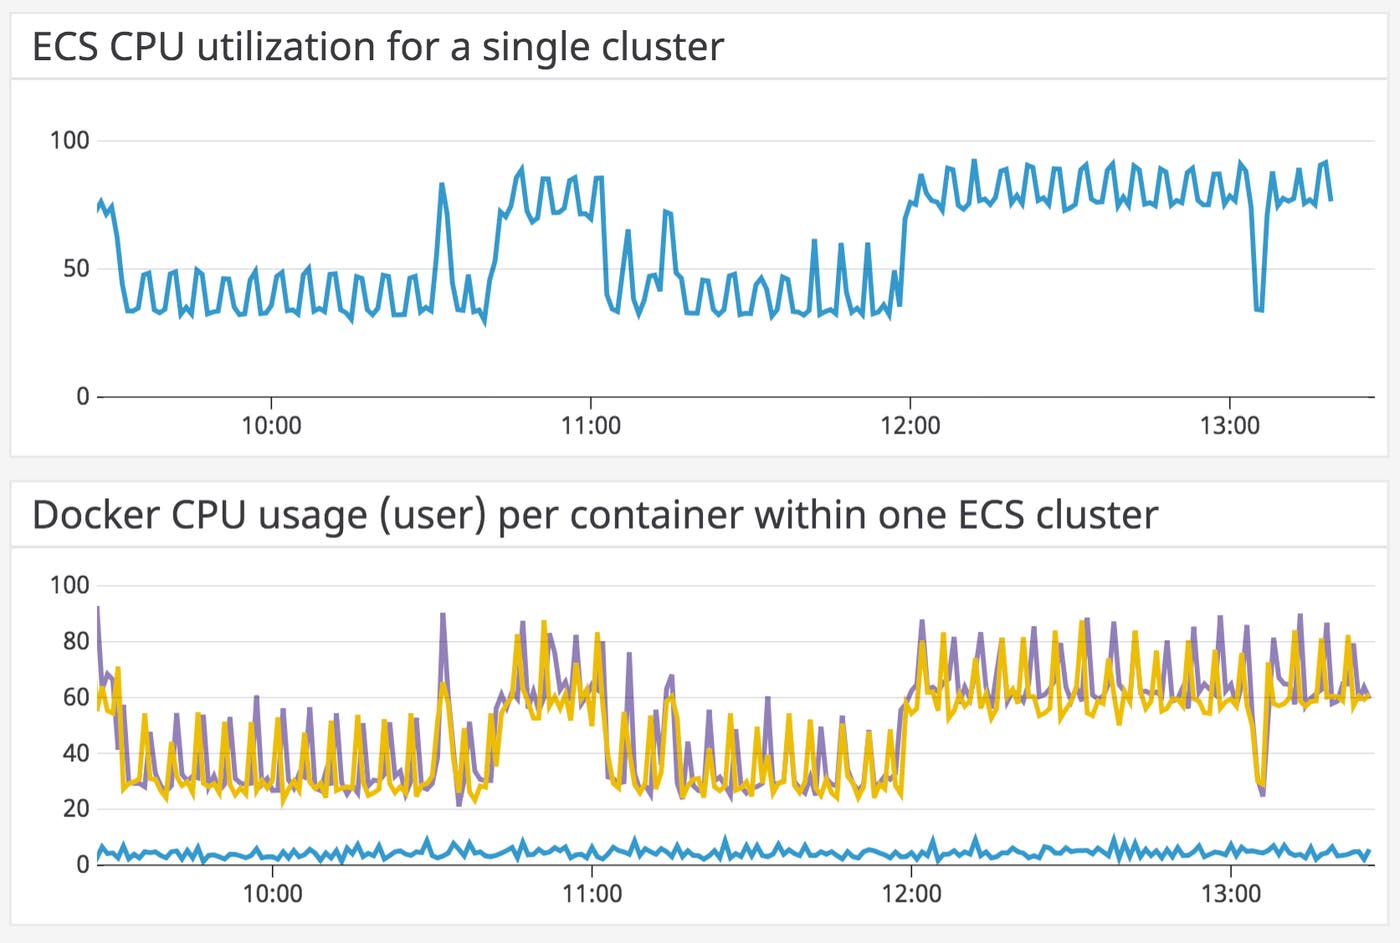
In addition to Docker, you can use Datadog dashboards to track all the AWS technologies running alongside ECS.
Visualize your ECS deployment with the host map and container map
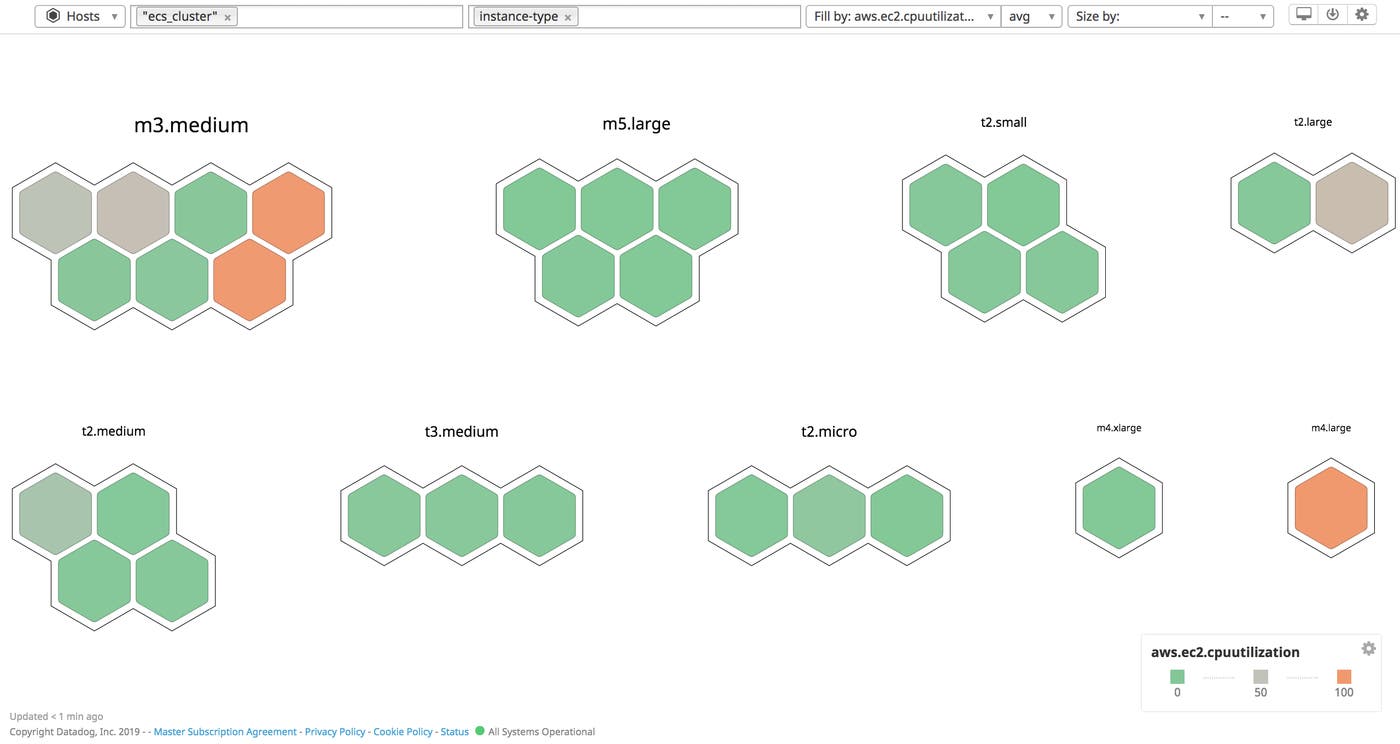
To get an overview of your ECS infrastructure as a collection of EC2 hosts or Docker containers, you can use Datadog’s two map views, the container map and host map. Here you’ll see how many members are in your cluster, how they are organized, and how much variation they show for any metric. You can then get a quick read into the health and performance of your ECS cluster.
The Datadog host map lets you filter tags, making it possible to show all the EC2 instances running within ECS clusters (as you can see below). You can then group by EC2 instance type, showing whether any part of your cluster is over- or underprovisioned for a given resource.
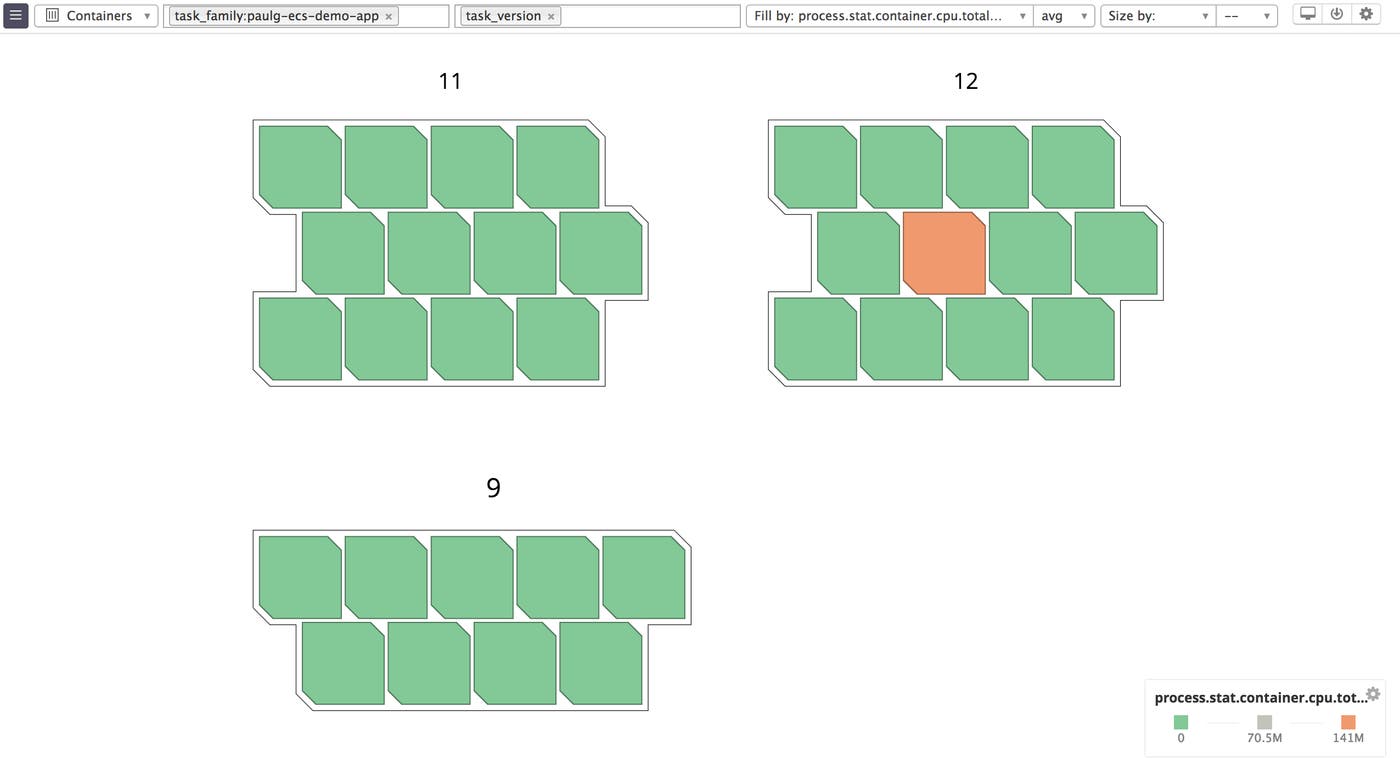
The container map has all the functionality of the host map, but displays containers rather than hosts. Since Datadog pulls tags from CloudWatch, you can use the same categories that identify parts of your ECS cluster to organize the container map. For example, since ECS tasks are tagged by version, we’ve used the task_family and task_version tags to see how many containers in a single task family (i.e., containers running any version of a specific task definition) are still outdated, and whether that has impacted CPU utilization in our cluster.
Keep up with ECS task placement using Autodiscovery
What we’ve called the Docker monitoring problem is just as true for ECS: containers spin up and shut down dynamically as ECS schedules tasks, making it a challenge to locate your containers, much less monitor them. With Autodiscovery, the Datadog Agent can detect every container that enters or leaves your cluster, and configure monitoring for those containers—and the services they run.
The Datadog Agent includes Autodiscovery configuration details for more than a dozen technologies out of the box (including Apache, MongoDB, and Redis). You can configure Autodiscovery to add your own check templates for other services using three Docker labels.
| Label | What it specifies |
|---|---|
com.datadoghq.ad.check_names | The integrations to configure, corresponding with the names of individual checks (as given in the Agent’s configuration directory). |
com.datadoghq.ad.init_configs | Integration-specific options, similar to the init_config key within /etc/datadog-agent/conf.d/<CHECK_NAME>/*.yaml. If this is blank in the example configuration file for a given check (conf.yaml.example), leave it blank here |
com.datadoghq.ad.instances | Describes the host and port where a service is running, often using template variables |
In your ECS task definitions, you’ll need to add these labels to the dockerLabels object in the definition of each container you’d like to monitor.
The Datadog Agent will look for containers in your ECS clusters that include the names of Datadog integrations in their names, image names, or labels, and configure the corresponding checks based on the labels you’ve added earlier (or the out-of-the-box templates).
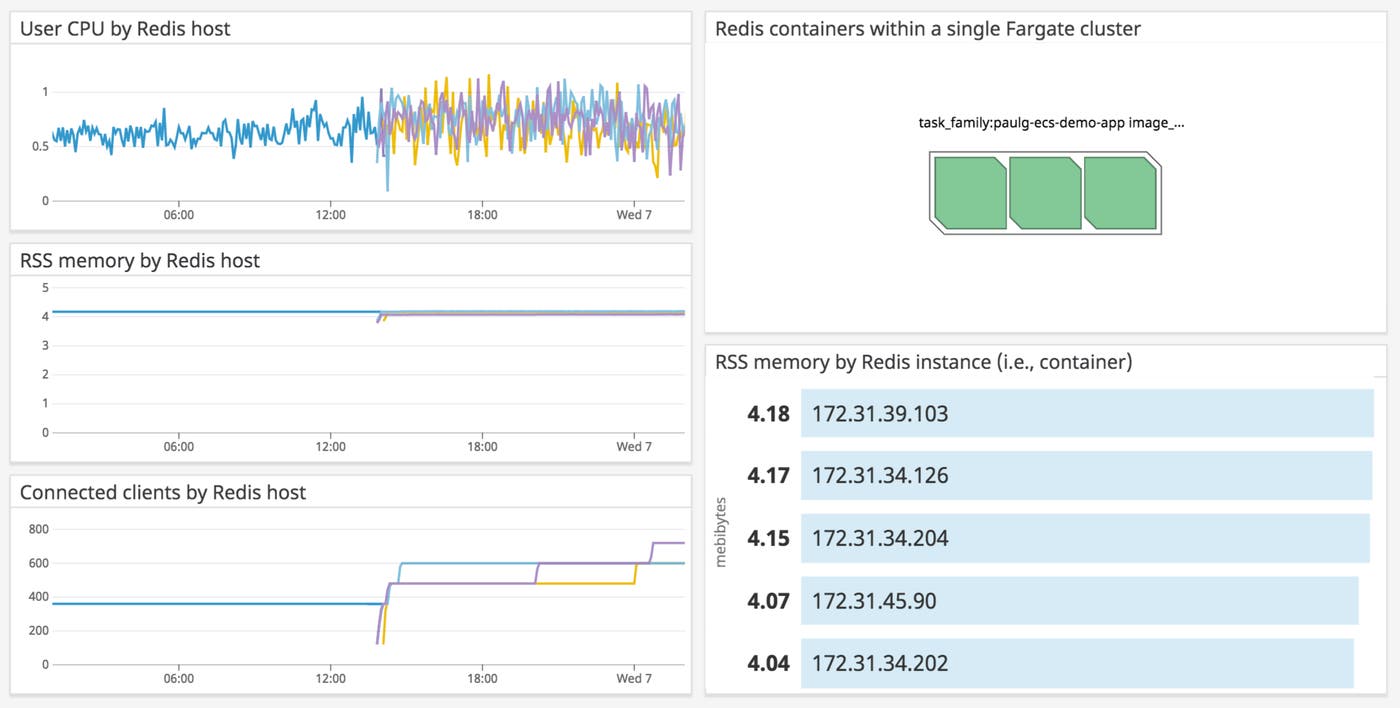
In the example below, we’re using ECS tags to track Redis metrics across three tasks in a Fargate cluster. Lines that begin partway along the x-axis represent new Redis containers that Autodiscovery has detected and started tracking. We’ve also ranked memory usage across the containers that are running our Redis service.
Troubleshoot your ECS applications with distributed tracing and APM
We’ve shown you how to use Datadog to monitor every layer of your ECS deployment. But in order to effectively troubleshoot your applications, you also need to get visibility into runtime errors, high response latency, and other application-level issues. Datadog APM can help you optimize your applications by tracing requests across the containers, hosts, and services running in your ECS cluster.
ECS is well suited to complex, scalable applications, and APM lets you cut through the complexity to discover issues and opportunities for optimization. With Watchdog, you can see whether any services running your application have unexpected changes in throughput, error rates, or latency, without having to set up alerts manually. And because the Agent receives traces from every component of your ECS infrastructure, you can monitor your applications even as tasks terminate and re-launch.
Set up APM on ECS
Enabling your application to send traces to Datadog requires two steps: instrumenting your application to send traces and configuring your Datadog Agent container to receive them.
Instrumenting your application code
You can instrument your application for APM by using one of our tracing libraries, which include support for auto-instrumenting popular languages and frameworks. You can also send custom traces to Datadog with a few method calls. And with distributed tracing, Datadog can follow requests no matter which containers, tasks, and hosts they’ve passed through in your ECS network.
The example below shows you how to instrument an application based on the tutorial for Docker Compose, which runs two containers: Redis and a Flask application server. The Flask application imports the library, ddtrace, which sends traces to the Datadog Agent. To make ddtrace available to your application, simply add it to your requirements.txt file and include this command in the Dockerfile for your application container:
RUN pip install -r requirements.txtThe steps will vary depending on the language you’re using, but usually involve importing a Datadog tracing library and declaring traces within your code (consult our documentation for what to do in your environment).
Our application code looks like this:
import timeimport redisfrom flask import Flaskimport blinker as _ # Required for instrumenting Flaskfrom ddtrace import tracer, Pin, patchfrom ddtrace.contrib.flask import TraceMiddleware
# Required for instrumenting tracing in Redispatch(redis=True)
app = Flask(__name__)
cache = redis.StrictRedis(host='localhost', port=6379)
traced_app = TraceMiddleware(app, tracer, service="paulg-ecs-demo-app")
# Pin, or "Patch Info," assigns metadata to a connection for tracing.Pin.override(cache, service="paulg-ecs-demo-redis")
def get_hit_count(): retries = 5 while True: try: return cache.incr('hits') except redis.exceptions.ConnectionError as exc: if retries == 0: raise exc retries -= 1 time.sleep(0.5)
@app.route('/')def hello(): count = get_hit_count() return 'Hello World! I have been seen {} times.\n'.format(count)
if __name__ == "__main__": app.run(host="0.0.0.0", port="4999", debug=False)In Datadog APM, you can use a different service tag to represent each microservice, database, web server—anything that receives requests and issues a response. Note that service is a reserved tag within Datadog APM, and is not the same thing as the servicename tag, which automatically gets added to certain ECS metrics as part of Datadog’s ECS integration. In the example above, we assigned a service to our Flask application as an argument to the TraceMiddleware constructor, and to our Redis instance in our call to Pin.override.
Datadog APM categorizes services by their environment (assigned with the tag key env), which might represent your development or production environment, a demo project, or any scope you’d like to keep isolated. On the services page within your Datadog account, you can use a dropdown menu to navigate between environments. By default, applications send traces with the environment tag, env:none. In our Python example, you could assign an env:prod tag with the code:
from ddtrace import tracertracer.set_tags({'env': 'prod'})The env tag is one of many tags that can add valuable context to your distributed request traces. You can use set_tags() to associate all the code you are instrumenting with a specific tag, such as service.
Editing your Datadog Agent task definition
Before the containerized Agent can accept traces from ECS tasks and forward them to your Datadog account, you’ll need to make two changes to the task definition that includes the containerized Datadog Agent.
First, you’ll want to make sure the Agent is listening on a port from which it can receive traces (port 8126, by default). In this case, we deployed a task in the Fargate launch type using the awsvpc network mode, and included the following portMappings object within the definition for our Agent container (the configuration would be the same for the EC2 launch type, as long as the Agent container can receive traces on port 8126):
"portMappings": [ { "protocol": "tcp", "containerPort": 8126 }Next, you’ll want to enable APM in your ECS cluster. Add the following environment variable to the environment object of the container definition for the Agent:
"environment": [ { "name": "DD_APM_ENABLED", "value": "true" }, ],The Agent uses environment variables to set configuration details in ECS and other Dockerized environments. See the full list of available variables in our documentation. Now that tracing is enabled and the Agent is running in a container deployed by your tasks, you should see traces from your application in Datadog.
Latencies and request rates
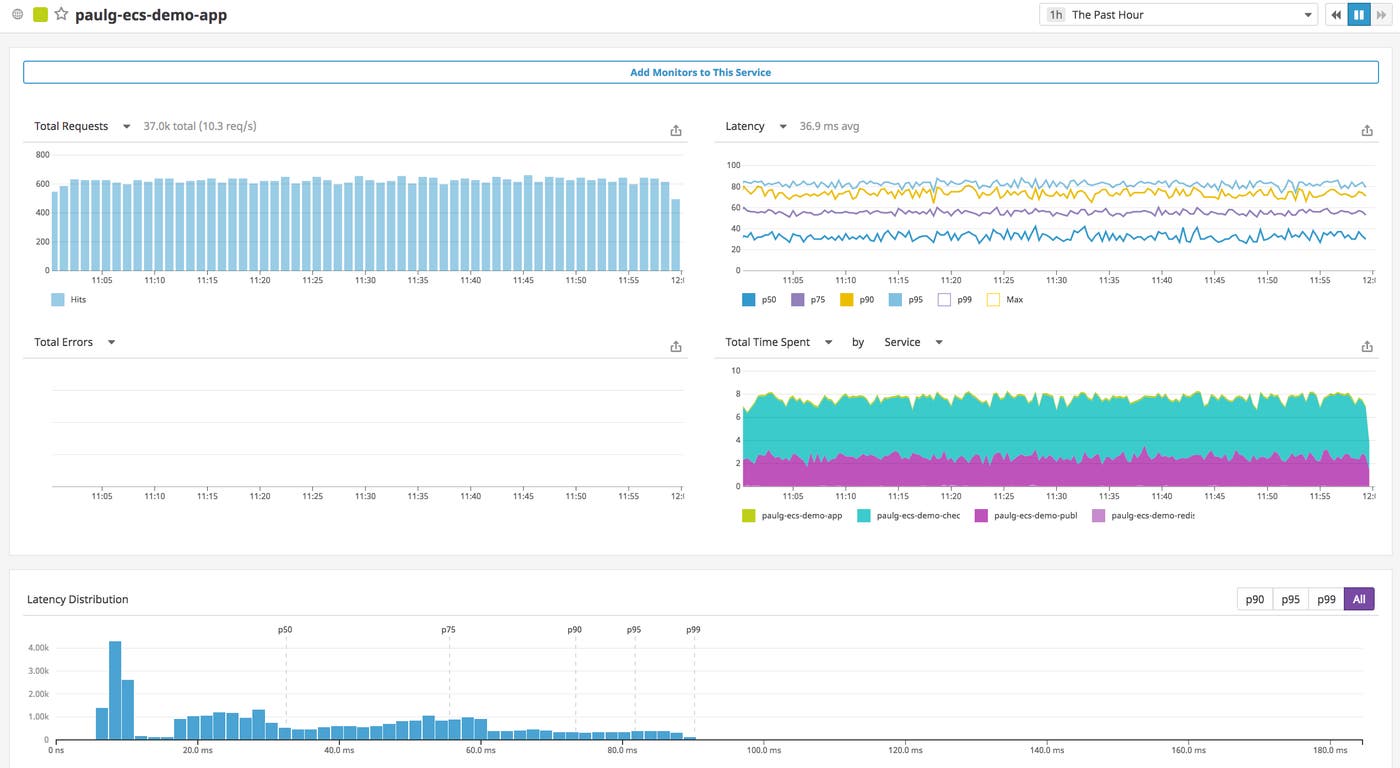
Once you’ve set up Datadog APM, you can inspect individual request traces or aggregate them to get deeper insights into your applications. Datadog gives you a per-service summary of request rates, latencies, and error rates, so you can easily track the overall health and performance of different components within your application. Below, you can see high-level metrics for the services within your infrastructure, such as the paulg-ecs-demo-app application we instrumented earlier, as well as other microservices it makes requests to.

If you click on a service, you’ll see a dashboard that displays key metrics like request throughput and error rates. You can also add each of these graphs to any other dashboard, making it straightforward to compare application-level metrics with data from ECS and other components of your infrastructure.
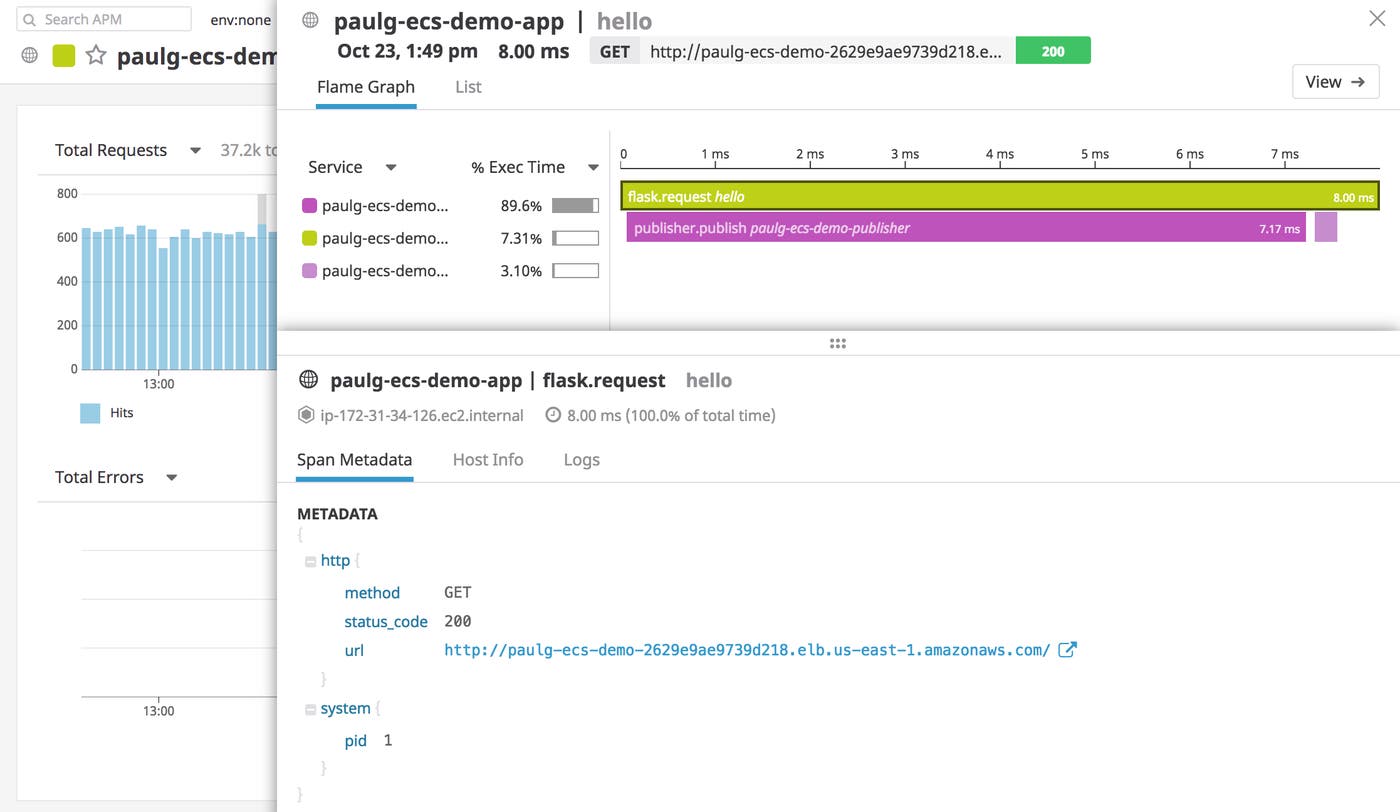
You can also inspect a single trace to see how long a request has spent accessing different services, along with relevant metadata, host metrics, and ECS logs. You’ll see application metrics from throughout your ECS deployment, regardless of the host, container, task, or service that generated them. And you can easily track the path of a single request, whether it remained within a single task or traveled between them. The flame graph below traces a request that involves three services within our ECS cluster: a web application (paulg-ecs-demo-app) that waits for responses from the service, paulg-ecs-demo-publisher (which is external to our Flask application) and our Redis instance, paulg-ecs-demo-redis.
The Service Map
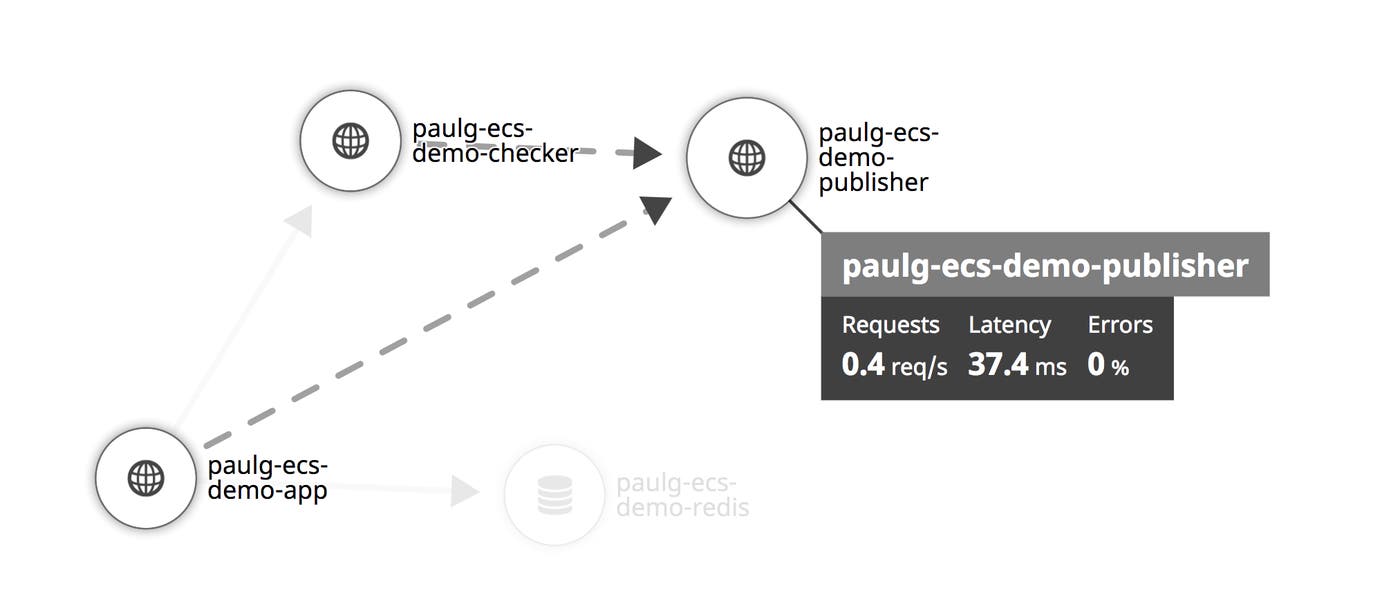
ECS gives you a framework for organizing your applications into microservices, and leeway over how you configure networking between containers, tasks, and (on EC2) container instances. Datadog’s Service Map makes it easy to ensure that the web servers, databases, and other microservices within your ECS deployment are communicating properly, and that latency and errors are at a minimum.
Now that you’ve set up APM on your ECS cluster, you can use the Service Map with no additional configuration. The Service Map can help you make sense of your ECS network by showing you how data flows across all the components of your infrastructure, how services relate to one another, and how healthy their connections are.
Get inside your ECS deployment with live containers and live processes
Once you’ve deployed the containerized Datadog Agent, you can start tracking the health and status of your ECS containers in the Live Container view. Each graph displays real-time graphs of container resource metrics at two-second resolution. Below, we’re examining two containers in the Live Container view: one running the ECS Container Agent and another running our web application. You can then use the facets within the sidebar—such as the “ECS Cluster” and “Region” facets we’ve selected below—to filter by tags.
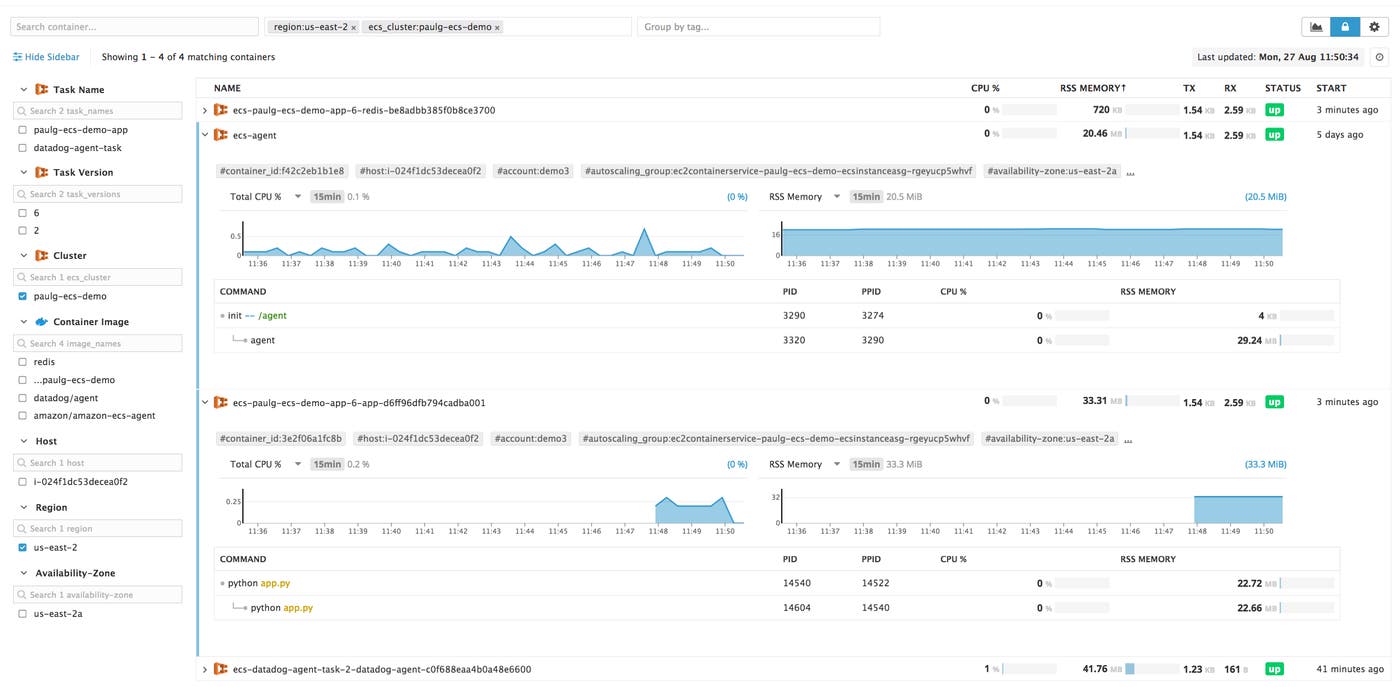
If you enable Live Processes for your containers, you can also view CPU utilization and RSS (resident set size) memory for each process they run. To gather information about container-level processes, the Datadog Agent requires access to the Docker socket, which the Docker daemon uses to communicate with containers. Fargate does not provide direct access to the Docker daemon or socket, so the Agent can only track processes in ECS containers that use the EC2 launch type.
To configure Docker process monitoring, simply make two modifications to any task definition that includes the Datadog Agent. First, assign the environment variable DD_PROCESS_AGENT_ENABLED to true. Second, designate a volume for the system directory /etc/passwd (see our documentation) and create a bind mount to that volume. Once Datadog begins collecting process-level metrics, you can determine with greater precision why a container is using the resources that it is, and how this resource utilization has changed over time.
Get context by processing and analyzing ECS logs
When running dynamic, containerized applications in ECS, it’s important to be able to filter, aggregate, and analyze logs from all your services. You might want to investigate, for example, if a series of runtime errors is associated with a single application container image, or if new levels of resource reservation in a task definition are triggering errors on a specific EC2 instance.
Datadog can collect ECS logs from any containers in your clusters, and lets you group and filter logs to discover trends. There are two ways to configure Datadog to collect and process your ECS logs. In the first, the Datadog Agent sends logs directly from ECS containers running in an EC2-based cluster, bypassing CloudWatch Logs (and the additional billing the service entails), while also giving you more configuration options and access to logs from the ECS Container Agent. The second method works with either launch type, and uses a Lambda function to forward container logs from CloudWatch Logs to Datadog. In Fargate, since you’re restricted to CloudWatch Logs, using this method is the only available option.
Sending ECS logs from your EC2 instances
For tasks deployed with the EC2 launch type, you can configure the Agent to send your ECS logs directly from your EC2 cluster to Datadog. This option preserves all of your AWS-based tags and lets Datadog collect any logs from your container instances as well as from the ECS Container Agent.
Edit the task definition that includes the Datadog Agent container as explained in our documentation, adding the required volume, mount point, and environment variables. You’ll also want to edit the definitions for any containers from which you’d like to collect logs so that they use a log driver that writes to a local file—json-file does, for instance, while awslogs does not.
The containerized Datadog Agent will listen for logs from all of the containers on your container instances, including the ECS Container Agent, unless you opt to limit log collection to specific containers. There’s nothing specific to ECS in this technique: since ECS containers are regular Docker containers, you can customize the way Datadog collects logs from them just as you can with any other container. This also means that logs from ECS containers have no one format—you can set up a log processing pipeline to enrich your logs with metadata that Datadog can use for grouping, filtering, and analytics, regardless of how your logs are structured.
For example, you can create a new log processing pipeline to handle logs from the ECS Container Agent. This lets you correlate metrics from your ECS deployment with messages from the ECS Agent, such as changes in the status of particular tasks and notifications that ECS is removing unused images. When you create a pipeline, fill in the “Filter” field (see the image below) so the image_name attribute matches the name of the ECS Container Agent’s image, amazon/amazon-ecs-agent.
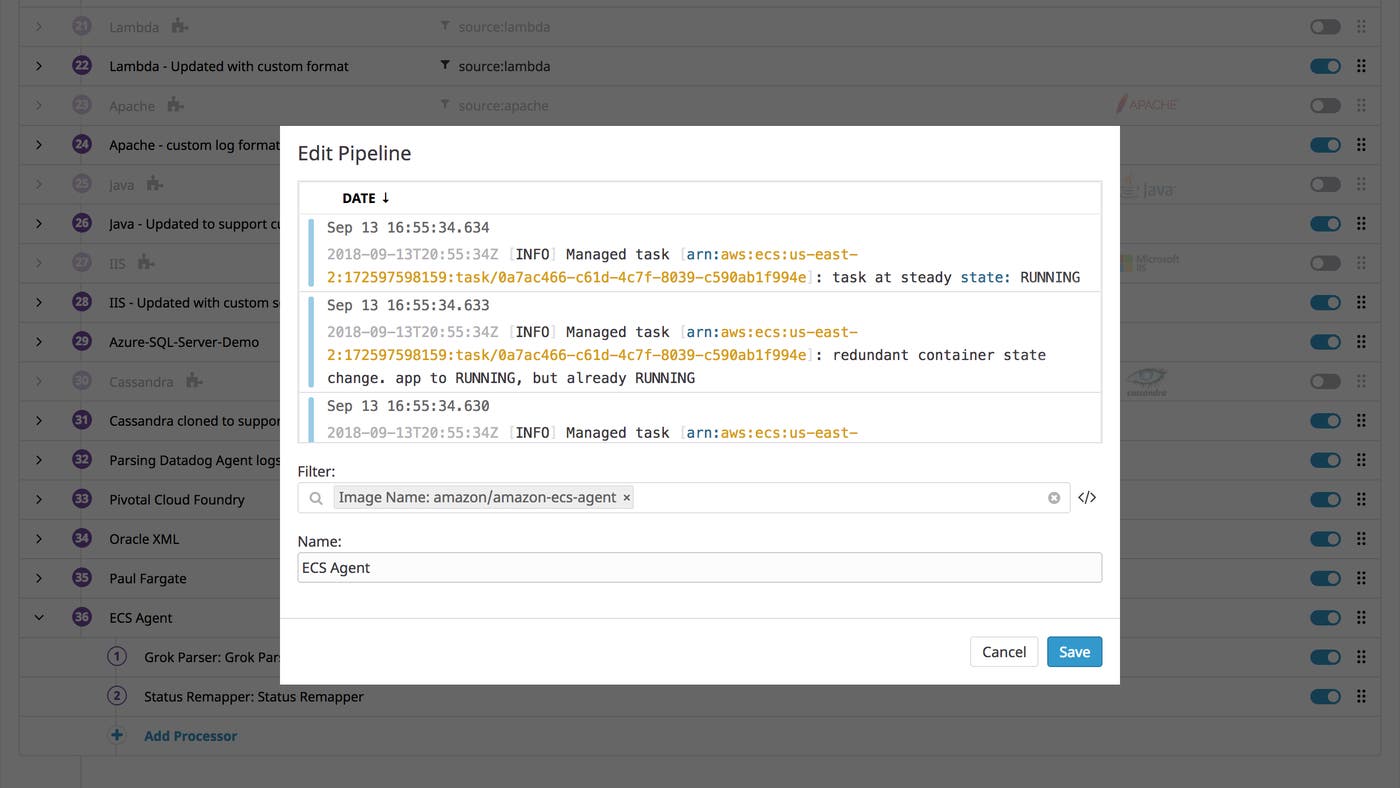
The new pipeline will start processing logs into the following format.
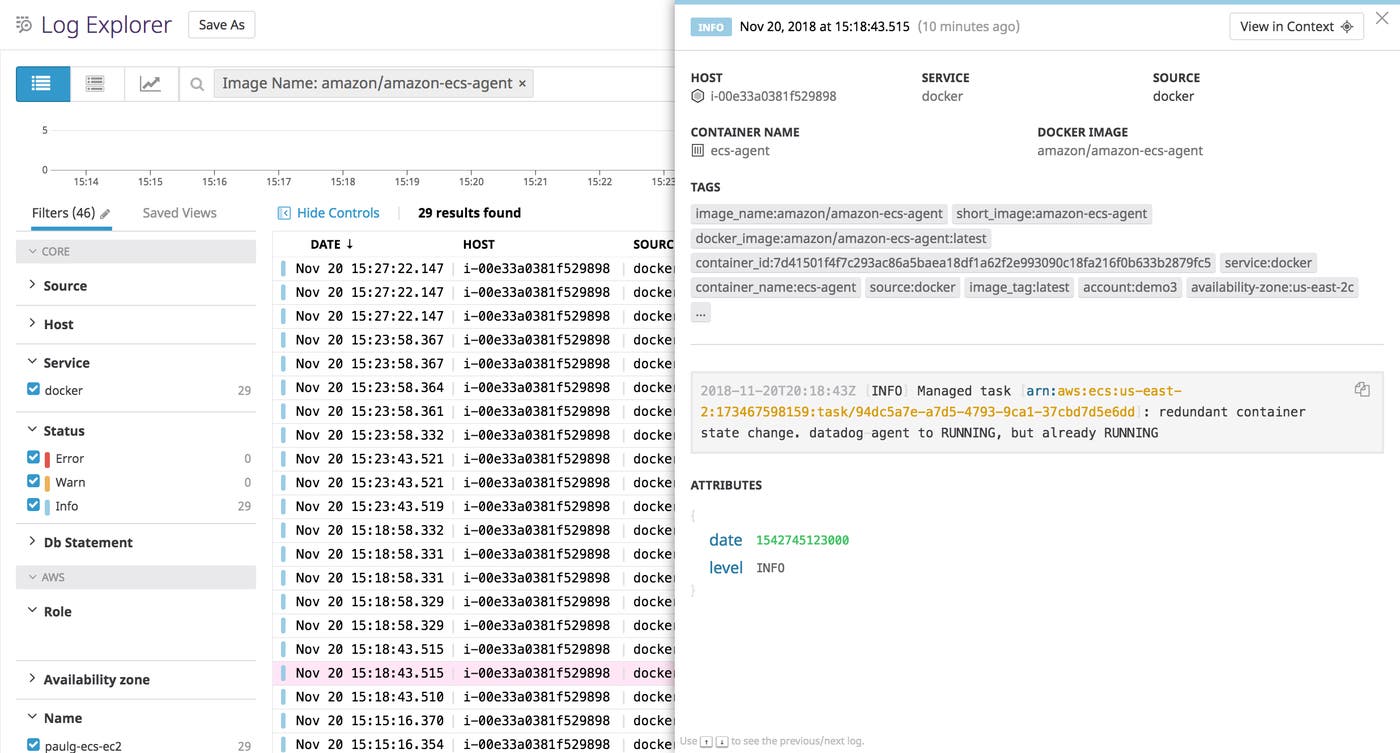
You can then add log processing rules to the pipeline. For example, a log status remapper lets you use the log level (e.g., INFO) to group and filter your logs, letting you investigate only those logs with a certain severity.
Using AWS Lambda to collect ECS logs from CloudWatch
Datadog provides a custom AWS Lambda function that helps you automatically collect logs from any AWS service that sends logs to CloudWatch. The Lambda function triggers when CloudWatch receives new logs within a particular log group, then sends the logs to Datadog so that you can visualize, analyze, and alert on them.
Update your task definition to publish ECS logs to CloudWatch Logs
To start collecting logs from ECS containers, you’ll need to make sure that your tasks are publishing logs to AWS in the first place. Check whether each container definition has a logConfiguration object similar to the following:
"logConfiguration": { "logDriver": "awslogs", "options": <OPTIONS_OBJECT>}Setting the logDriver to awslogs directs the container to send ECS logs to CloudWatch Logs. Later, we’ll show you how to use the options object to customize the way ECS publishes logs to CloudWatch. When editing a container definition in the CloudWatch console, you can either specify the name of an existing CloudWatch log group, or check the box, “Auto-configure CloudWatch Logs,” to automatically create a CloudWatch log group based on the name of the container’s task definition (e.g., /ecs/paulg-ecs-demo-app). This configures AWS to forward all CloudWatch logs from the container to the specified log group. By default, your container will log the STDOUT and STDERR of the process that runs from its ENTRYPOINT.
Configure a Lambda function to send ECS logs to Datadog
The next step is to get AWS Lambda to send ECS logs from your CloudWatch log group to Datadog. If you’ve configured Datadog to collect logs from other AWS services, the process is identical. Create an AWS Lambda function and paste in the code from our GitHub repo, as described in our documentation, following our instructions to configure your Lambda function.
Finally, set the function to trigger based on activity from your CloudWatch log group (the same log group you used to collect ECS container logs in your task definition). Your screen should resemble the following.
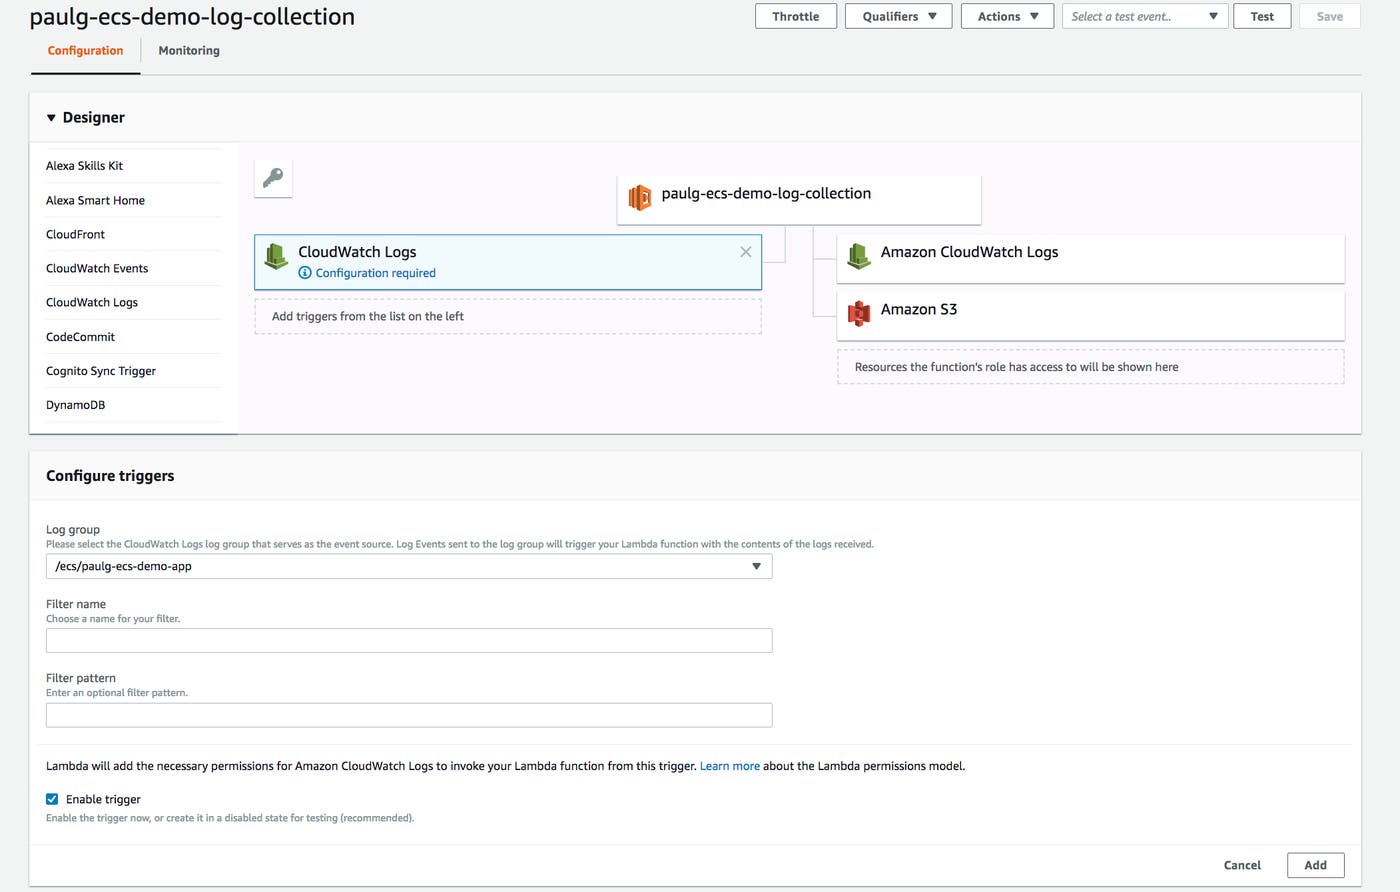
Now that you’ve configured the Lambda function to forward ECS logs from the appropriate log group to Datadog, you’ll be able to access all of your logs automatically in the Datadog platform, even as tasks using that definition launch and terminate.
Ensure ECS cluster availability with Datadog alerts
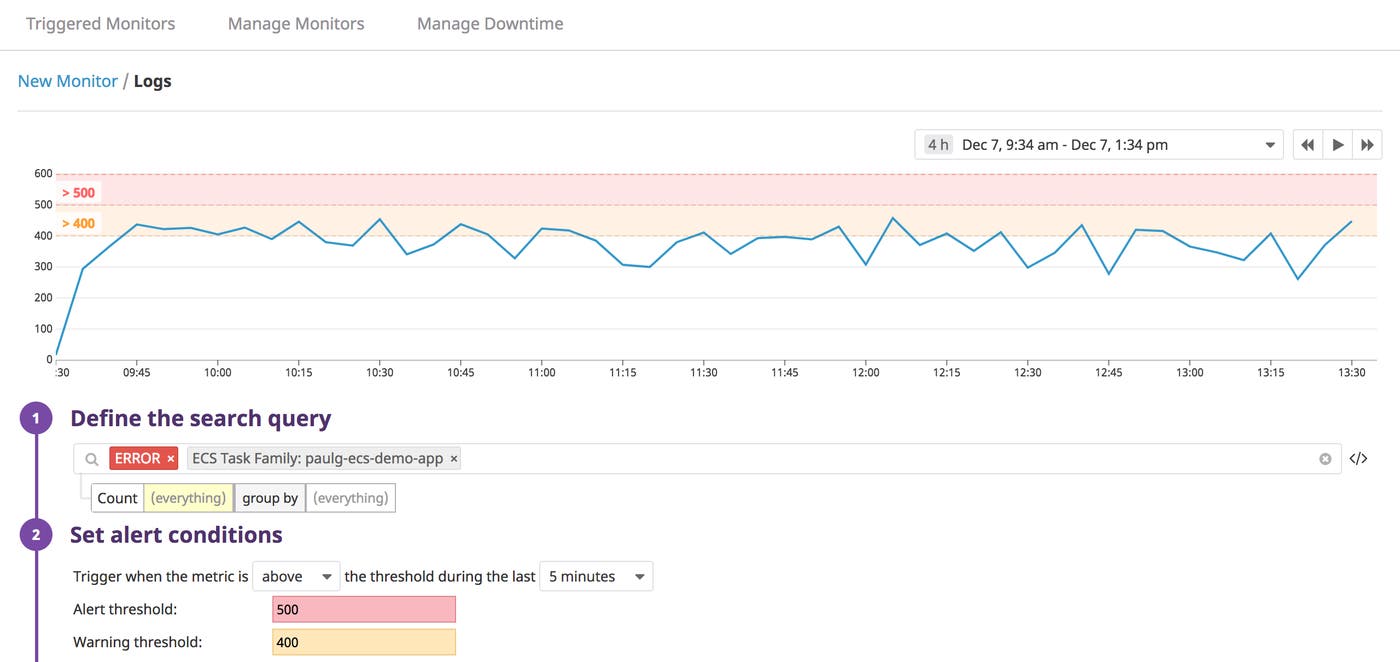
You can alert on every kind of ECS data that Datadog collects, from the status of tasks and services to the resource use of your containers and hosts. In the example below, we’re using the task_family tag to alert on a certain frequency of error logs (500 over the course of five minutes) from the task hosting our application.
At other times, you’ll want to alert at the level of the ECS service. If you’ve configured a service to place multiple instances of a task definition, you can create an alert to ensure that the service is operating as expected. Below, we set up an alert that will trigger if the number of running containers within a single ECS service has decreased by two —which means that two containers have entered a STOPPED state—over the past hour. This way, you can find out if, say, an error in our application code has prevented containers in a newly placed task from starting.
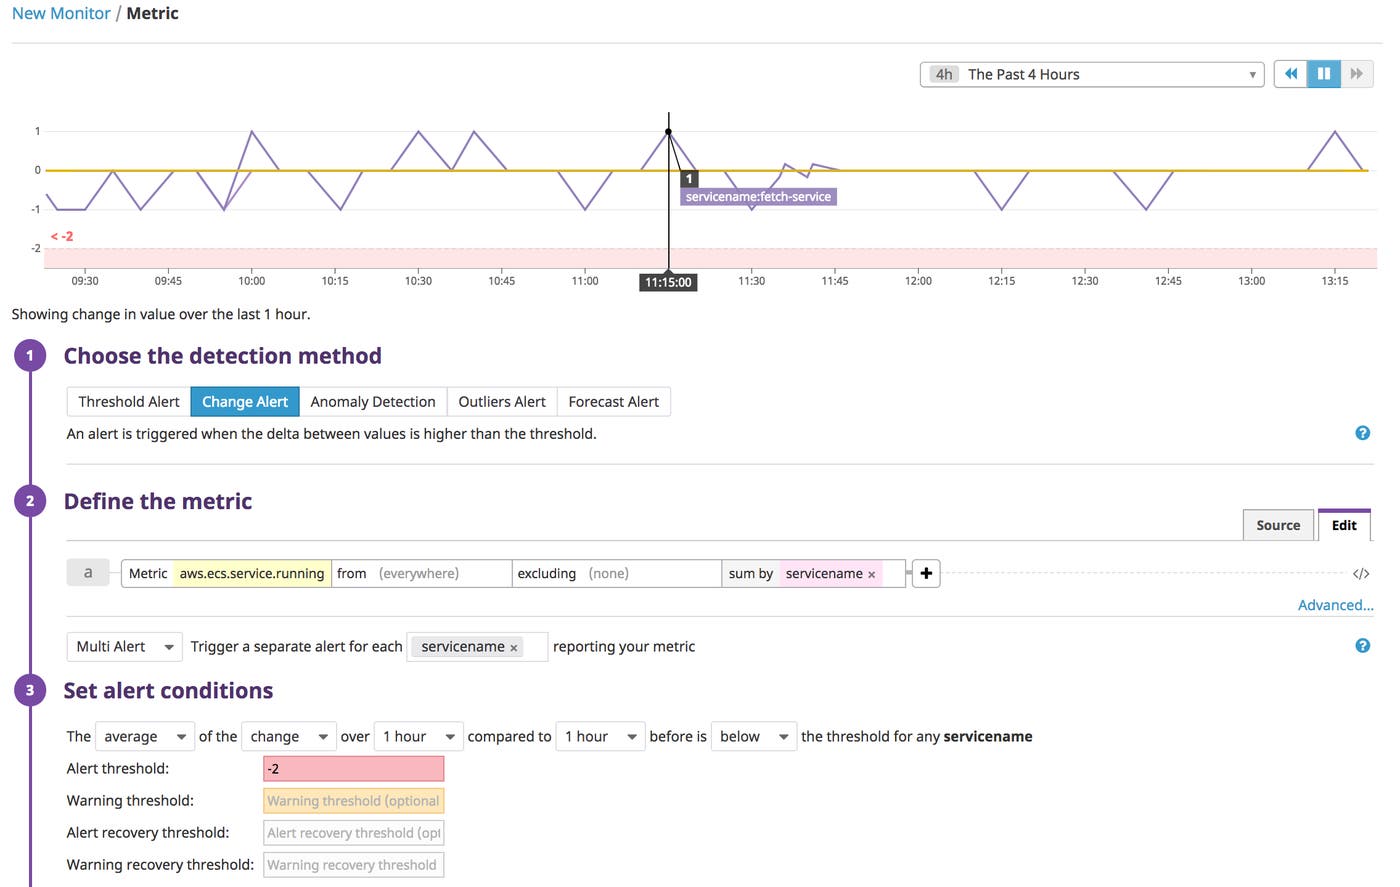
You can also create a similar alert for aws.ecs.running_tasks_count, the number of tasks per container instance in the RUNNING state, to help ensure that our cluster remains available. Datadog lets you be flexible with how you use tags and choose data for setting alerts, letting you customize your alerting for whichever complex distributed system you deploy with ECS.
Monitoring as dynamic as your ECS cluster
In this post, we’ve shown how Datadog can help address the challenges of monitoring ECS environments. We’ve also shown you how to use tags and built-in visualization features to track the health and performance of your clusters from any level of abstraction—across tasks, services, and containers—within the same view. And as tasks advance through their lifecycles, Datadog can monitor them in real time and alert you to any potential issues.
For more information about monitoring AWS Fargate—including ECS and EKS on Fargate—see our AWS Fargate monitoring guide.
If you’re new to Datadog, you can start collecting metrics, traces, and logs from ECS with a 14-day free trial.
We wish to thank our friends at AWS for their technical review of this series.


