Evan Mouzakitis
Chances are you've created an alert that didn't fire exactly when you expected it to, even though it is working exactly right. Often an alert is configured to trigger when a moving average exceeds a certain threshold—for example, when the number of 5xxs averaged over the last hour exceeds two per minute—and often you may not have a view that shows the moving average.
Enter Monitor View, a new feature for monitors that graphs your data exactly as it is processed by our alerting backends.
Seeing when alerts will trigger
Let's take a look at a concrete example. Here, we've set up a monitor to alert on haproxy.backend.queue.time, should it exceed an average value of .01 ms over the last hour. Here's what our real-time data looks like, averaged over the group of HAproxy machines. Can you spot when it will trigger?

In the above screenshot, you can see the data points stream in, in real-time. For most people, computing a trailing average over the past hour for these data points is not intuitive. In this case, it is exceedingly difficult to gauge the exact moment the value (averaged over the past hour) exceeded .01.
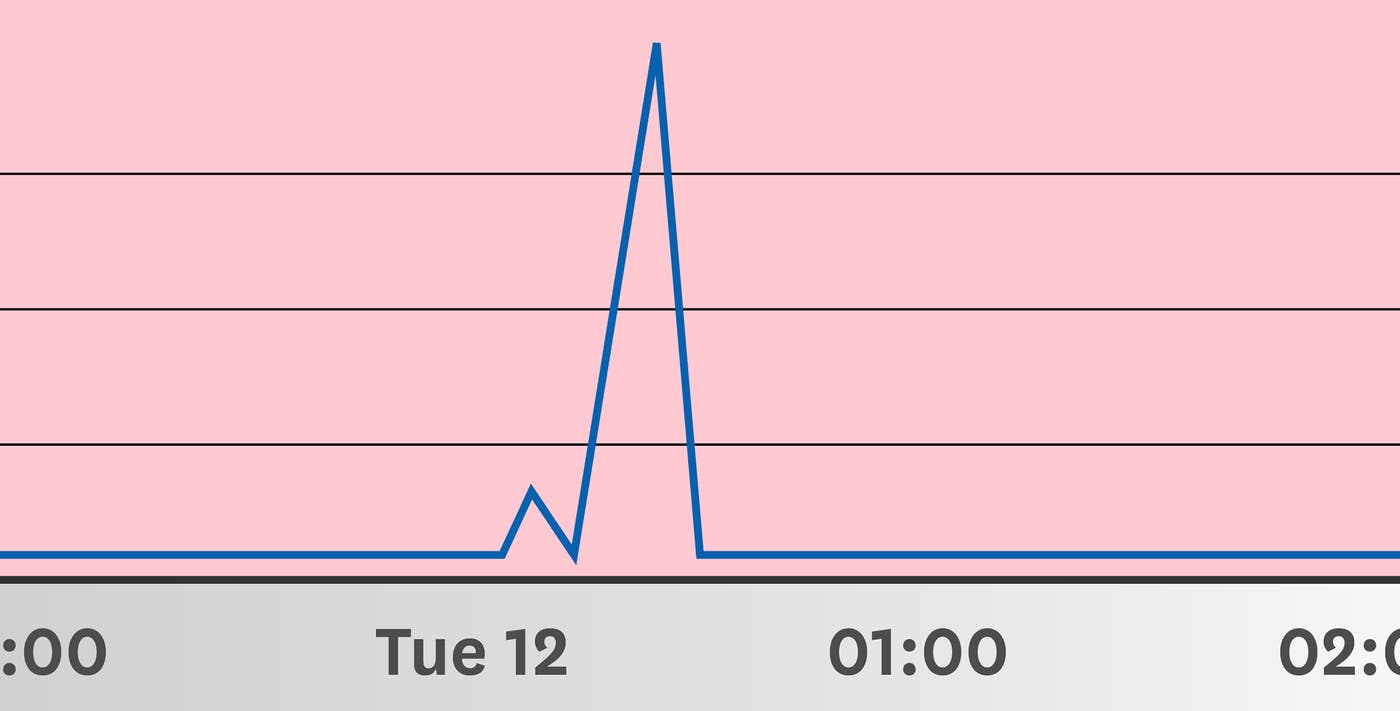
The next screenshot shows the same data, this time from the Monitor View perspective:

Now it is clear that the value of the haproxy.backend.queue.time metric, averaged over an hour, exceeded the .01 threshold value only one time: at 12:20 on January 12th.
Try it today
New to Monitors? Check out our guide which walks through setting up a monitor for your infrastructure.
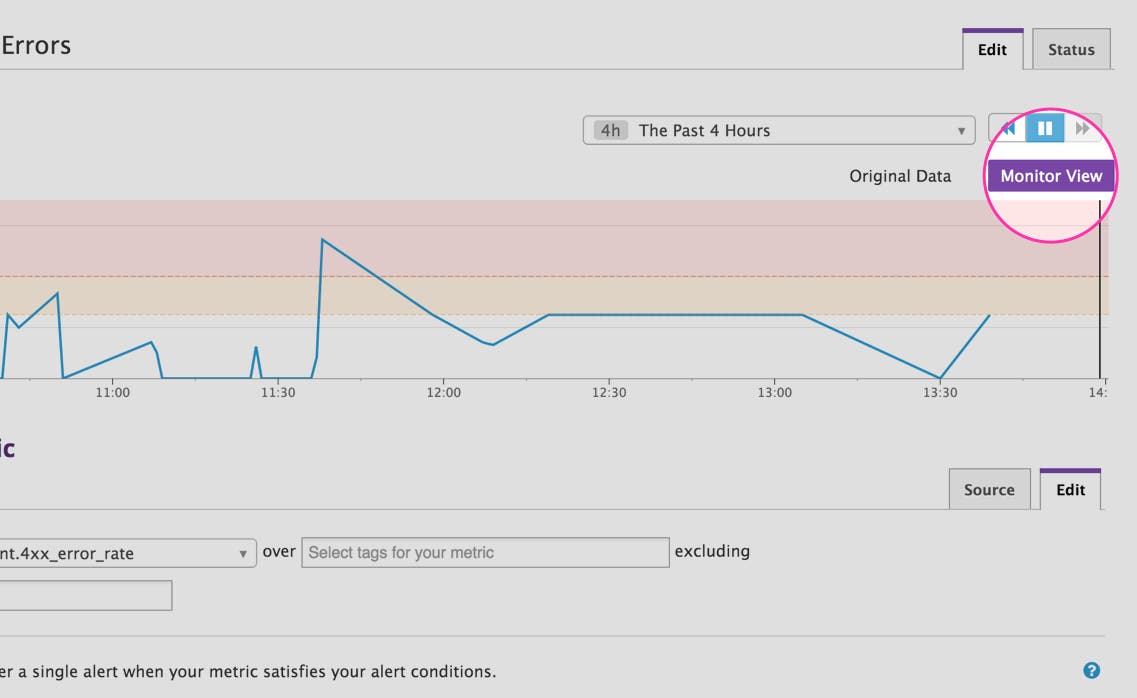
Datadog customers can access the new feature by navigating to the Monitors page and clicking on an existing Metric Monitor. In the monitor editing page, change your view from Original Data to Monitor View.

If you don't have a Datadog account, you can try it out today by signing up for a free trial.

