Bowen Chen

David Pointeau

Brittany Coppola
Temporal Cloud is the managed service that enables you to quickly scale the Temporal workflow orchestration engine across your organization. Using Temporal Cloud, you can offload the infrastructure management of the Temporal Service and focus on developing Workflows that increase the reliability of your applications and help them remain functional throughout service errors and system outages.
Datadog’s Temporal Cloud integration gives you granular insights into your Temporal Cloud Service, Temporal’s task polling, Workflow activity, and more so you can quickly identify errors and bottlenecks that risk slowing down your applications that rely on Temporal Workflows. In this blog post, we’ll discuss how the Temporal Cloud metrics found in our preconfigured dashboard enable you to do the following:
- Visualize the health of your Temporal Cloud Services
- Monitor your Temporal Workers’ task polling
- Quickly identify errors in your Temporal Workflows
Visualize the health and performance of your Temporal Frontend Services
Temporal Cloud handles management of the Temporal Service for you. On the backend, your application relies on the Temporal Service to accept and process API requests. If your Temporal Service is struggling to handle heavy traffic, it can bottleneck your entire orchestration pipeline, even if you have properly configured Workers and task queues. Using Datadog’s preconfigured Temporal Cloud dashboard, you can visualize the current load by monitoring the gRPC request rate over time and how frequently the service is throttling incoming requests or encountering errors. If you notice spikes in the gRPC error rate, you’ll need to investigate your Temporal SDK logs to determine the error code, which can help you identify whether the issue is network-related, the result of an SDK misconfiguration, or if the rate of workflows is exceeding your quotas.
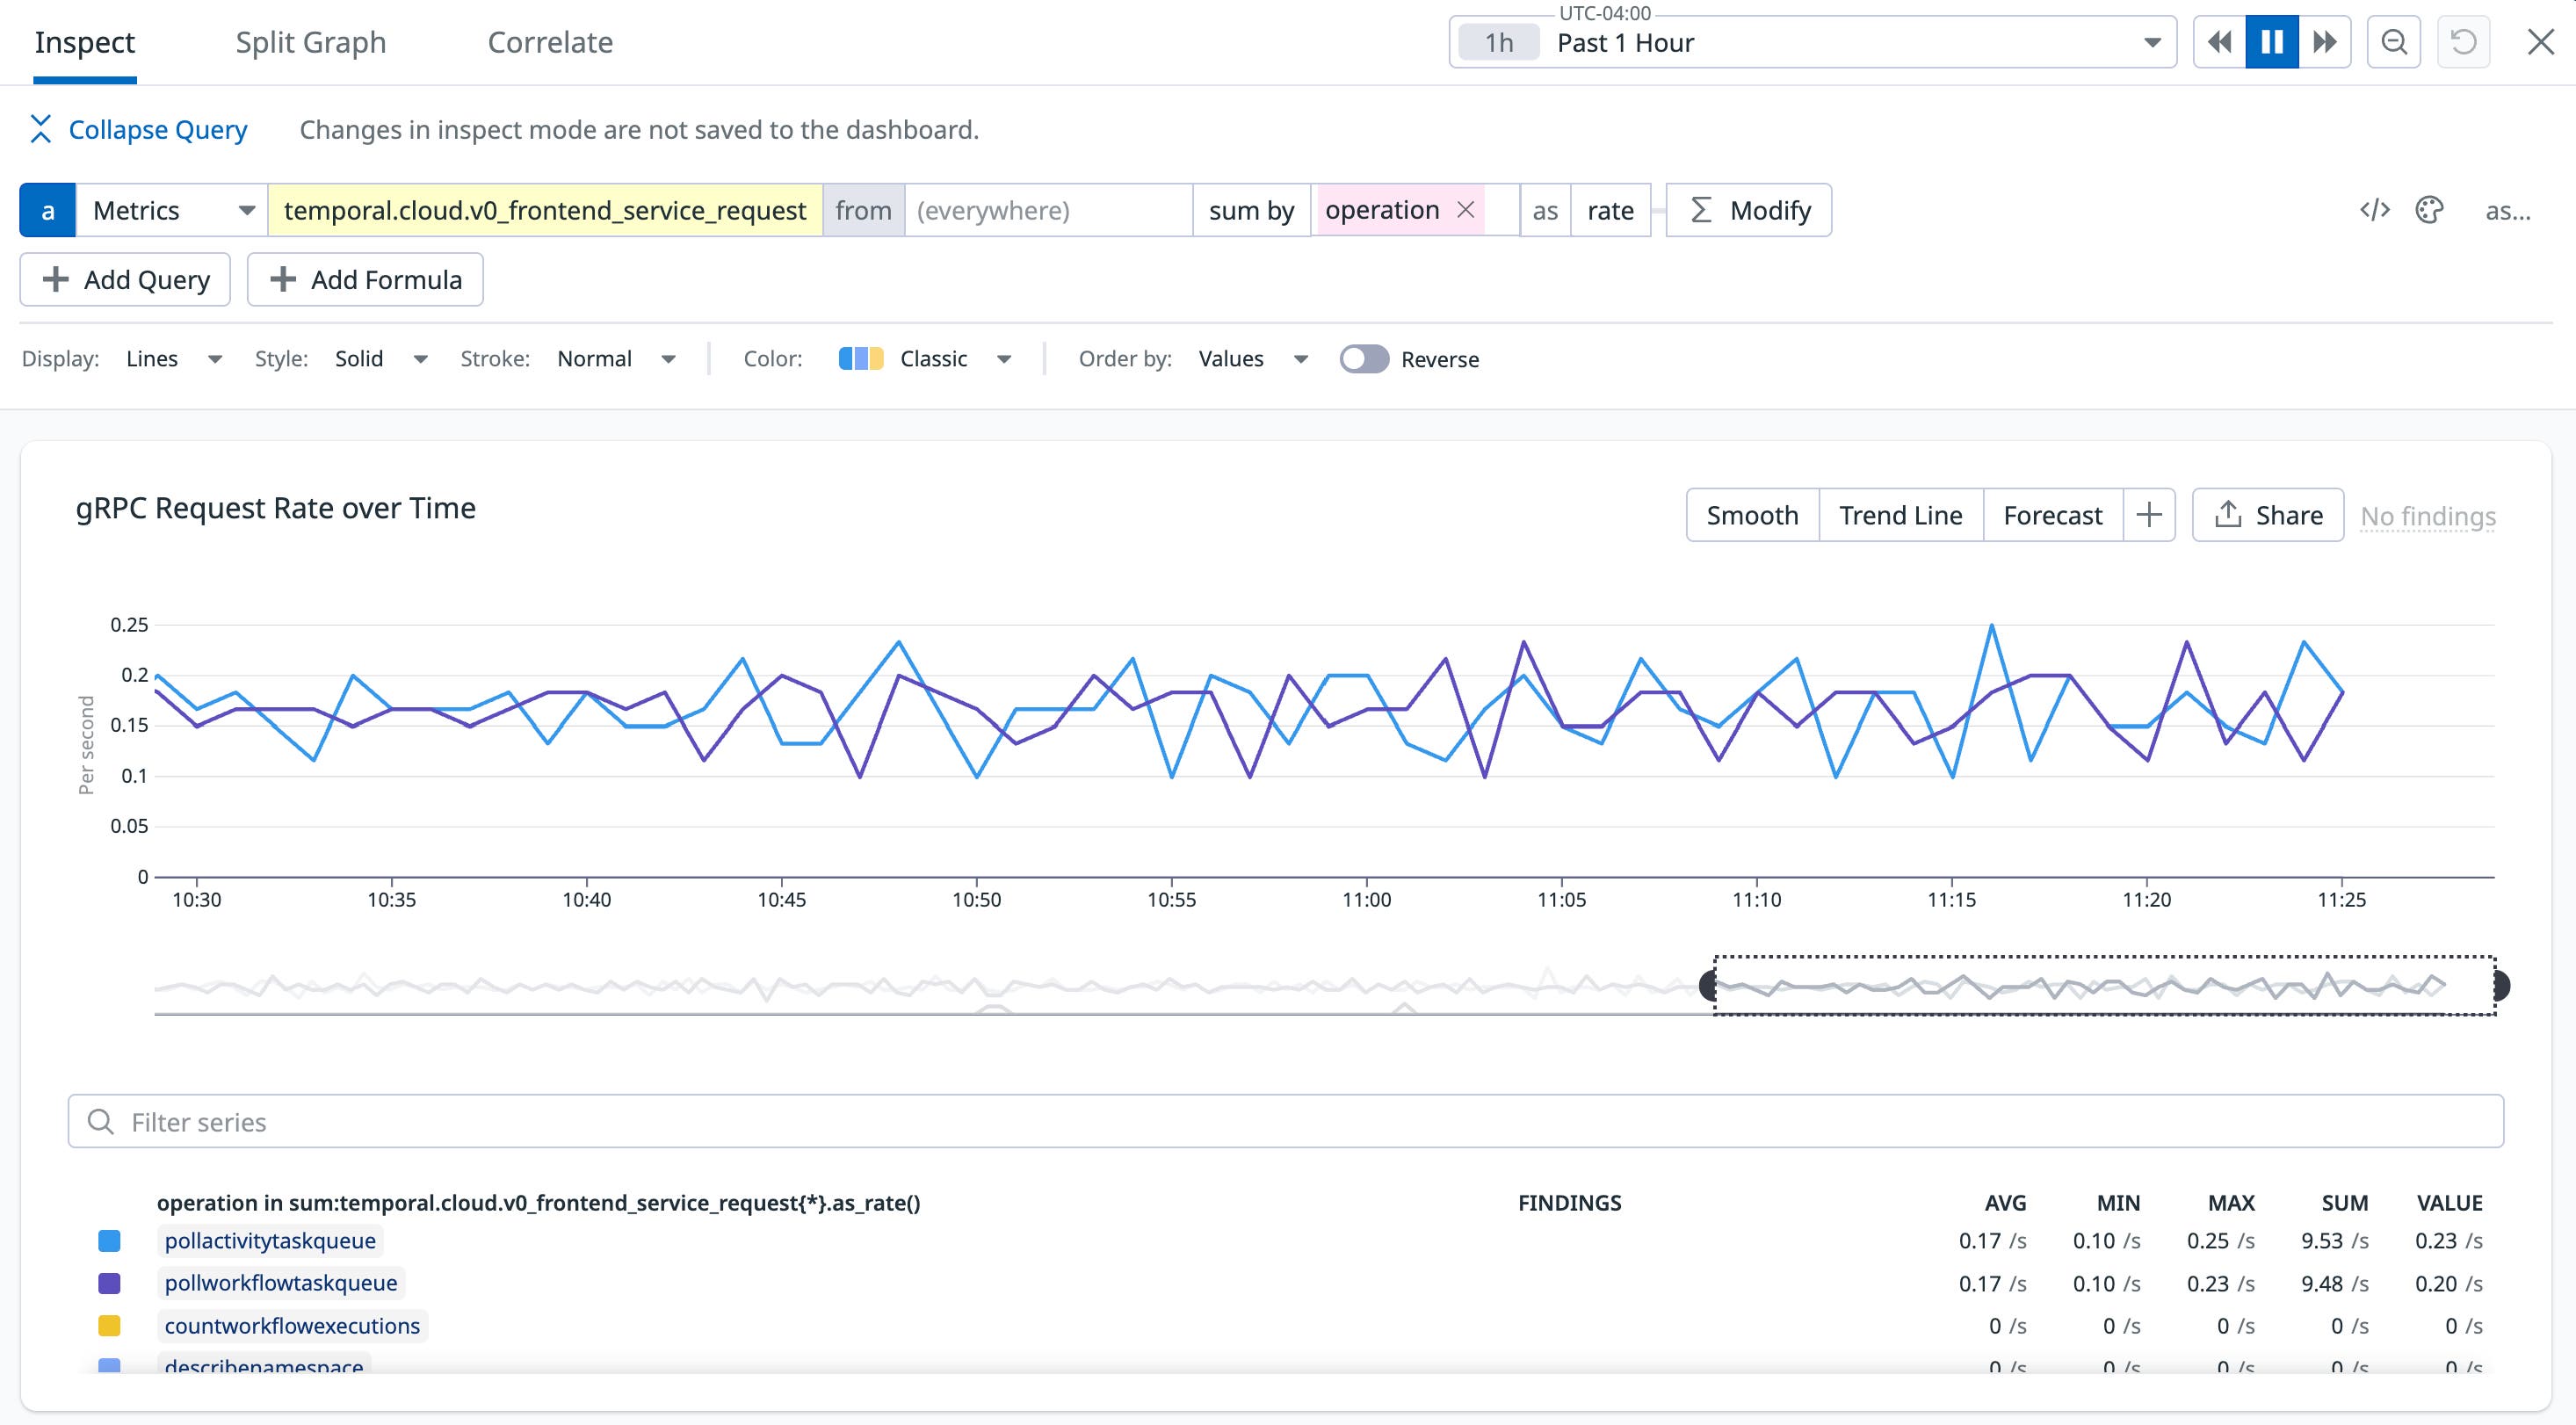
Using the metrics in the dashboard, you can load-test your clusters to validate how your system responds under pressure and detect when Temporal is bottlenecking your request lifecycle. State transitions measure the amount of work done by Workflow Executions. This can be a more reliable metric for throughput than the rate of completed Workflows, which can greatly differ in runtime based on the Workflow definition. By comparing the average state transition rate over time with service latency, you can determine how well your system responds to increases in load. For instance, if you increase the number of parallel Workflows, you should see an increase in the rate of state transitions over time. When this increase begins to be reflected in your Temporal Cloud’s service latency, this indicates the upper limit of load your service is able to handle.
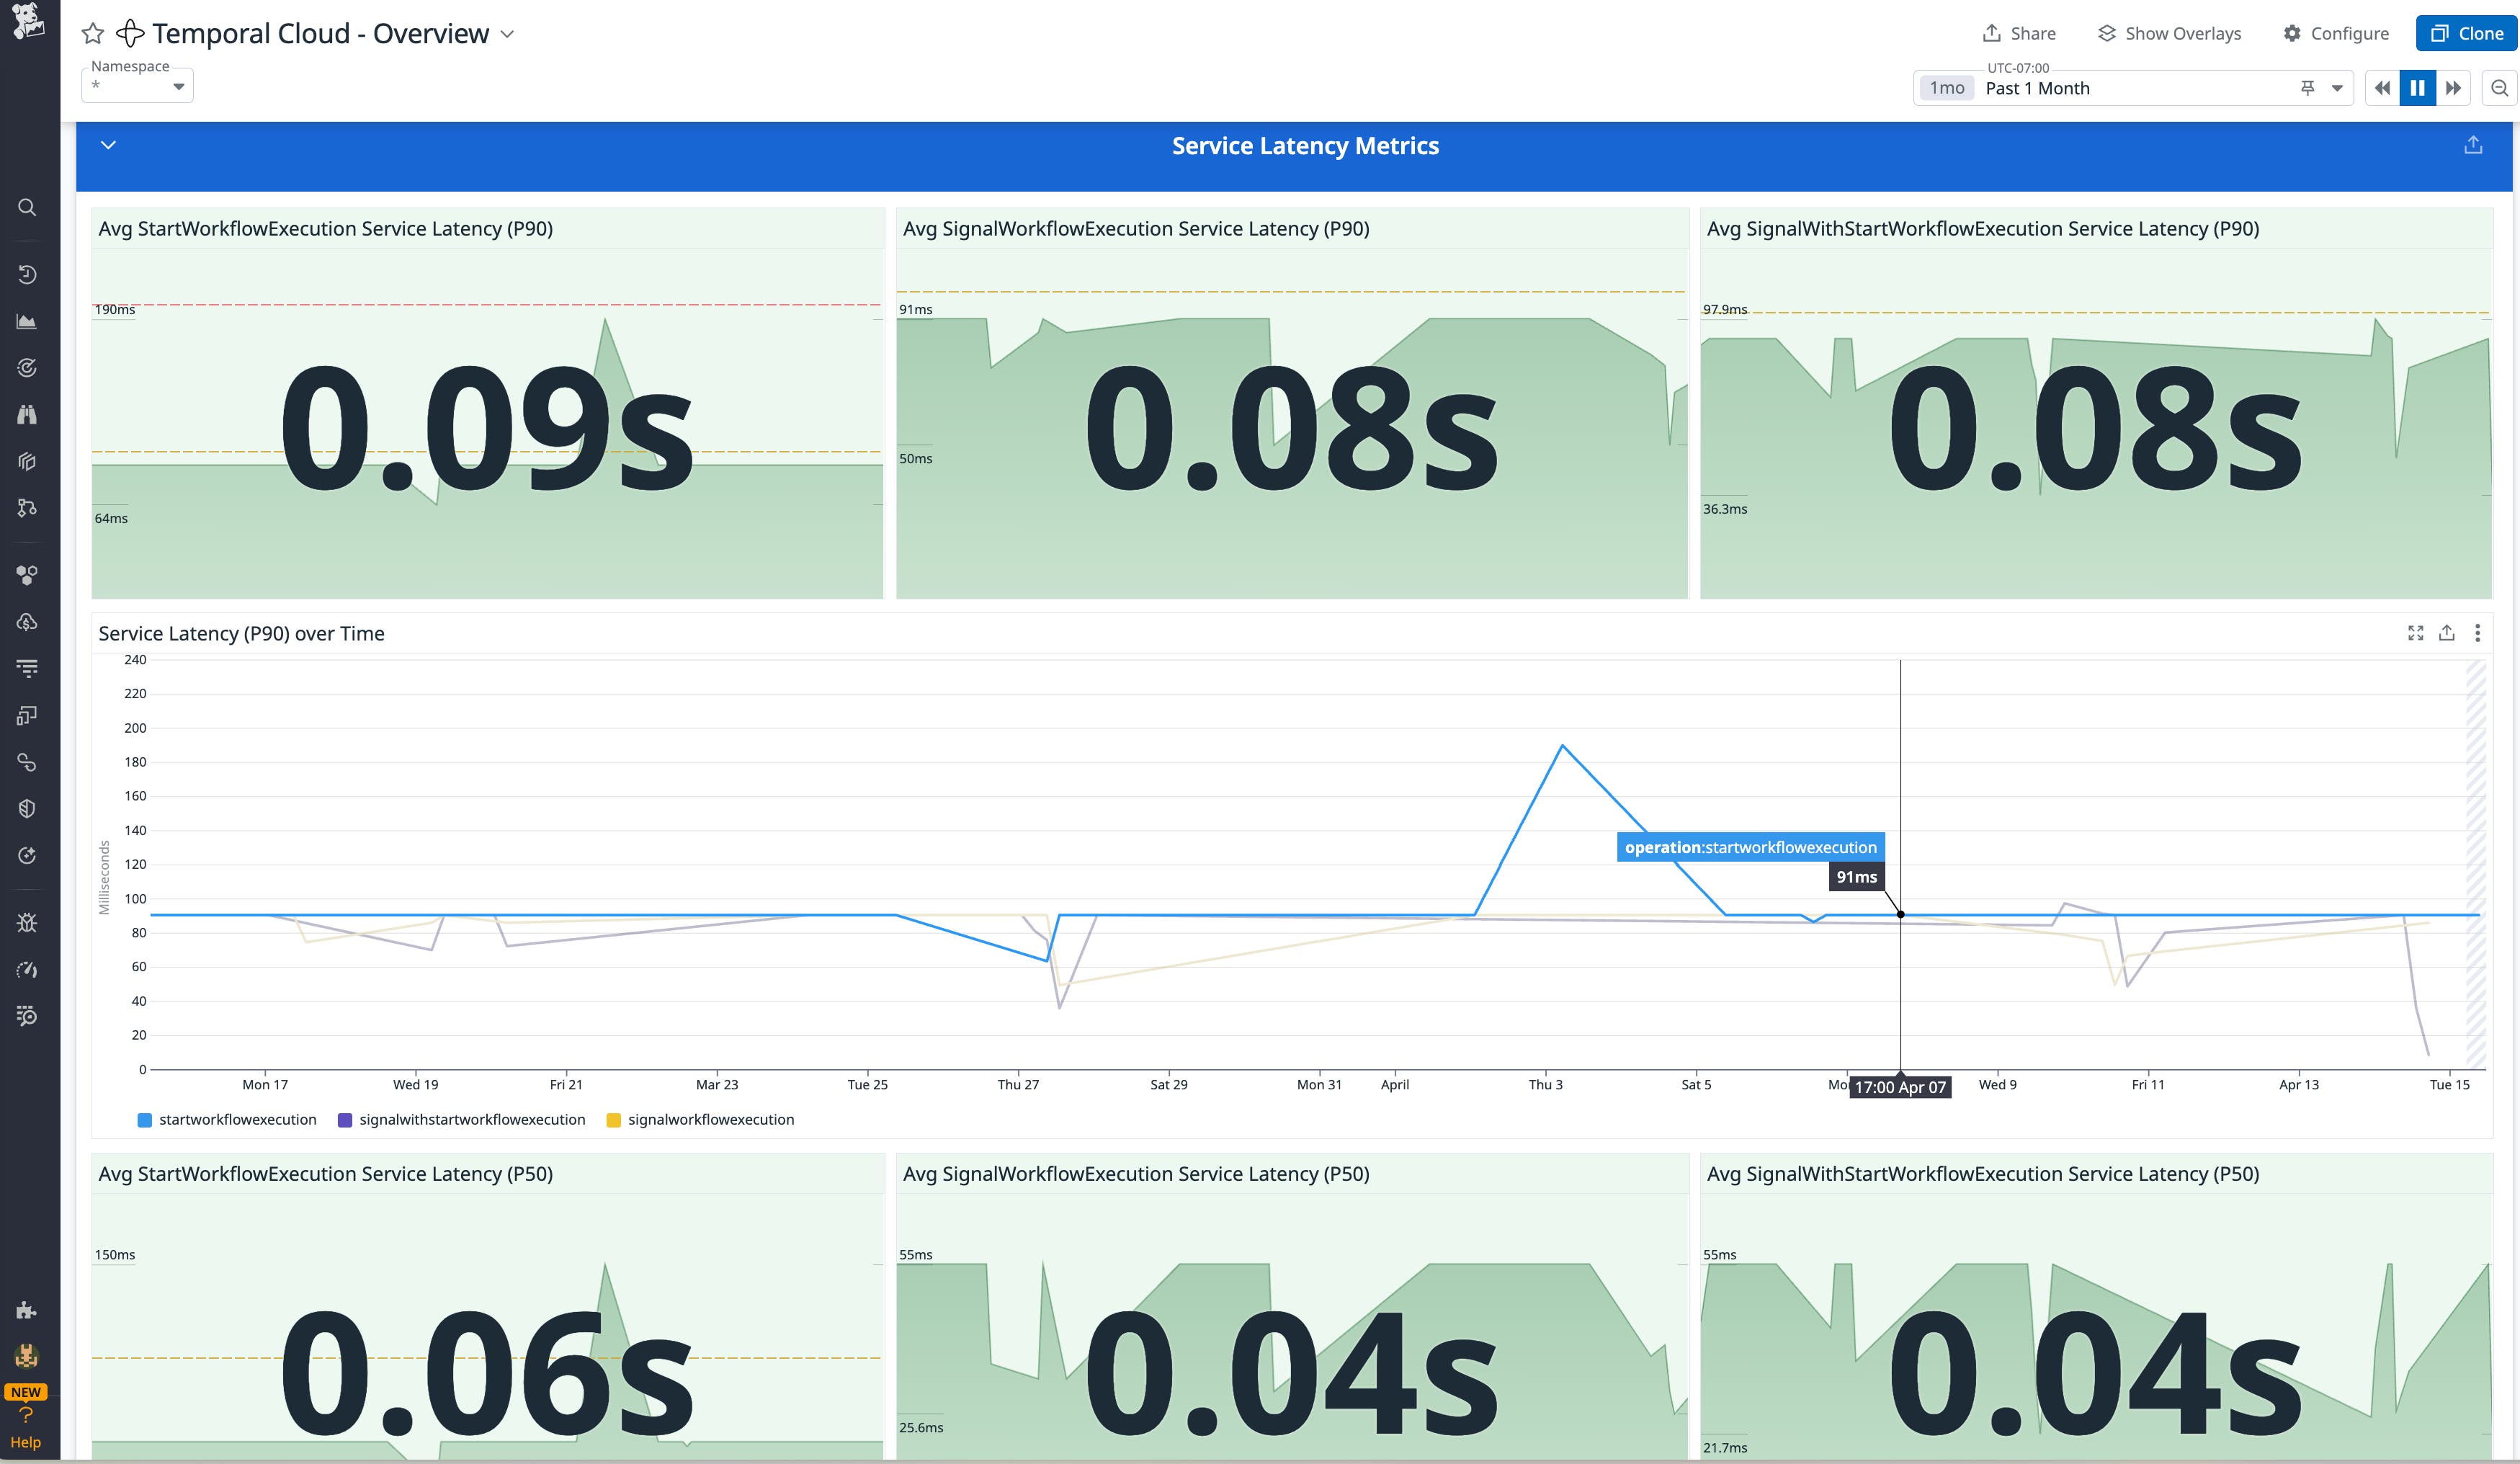
Datadog’s preconfigured Temporal Cloud dashboard enables you to visualize Temporal Cloud’s service latency by different operations, the most important being the following:
StartWorkflowExecution: the time from when a Workflow is requested to when Temporal acknowledges it.SignalWorkflowExecution: the time it takes to route a signal to a running Workflow. If you notice unexpected increases in either of these execution latencies, contact Temporal Support to assist you in deeper troubleshooting.
Monitor your Temporal Workers’ task polling
Temporal Cloud’s task polling is responsible for efficiently load balancing tasks across available Temporal Workers. A Worker actively polls a task queue for tasks to process—the Temporal Service is responsible for assigning tasks within each task queue to the Worker. If done efficiently, the task is assigned from memory, which is known as synchronous matching. However, if there are no available Workers to match to the task, it can send the task to Temporal Cloud’s persistence layer, where it needs to be reloaded once a Worker becomes available. This is known as asynchronous matching, and it increases the load on the database as well as the overall latency in your system (since tasks are waiting to be assigned). You can monitor the rate of synchronous matching using the Task Sync Match Percentage in our dashboard. Generally, you should aim for a 99 percent or higher rate for synchronous matching.
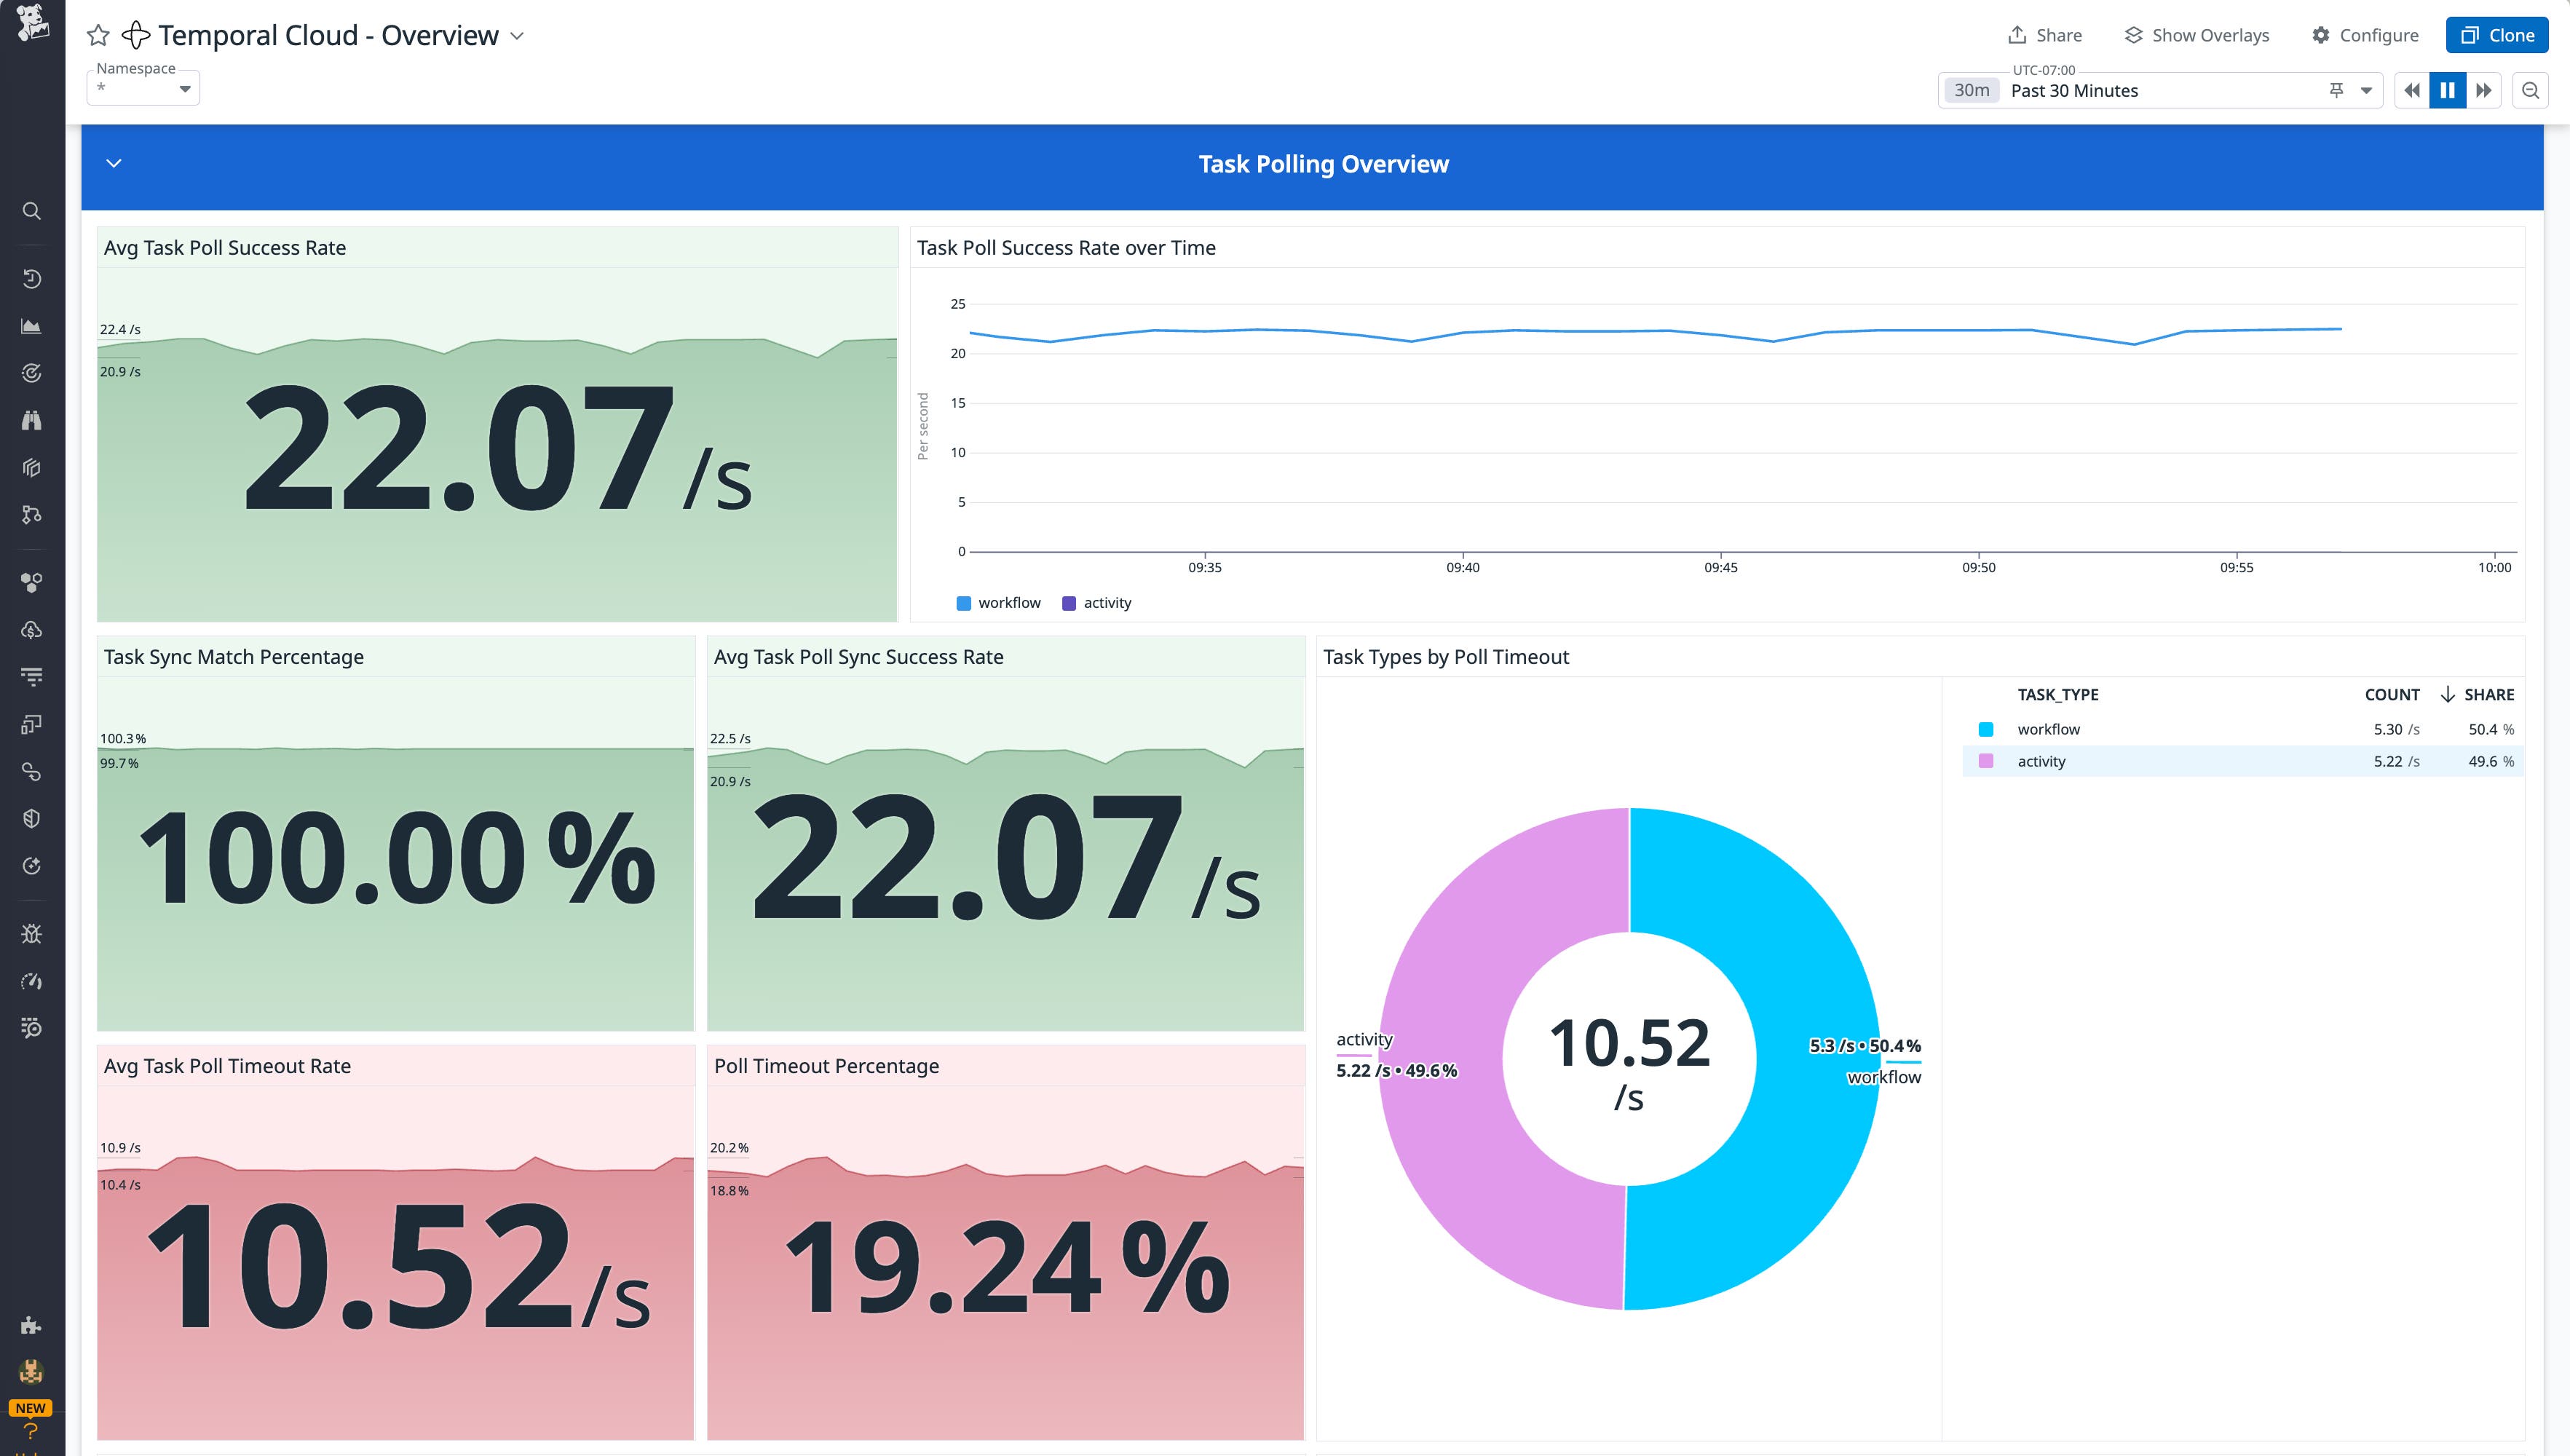
Temporal Cloud will manage the scaling of the Temporal Service—however, you’ll still need to manage your Worker pods and pollers. If you notice that the sync match percentage is consistently below this threshold, consider increasing the number of active Worker pods, increasing their respective number of task pollers, or adjusting the CPU and memory resources allocated to your pods.
Quickly identify errors in your Temporal Workflows
Temporal Workflows serve as the building blocks to Temporal’s programming model, and ensuring that your Workflows run smoothly is critical to maintaining the health of your applications. Datadog’s Temporal Cloud integration enables you to monitor the rate of different Workflow end states including cancellation, failures, termination, and more. While these end state metrics in the dashboard below may sound similar, they have very different meaning and implications. For example, cancellations are typically user-initiated and result in the Workflow exiting gracefully, while terminations forcefully kill the running processes without conducting standard cleanup operations, leaving your systems at risk of orphaned processes.
Monitoring these Workflow metrics not only notifies you when Workflows fail to complete successfully, but also helps you surface underlying issues with your Workflow definition code or your Workers’ provisioned resources. A high average Workflow failure rate indicates that during execution, your Workflows are encountering unhandled exceptions or improper error handling that are causing them to fail. This is usually an issue with your Workflow Definition and requires you to investigate and make changes to your Temporal code. On the other hand, high Workflow timeout rates can result from a few different reasons including an absence of active task pollers, unprovisioned Workers, or errors in your retry logic.
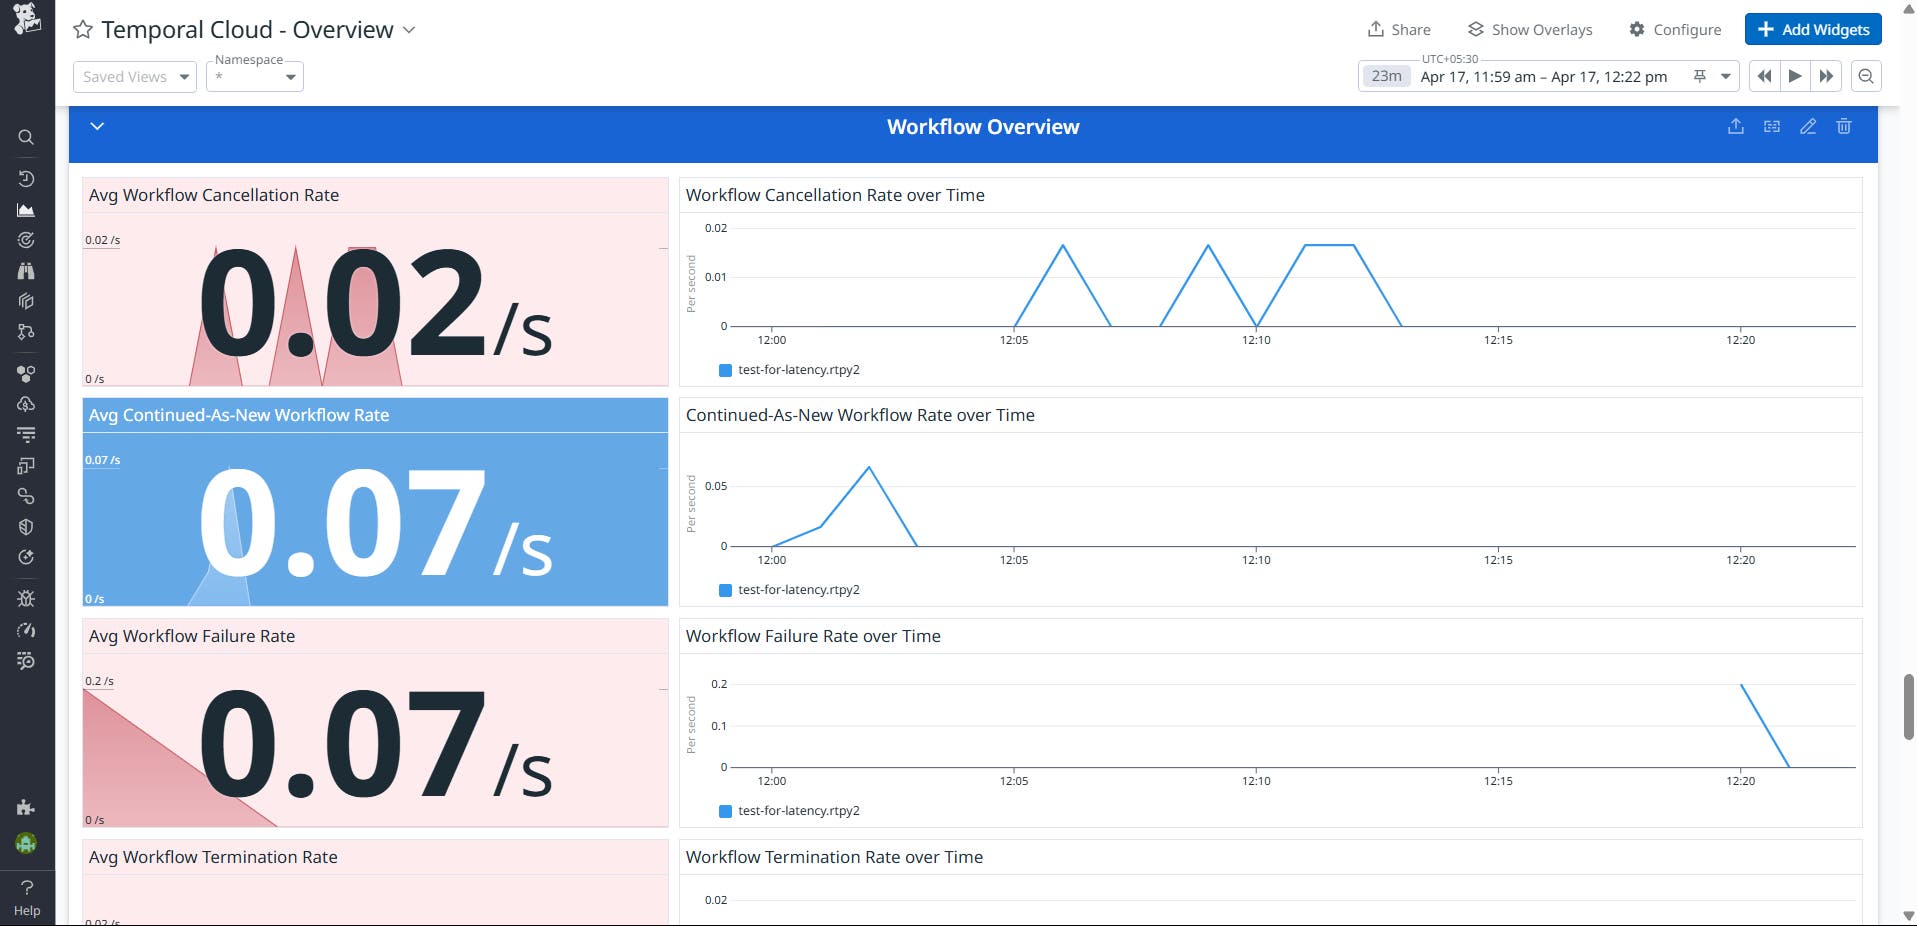
After you discover unusual Workflow activity using the dashboard, you can navigate to the Temporal Cloud UI to further troubleshoot. E.g., pending Workflow activity can indicate asynchronous matching issues, while pending tasks can indicate that your workers may not be polling the correct task queue or are too busy to be assigned new tasks.
Get started with Datadog
Datadog’s Temporal Cloud integration gives you granular visibility into your Temporal Workers, Workflows, and more to help you catch issues such as service latency spikes, failed Workflows, and inefficient task polling. If your organization self-hosts Temporal services, you can learn more about how to monitor your Temporal Server in this blog post.
To start monitoring your Temporal Cloud instances in Datadog, you’ll need to first generate a Metrics endpoint URL in Temporal Cloud and connect your Temporal Cloud account to Dataodg. Review our documentation for step-by-step instructions or for a comprehensive list of all of the Temporal Cloud metrics provided by our integration. If you don’t already have a Datadog account, sign up for a free 14-day trial today.


