Candace Shamieh

Jacob LeGrone
Temporal is an open source programming model that enables users to write and run scalable and reliable cloud applications. The Temporal Platform consists of a Temporal Cluster and Worker Processes, which together create a runtime for reentrant processes called Workflow Executions. Temporal’s workflows are resilient programs that execute tasks and react to external events, including timers and signals.
As an early adopter of Temporal ourselves, we’ve learned the intricacies of the platform and understand how to take advantage of all Temporal has to offer. One key to success is being able to view and analyze metrics and logs from all components of your Temporal Server in a centralized location. That’s why we are pleased to announce our new integration with the Temporal Server, a key component of the Temporal Cluster.
In this post, we’ll discuss how you can use our integration to:
- Visualize the health of your Temporal Server
- Configure our Temporal recommended monitors to receive insightful alert notifications
Visualize the health of every service in your Temporal Server
Once you’ve connected the Datadog Agent and configured the integration to begin collecting logs and metrics from your Temporal Server, you can use our out-of-the-box (OOTB) dashboard to view and analyze the health of your environment.
The Temporal Server includes four independently scalable services: frontend gateway for rate limiting, routing, and authorization, history subsystem to maintain data, matching subsystem to host Task Queues for dispatching, and Worker Service for internal background workflows. Each of these components emits hundreds of metrics and even more logs.
You can leverage the information in the OOTB dashboard to gain insight into the performance of these services with metrics such as sync match rate and average latency to investigate early if they’re less than ideal.
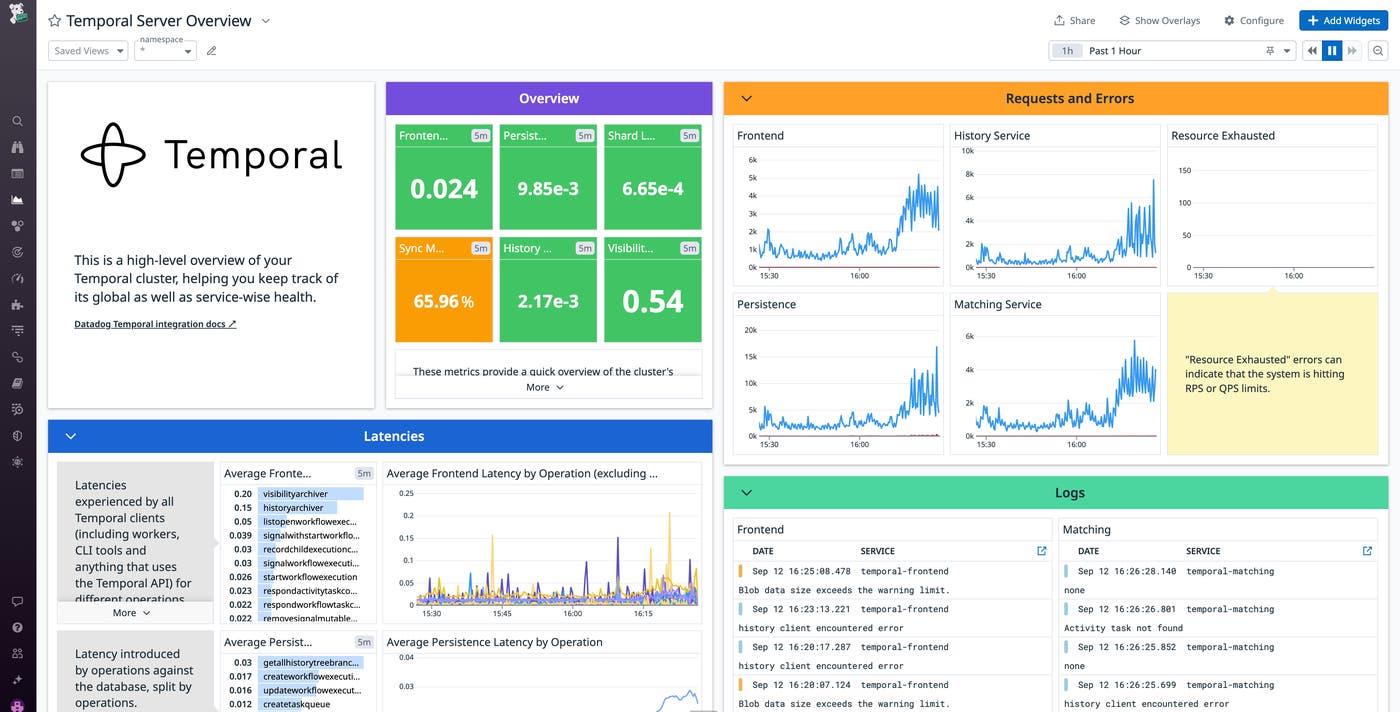
Let’s say you’re looking at the dashboard and notice that your average persistence latencies are too high and your sync match rate is low. For context, persistence latencies refer to the latencies introduced by operations against the database. Sync match rate measures the percentage of times that your Worker’s poller successfully receives work from your matching service’s memory. While investigating, you see that a number of created tasks failed to deliver synchronously to a poller, and while the tasks waited for a poller to become available, they were written to your database as backlog. You determine that this occurred because your Workers are underprovisioned and decide to take action to correct the issue.
Our OOTB dashboard also displays a detailed list of your Temporal Server logs, providing visibility into exceptions and warnings so you can intervene early and prevent an impact to production.
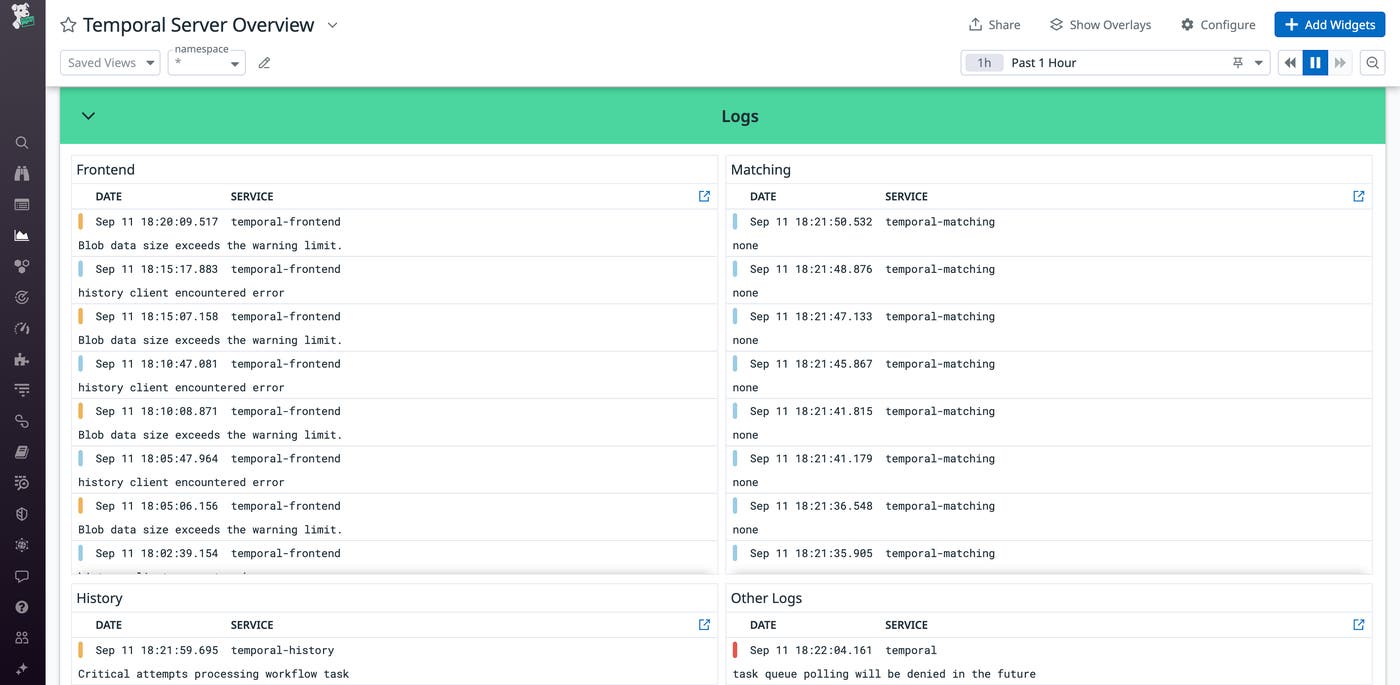
When applicable, the logs are divided into four categories: frontend gateway, history subsystem, matching subsystem, and other (Worker Service). The granularity that these categories provide makes it easier for you to know where to start investigations and allows you to quickly identify whether a recent change or deployment is impacting the performance of multiple services. For example, if you’ve deployed each of your Temporal services in a separate pod in a Kubernetes cluster, our OOTB dashboard conveniently provides the information that you need to get an accurate depiction of overall cluster health.
If you’d like to get a more detailed and holistic picture of your Temporal Cluster, which includes your Apache Cassandra, MySQL, Elasticsearch, or PostgreSQL database, you can install those individual integrations in Datadog and start collecting metrics and logs from those sources, too. For example, if you see that the metric temporal.server.persistence.errors.count shows that a high amount of Temporal Persistence database requests have returned an error, you can easily pivot to our MySQL OOTB dashboard to continue your investigation.
Receive insightful alerts from our Temporal recommended monitors
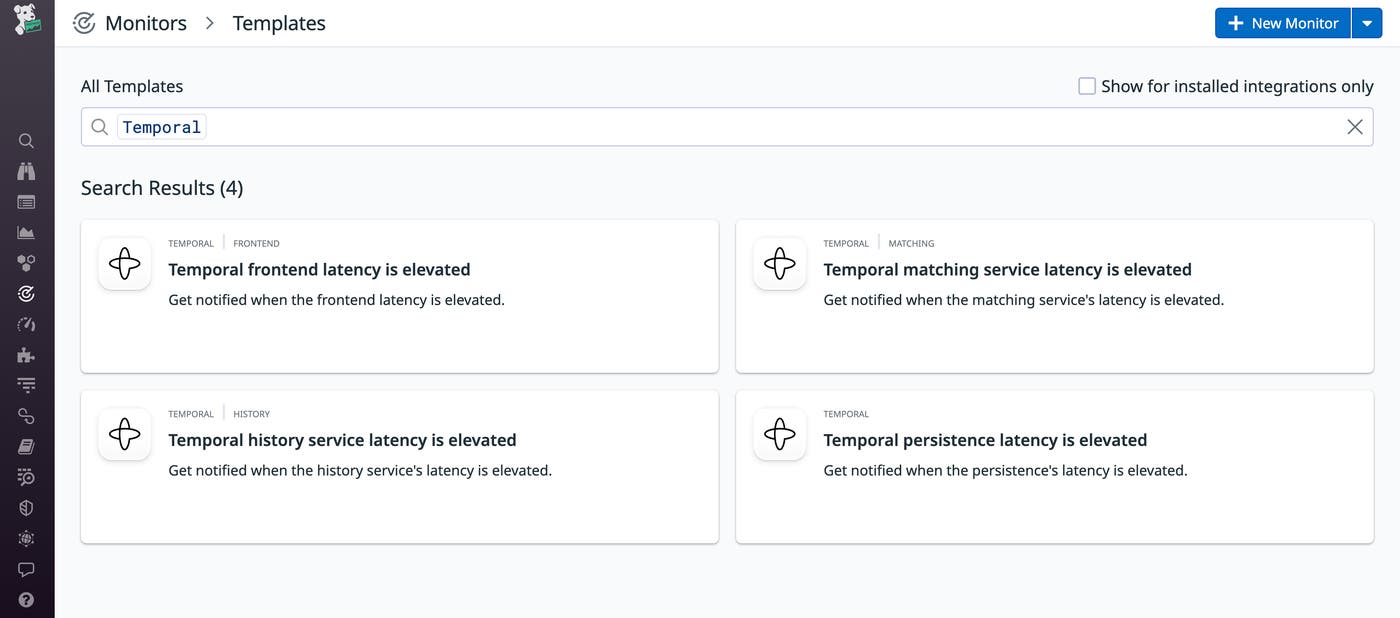
Our Temporal integration also includes four preconfigured monitors that will alert you when it detects performance issues. Once enabled, the Temporal monitors will send you insightful alert notifications about your Temporal Server, helping you to maintain a healthy, secure environment.
Our Temporal recommended metric monitors will notify you if frontend, matching, history, or persistence latency is elevated. You can also clone our OOTB Temporal dashboard to make it your own and edit however you’d like. For example, you can add a Monitor Summary widget to your cloned dashboard so that you can view all aspects of your Temporal environment in one convenient location.
Gain efficiency with our Temporal integration
Monitoring your Temporal Server with our integration allows you to quickly identify and resolve issues, maintain optimal Worker performance, and enhance your security strategy. You’ll have a convenient way to visualize each component of your Temporal Server with our OOTB dashboard, and our recommended monitors will help you verify the reliability and efficiency of your workflows.
You can find a comprehensive list of metrics and configuration instructions in our Temporal documentation. If you don’t already have a Datadog account, you can sign up for a 14-day free trial today.


