Paul Gottschling
Cloud Foundry is an open source deployment and orchestration platform that gives developers a readymade workflow for launching applications without configuring the underlying infrastructure. VMware Tanzu Application Service (TAS) is a commercially available certified platform for Cloud Foundry that provides complementary products like a partner network, auto-scaling CLI, and operations interface, and is used by enterprise-level customers like T-Mobile, The Home Depot, and Comcast.
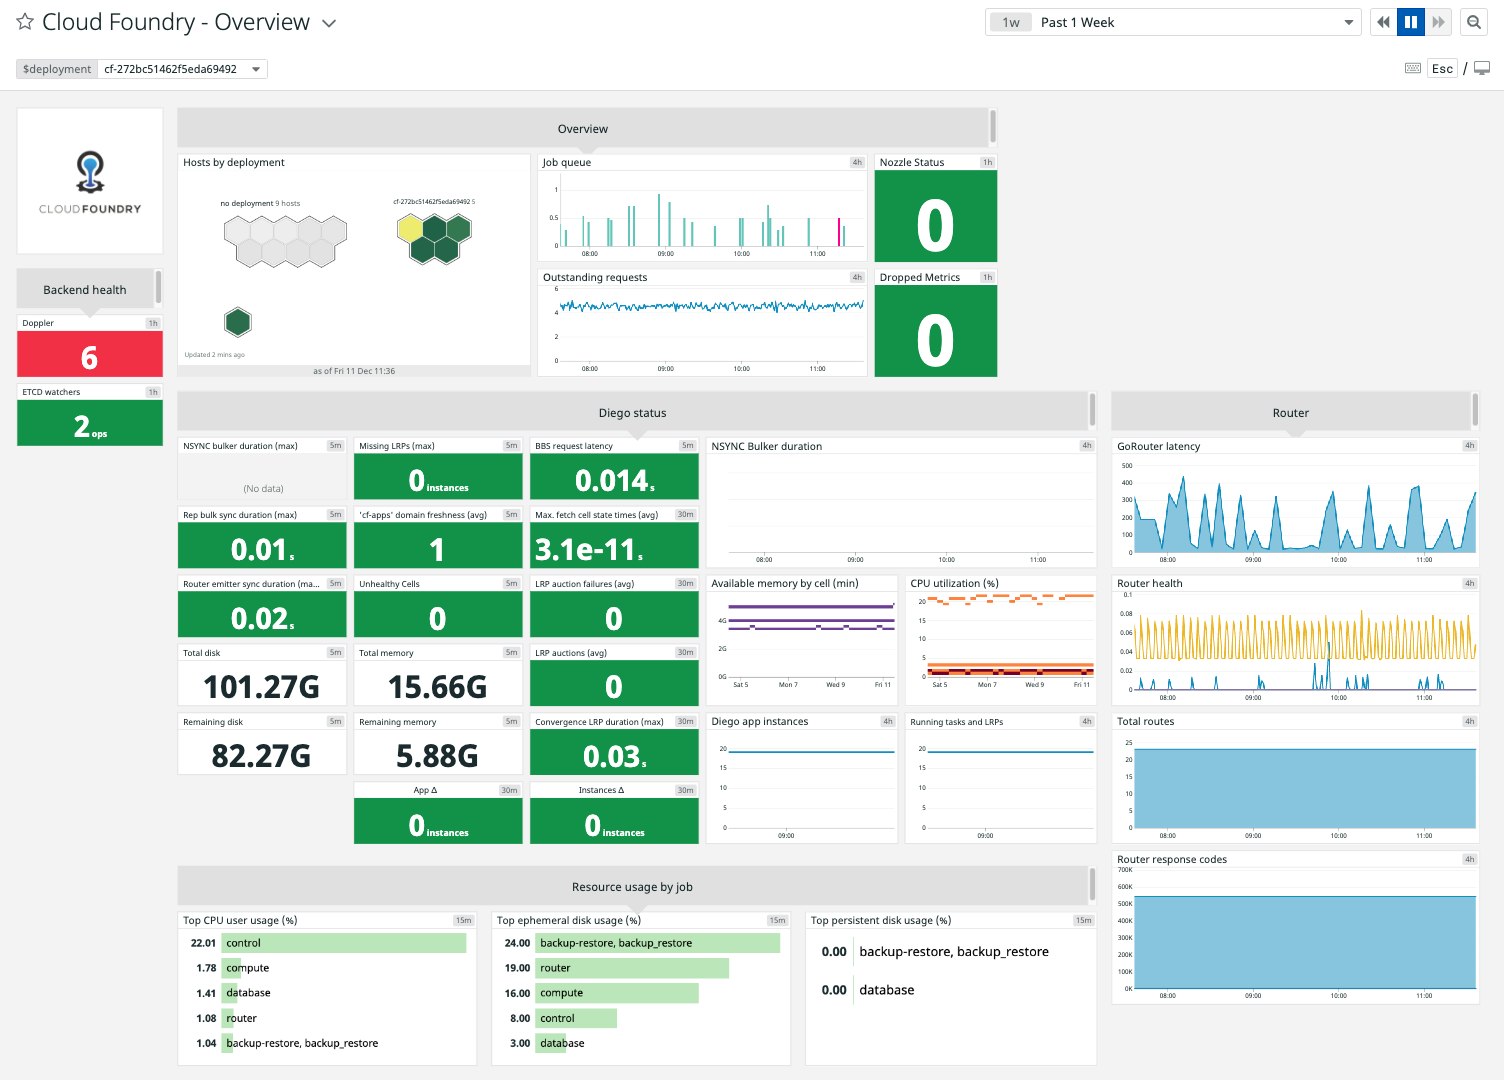
Datadog’s integration works on all distributions of Cloud Foundry, and you can easily install it within your Tanzu Application Service clusters using the Datadog Cluster Monitoring tile. The integration gives you comprehensive visibility into the virtual machines running on your TAS deployment and, since version 4.1.1 of the Datadog Cluster Monitoring Tile, can help you:
- Automatically track container-level health, performance, and resource utilization
- Monitor applications running on your TAS deployment with minimal configuration
- Collect Cloud Foundry audit events so you can correlate them with infrastructure and application metrics

Track VMware Tanzu Application Service containers in real time
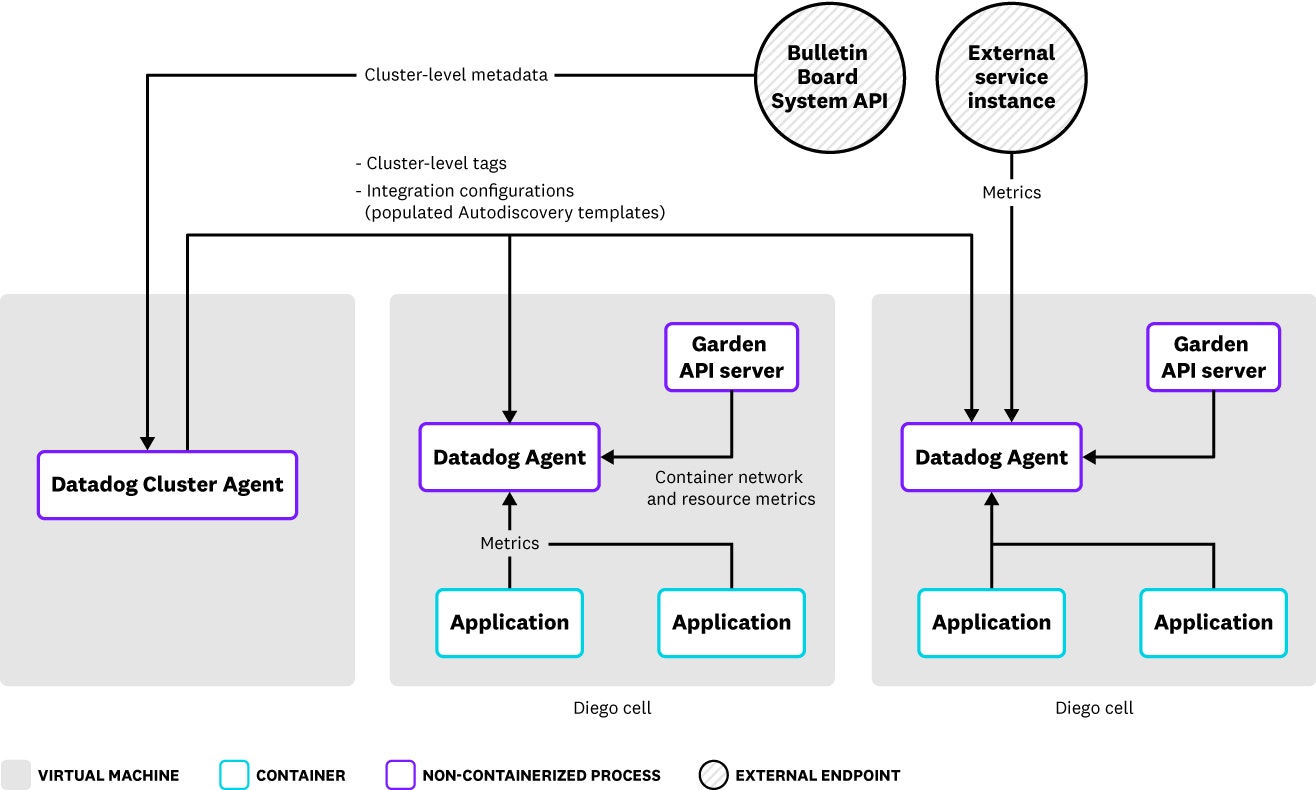
Cloud Foundry’s scheduler, Diego, stores metadata such as the desired and current state of all running containers within the Bulletin Board System (BBS). Datadog monitors your TAS deployment while minimizing demand on the BBS by automatically deploying a combination of a Datadog Cluster Agent and a fleet of Datadog Agents, one per virtual machine in your cluster. (Datadog deployments on Kubernetes use a similar architecture.) The Datadog Cluster Agent queries the BBS for the state of your applications on behalf of the instance-level Agents, then sends tags and configurations to VM-based Agents. This means that only the Cluster Agent needs to communicate with the BBS.

While it can be challenging to track ephemeral containers across Cloud Foundry’s dynamic environment, Datadog’s Cloud Foundry integration helps ensure that your workloads are performing as intended by automatically gathering resource metrics from application containers running on your TAS deployment. Cloud Foundry deployments manage containers through a component called Garden. Instance-level Agents gather resource utilization and network throughput for each container running in your TAS deployment by querying their local Garden API server and submitting these metrics to Datadog.

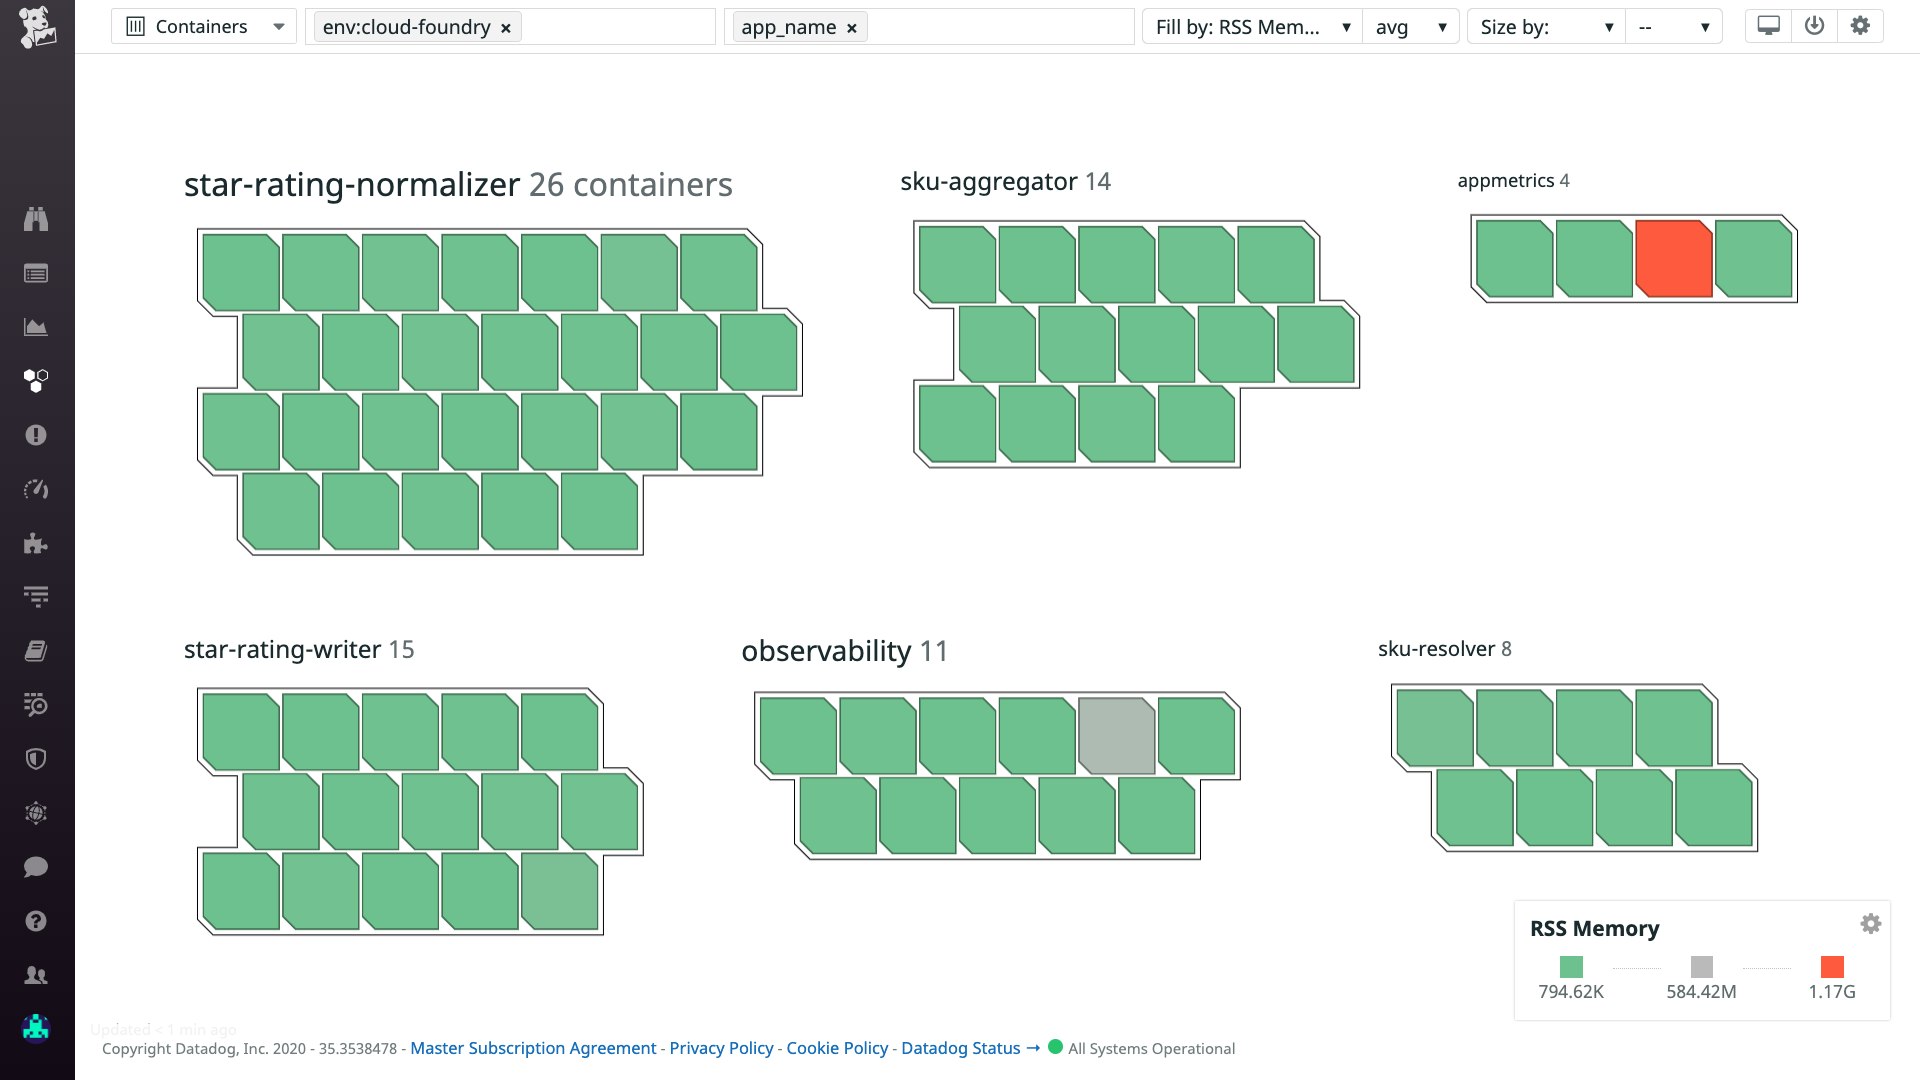
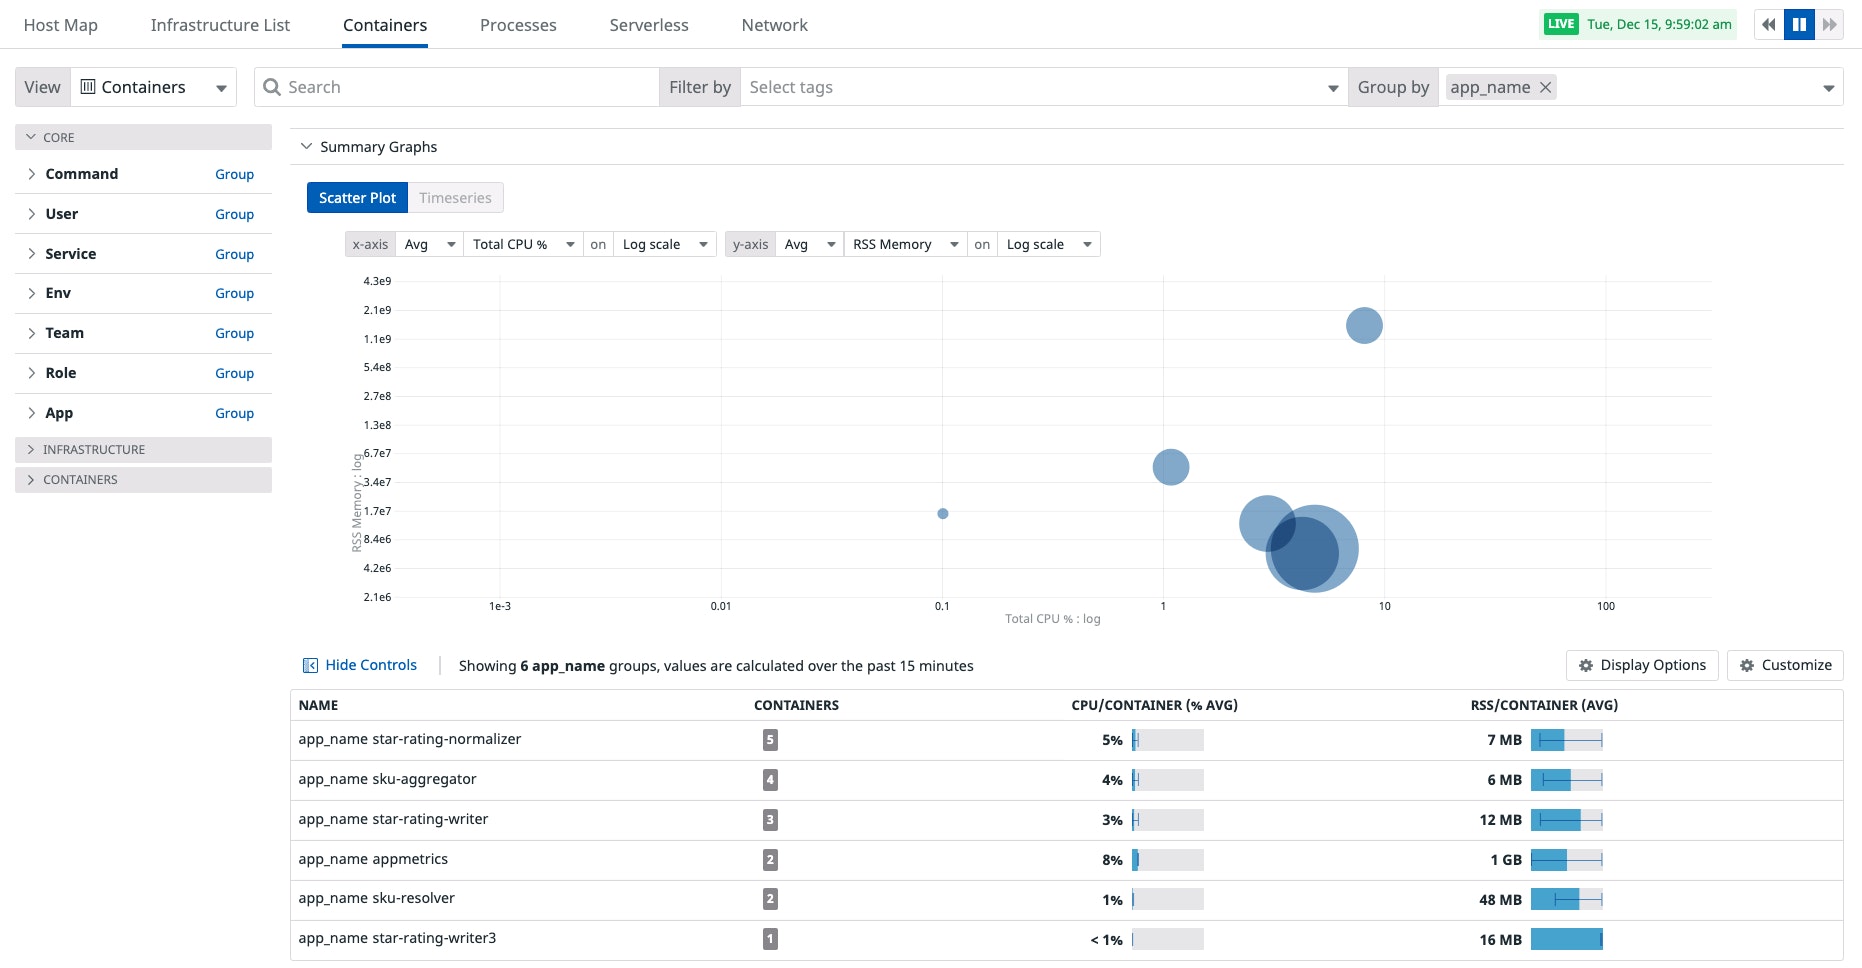
You can use the tagged metrics from your TAS applications to localize possible issues within your cluster. Cloud Foundry tags like container_name and app_name help you group and filter container maps to get quick insights into how the value of a metric varies across your cluster, letting you know if an issue is widespread or just beginning to bubble up. (You can also use reserved tags, such as env and service.) You can then use the Live Container view to get real-time data on resource utilization in your application containers.

Monitor VMware Tanzu Application Service with minimal configuration
Using the Datadog Cluster Agent, developers can get the same frictionless experience of monitoring their applications as they do deploying them to TAS, with no need for knowledge about the underlying infrastructure. This is because the Cluster Agent uses Autodiscovery to enable integrations for all containers running your TAS applications—and all external service instances—by populating configuration templates with up-to-date information and sending the resulting configuration files to VM-based Datadog Agents. Just run each application you deploy on TAS with the AD_DATADOGHQ_COM environment variable assigned to a JSON document that contains your integration configuration.
Analyze audit events to troubleshoot issues

TAS is bundled with Cloud Foundry’s Cloud Controller API, which emits audit events throughout the lifecycles of your applications: when they are created, when they terminate, and when users attempt to access them. The Datadog Agent collects audit events so you can easily correlate trends in a metric with changes in your applications. You can overlay events atop graphs for Cloud Foundry control plane metrics (e.g., for Diego) as well as metrics from applications running on TAS. You can then share these graphs with colleagues—or even declare an incident—to reduce the time it takes to investigate issues in your TAS deployment.
You can also create alerts on high numbers of Cloud Foundry audit events, such as crashed application processes (audit.app.process.crash) or failed SSH attempts (audit.app.ssh-unauthorized), and configure Datadog to notify your team. You can then inspect individual event messages to get readymade leads for your investigations.
Tanzu Application Service, inside and out
Datadog’s integration with TAS means that you can get full visibility into the VMs hosting your TAS deployment as well as the containers running your application instances. And with over 1,000 other integrations, the Datadog Agent can give you insight into nearly every application you have deployed via TAS. To see how Datadog can help you monitor your Tanzu Application Service deployment, sign up for a free trial.


