Abril Loya McCloud
Lighttpd is an open source web server known for its flexibility and speed. It has a relatively low memory footprint as well as small CPU load in comparison to other web servers while remaining secure and compliant with web standards. Lighttpd also provides support for CGI applications written in any language.
Monitoring Lighttpd’s performance presents many of the same challenges presented by other web servers. However, features like Lighttpd’s small CPU load make it easy to establish baselines to help you ensure your web server is performing optimally. Datadog integrates with Lighttpd to help you keep an eye not only on Lighttpd’s CPU load, but other key metrics like memory usage and uptime, which you can analyze and correlate with performance metrics from the rest of your infrastructure.
Shedding light on Lighttpd
With Datadog’s Lighttpd integration you can visualize and alert on metrics from your web server and be notified of issues before they affect your users. Monitoring your web server over time is key to minimizing both lag and downtime, as well as troubleshooting when these issues occur. Once you’ve configured the Lighttpd integration, the Datadog Agent will automatically begin to collect your metrics and display them in a screenboard like the one below.

All your metrics in one place
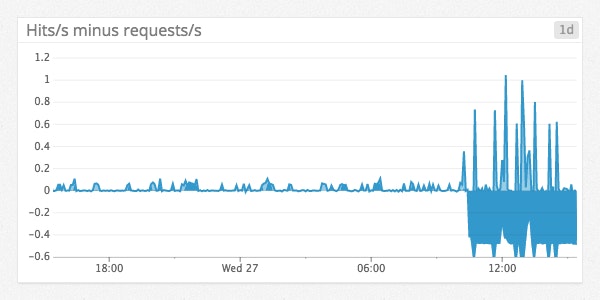
Monitoring general metrics like uptime and memory usage can give you a good idea of Lighttpd’s health, at a glance. The out-of-the-box dashboard also features other useful metrics like number of requests, network traffic, and the difference between hits/s and requests/s. These two metrics in particular can be helpful in identifying performance issues in your web applications.

In the graph above, you can see significant spikes in the graph displaying the difference between hit/s (total number of requests) and requests/s (number of fulfilled requests). These spikes show that response times for requests are lagging, an issue that you can quickly troubleshoot by correlating your Lighttpd metrics with underlying system metrics or other data from your infrastructure.
The Datadog Agent collects the following metrics from your Lighttpd servers:
| Metric name | Description |
|---|---|
lighttpd.performance.busy_servers | Number of active worker threads per server. |
lighttpd.performance.idle_servers | Number of idle worker threads per server. |
lighttpd.performance.uptime | The amount of time the server has been up and running in seconds. |
lighttpd.net.bytes | Total number of read and written bytes since start. |
lighttpd.net.bytes_per_s | Number of read and written bytes/s. |
lighttpd.net.hits | Total number of requests received since start. |
lighttpd.net.request_per_s | Number of fulfilled requests per second. |
In addition to visualizing your metrics, you can also set up custom alerts to notify you in case of unexpected increases or decreases in Lighttpd’s memory usage, hits, requests, and more.
Let there be Light-tpd!
If you’re already a Datadog customer, setting up the Lighttpd integration only takes a few minutes. Once you’ve configured the integration, the Agent will automatically begin collecting your metrics. If you’re new to Datadog, you can sign up for a 14-day trial to begin monitoring your Lighttpd servers along with metrics from the rest of your infrastructure.


