Julien Balestra

Emily Chang
Datadog operates large-scale Kubernetes clusters in production across multiple clouds. Along the way, audit logs have been extremely helpful for tracking user interactions with the API server , debugging issues, and getting clarity into our workloads.
In this post, we’ll show you how to leverage the power of Kubernetes audit logs to get deep insight into your clusters. We will cover:
- What are Kubernetes audit logs?
- Why should you monitor audit logs?
- How to configure Kubernetes audit log collection
- Monitoring Kubernetes audit logs with Datadog
We also presented this topic at KubeCon North America 2019—you can watch the talk here.
What are Kubernetes audit logs?
Audit logs record requests to the Kubernetes API. Because the API server processes all changes to Kubernetes state—and serves as the gatekeeper to the backend database that stores this state—the API server is an ideal point for capturing all changes that occur within a cluster. The API server processes requests from various internal and external components, including:
- The control plane (built-in controllers, the scheduler)
- Node daemons (the kubelet, kube-proxy, and others)
- Cluster services (e.g., the cluster autoscaler, kube-state-metrics, CoreDNS, etc.)
- Users making
kubectlrequests - Applications, controllers, and operators that send requests through a kube client
- Even the API server itself
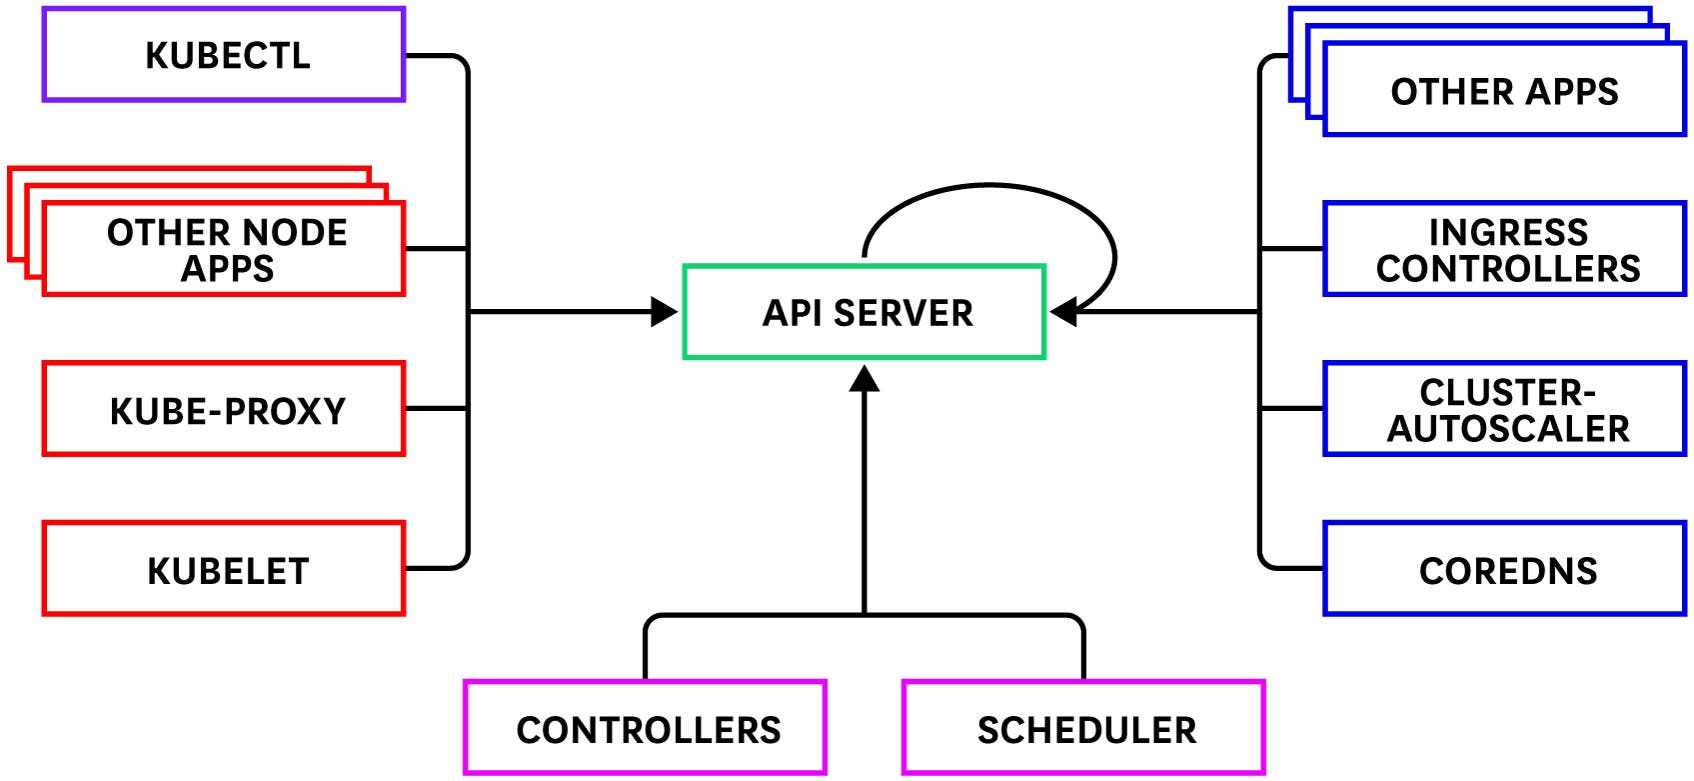
Audit logs help keep tabs on all of this complexity by recording which users or services requested access to cluster resources—and why the API server authorized or rejected those requests.
Audit logs are structured in JSON. Each log contains rich metadata in the form of key attributes like the HTTP method, the URL path requested, and the user who sent the request. For instance, you can inspect these attributes to obtain more information about an unusual request, or use a monitoring service to analyze API traffic to detect trends or identify possible threats.
Why should you monitor Kubernetes audit logs?
Although Kubernetes audit logs are not enabled by default, we recommend leveraging this feature to debug issues in your cluster. Kubernetes events are key to understanding the behavior of a cluster. By default events are stored in the Kubernetes backend database, etcd, with only one hour of retention. Audit logs allow you to capture events, create/read/update/delete actions, and even the heartbeats sent from the nodes to the API server.
By persisting audit logs to longer term storage, it’s possible to go back in time and answer questions such as, “Why was this pod evicted?” and “What lifecycle operations occur when we update a deployment?”
You can also set up automated alerts to keep tabs on any unexpected activity in your Kubernetes audit logs, such as create/update/patch/delete requests during an operational freeze period. Below, we’ll walk through some examples of using audit logs to monitor:
Monitor API authentication issues
When the Kubernetes API receives a request, it authorizes (or denies) it by using the configured authorization module (e.g., role-based access control, or RBAC) to verify that the user has the necessary permissions to perform the requested operations (list, watch, delete, etc.) on the specified resources.
Let’s take a closer look at an audit log generated for a simple kubectl get pods request. In the example below, a user (bits@example.com) sent a list request to the pods resource (e.g., kubectl get pods) from the datadog namespace.
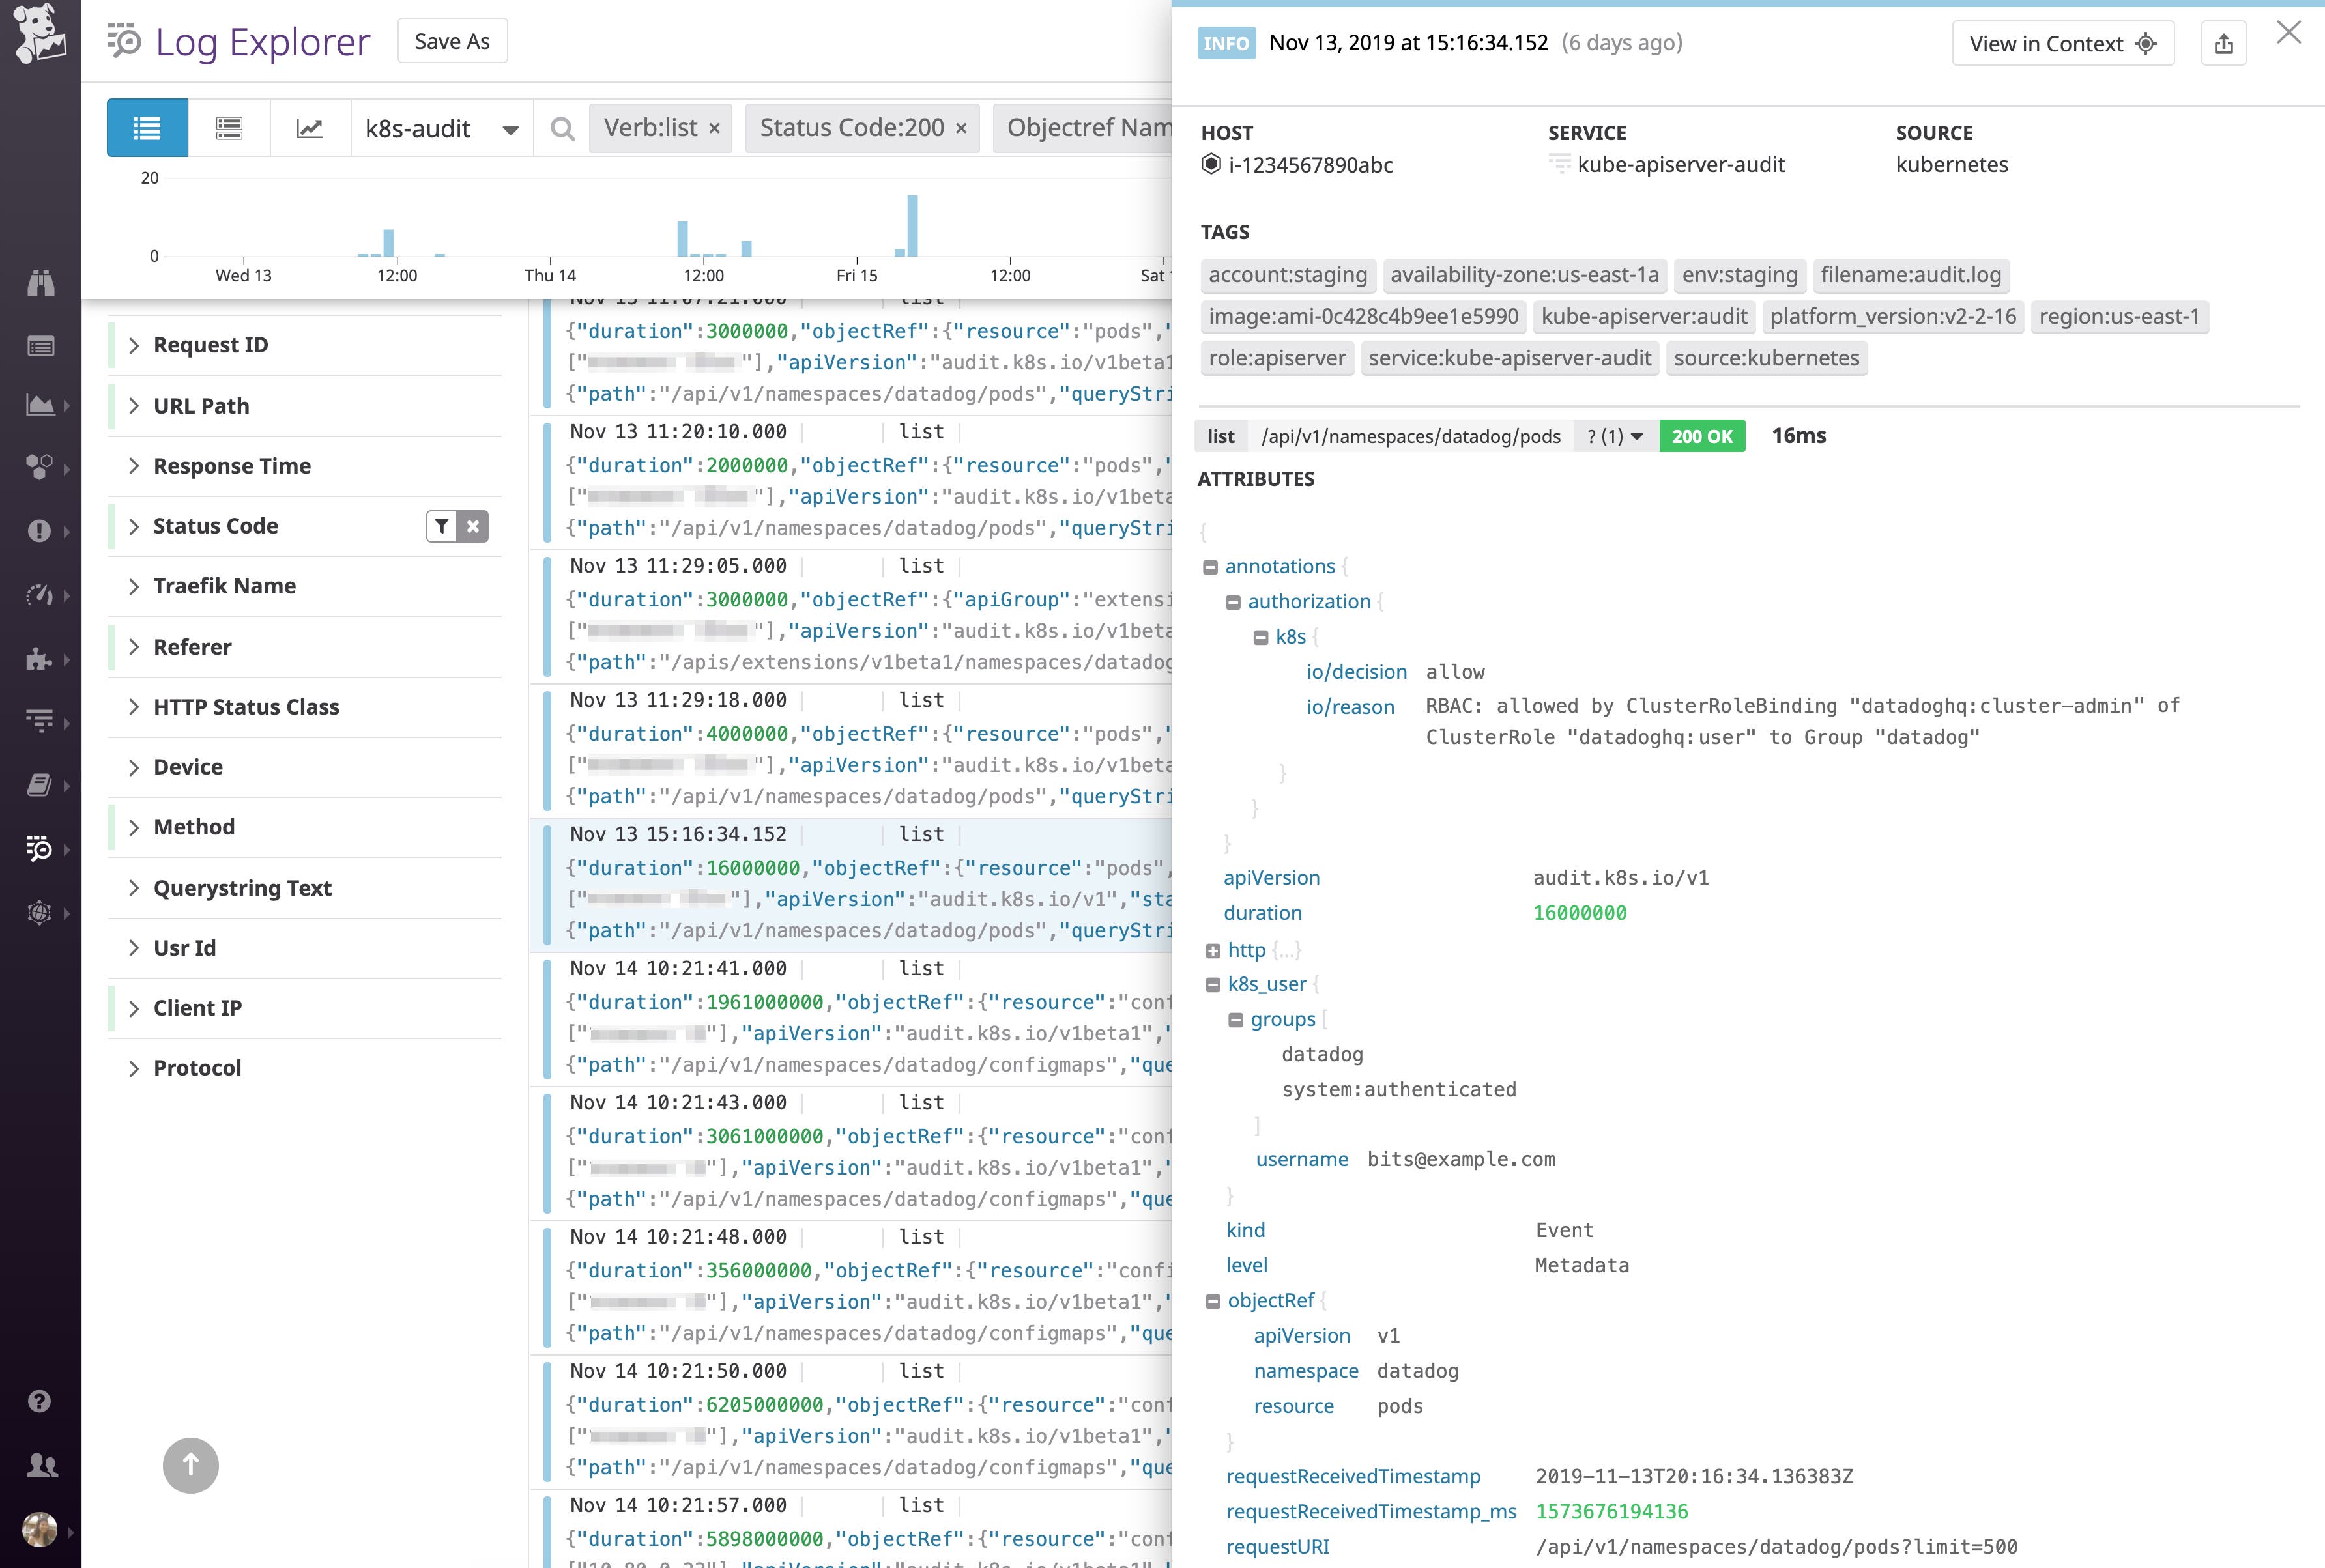
As of version 1.11, Kubernetes audit logs include two annotations that indicate whether or not a request was authorized (authorization.k8s.io/decision) and the reason for the decision (authorization.k8s.io/reason). According to these annotations, this request was authorized because the user belonged to the datadog group, which is bound to a ClusterRole (datadoghq:user) that has the necessary RBAC permissions to perform the specified action (list) on this resource.
At Datadog, we set up monitors to detect spikes in 403 Forbidden and 401 Unauthorized response codes in our audit logs, as well as anonymous calls to the API server (which we’ll explore in more detail later in this post).
403 Forbidden
Earlier, we saw an example of a successfully authenticated request to the API server. In other cases, the API server will enforce access policies by denying requests—for instance, if it determines that the user is not authorized to complete the requested action. The Kubernetes API server issues a 403 Forbidden response when a client tries to perform an action on a cluster resource without the proper permissions. You can set up a monitor to automatically alert you about an uptick in 403 Forbidden responses, and then use attributes like host, sourceIPs, and k8s_user.username to find out where those requests are coming from.
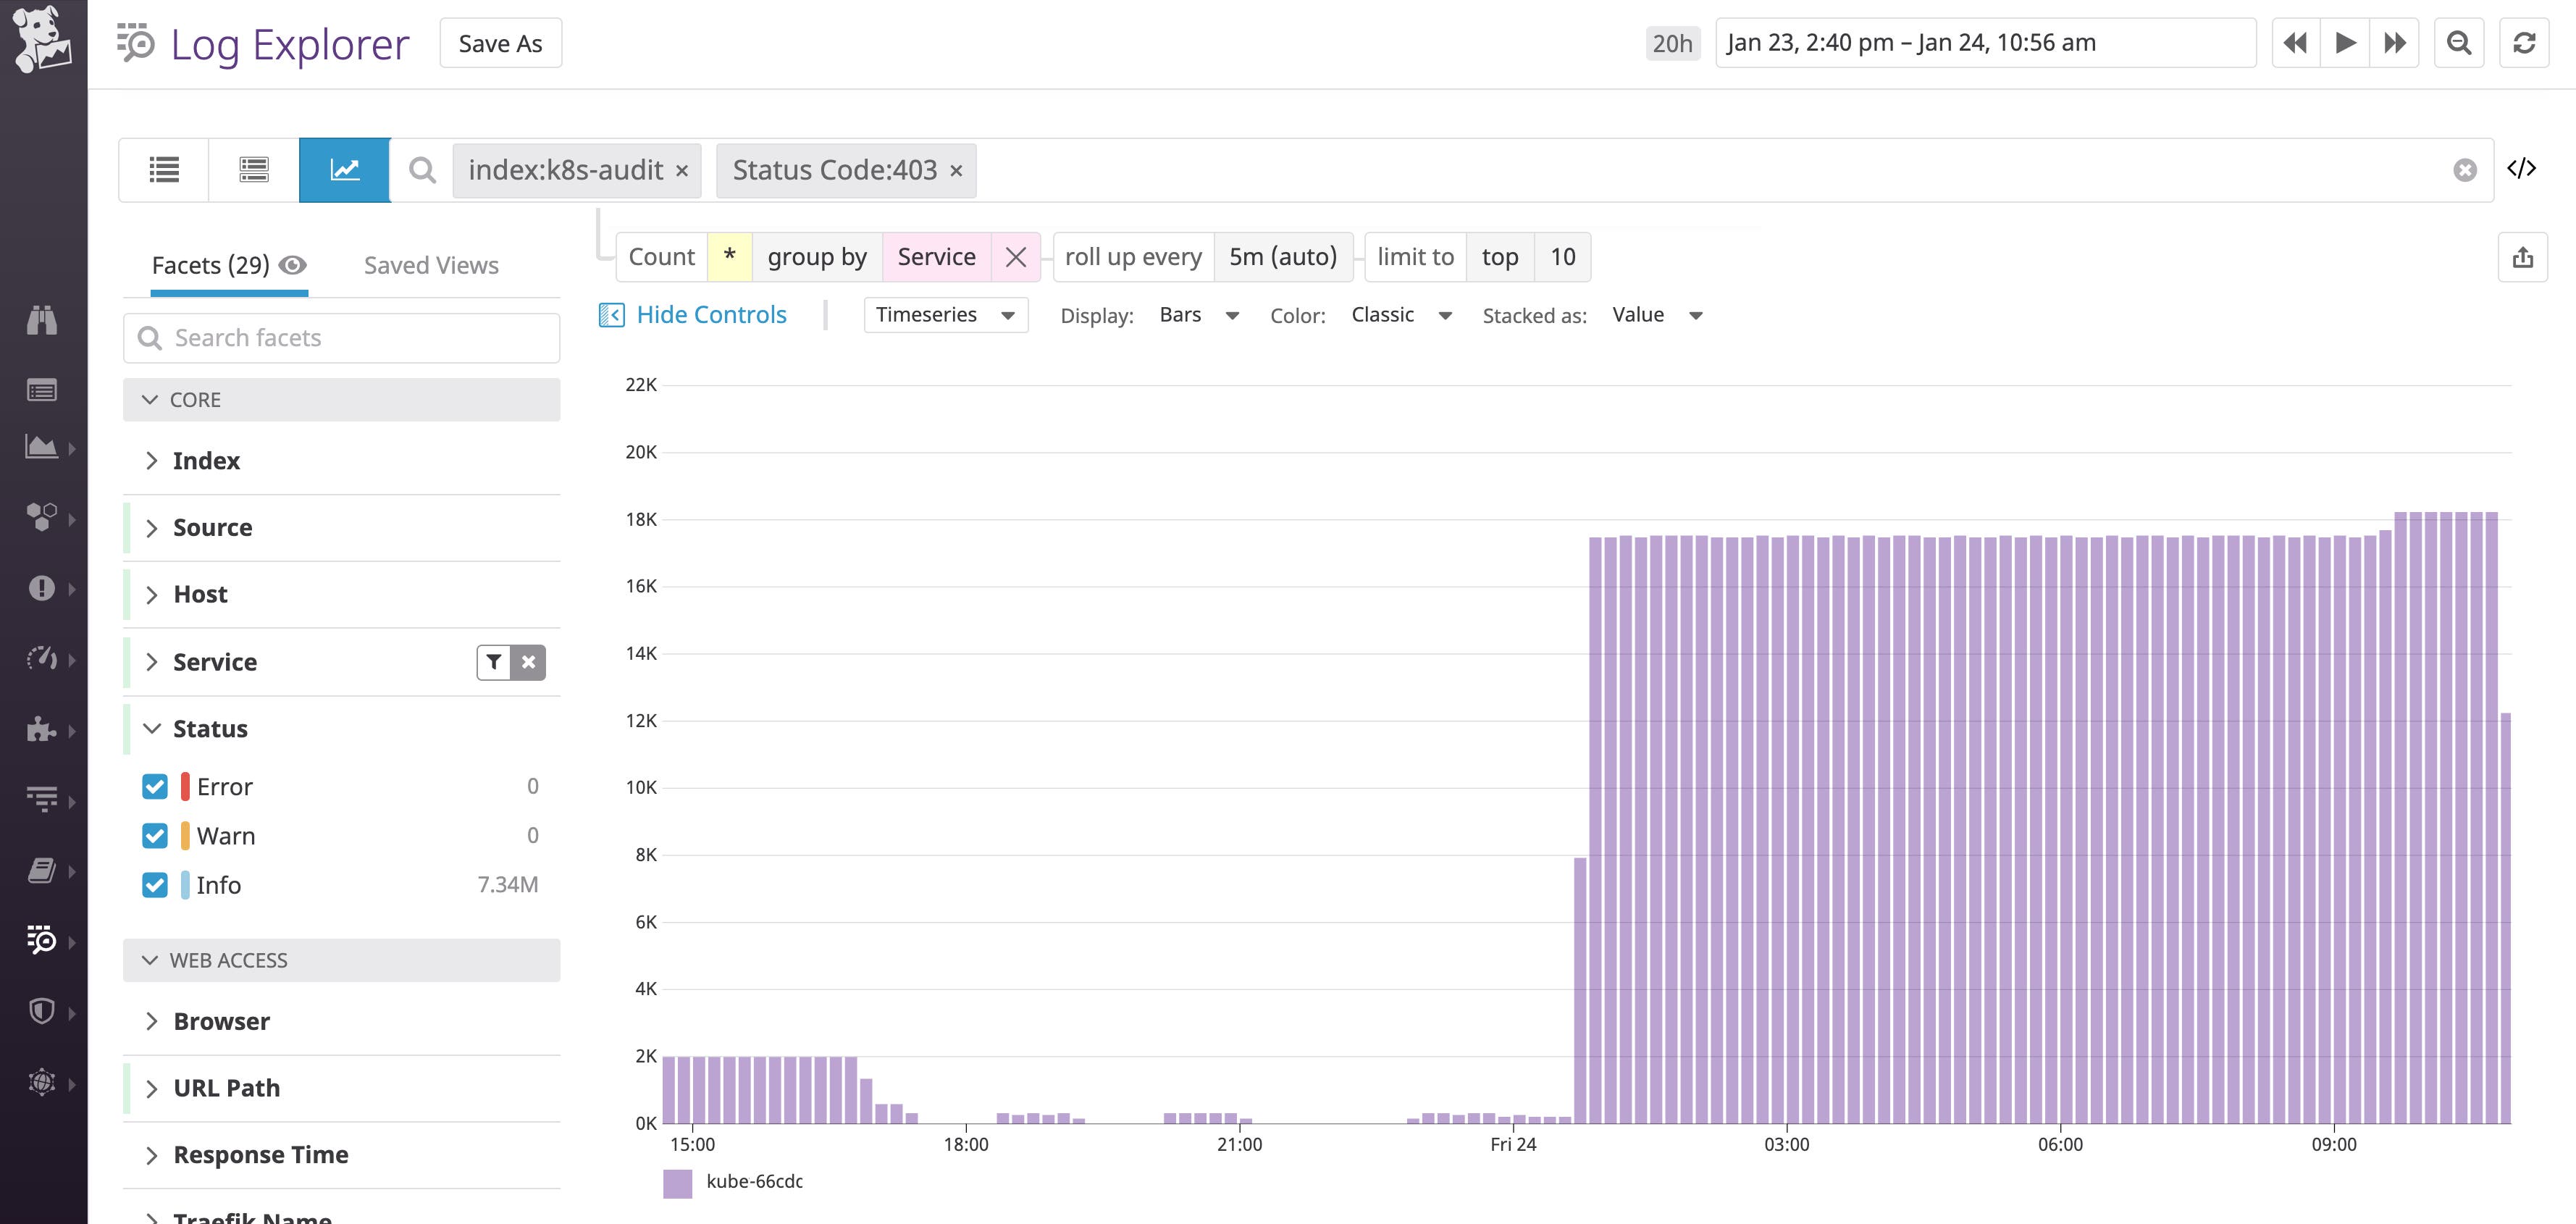
An increased rate or 403 responses in audit logs can point to misconfigured RBAC policies. By monitoring these logs, you can ensure that legitimate users and services are able to access the resources they need. These logs can also help detect other types of issues that warrant investigation. For example, unusual API calls—such as a pod requesting information about a user’s permissions—that lead to 403 responses may point at a hacker probing for privileges to exploit.
401 Unauthorized
If the API server receives a request from a user or service account that cannot be authenticated (i.e., through client certificates, tokens, etc.), it responds 401 Unauthorized. You can monitor these audit logs to identify authentication issues (e.g., expired certificates or malformed tokens).
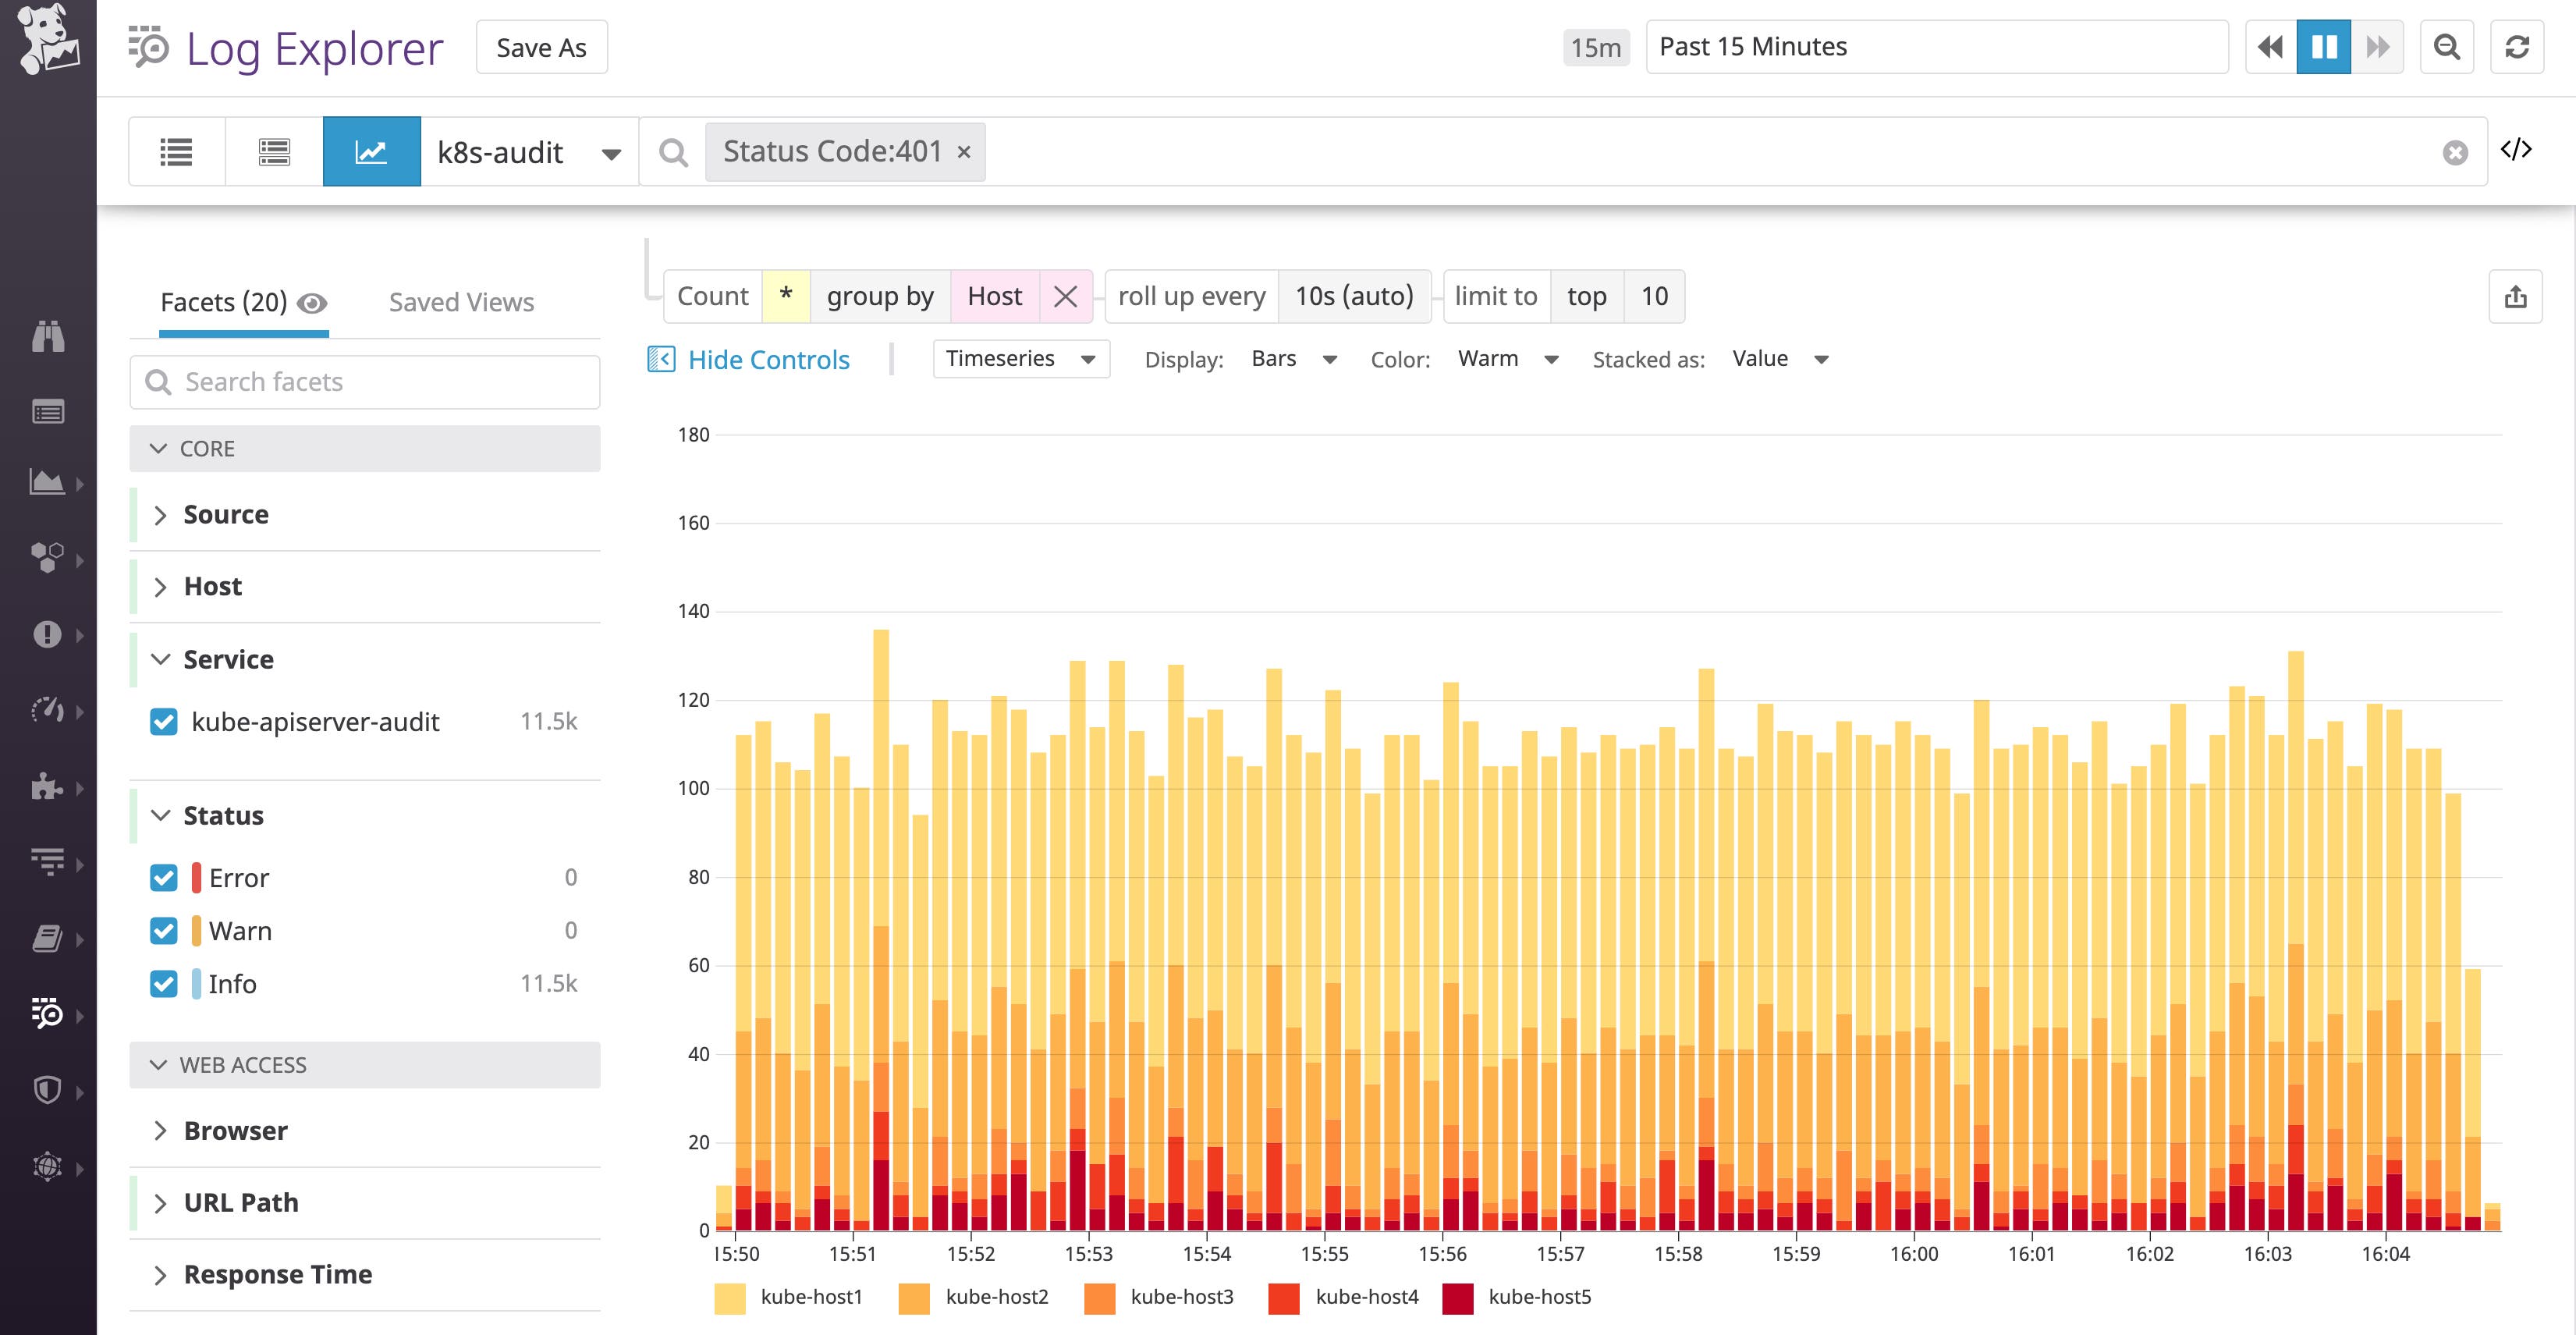
For example, at Datadog, we received a notification for a sharp rise in 401 responses. When we grouped the 401 audit logs by host, like in the graph below, we were able to view the specific nodes the requests were coming from. Upon inspecting the logs, we determined that the nodes’ kubelets were trying to connect to the API server with expired certificates, pointing to a problem with the certificate renewal process.
Audit logs allow you to pinpoint these types of authentication issues to ensure users and services have access to the resources they need, and verify that your RBAC policies are otherwise properly configured.
Monitor slow API requests
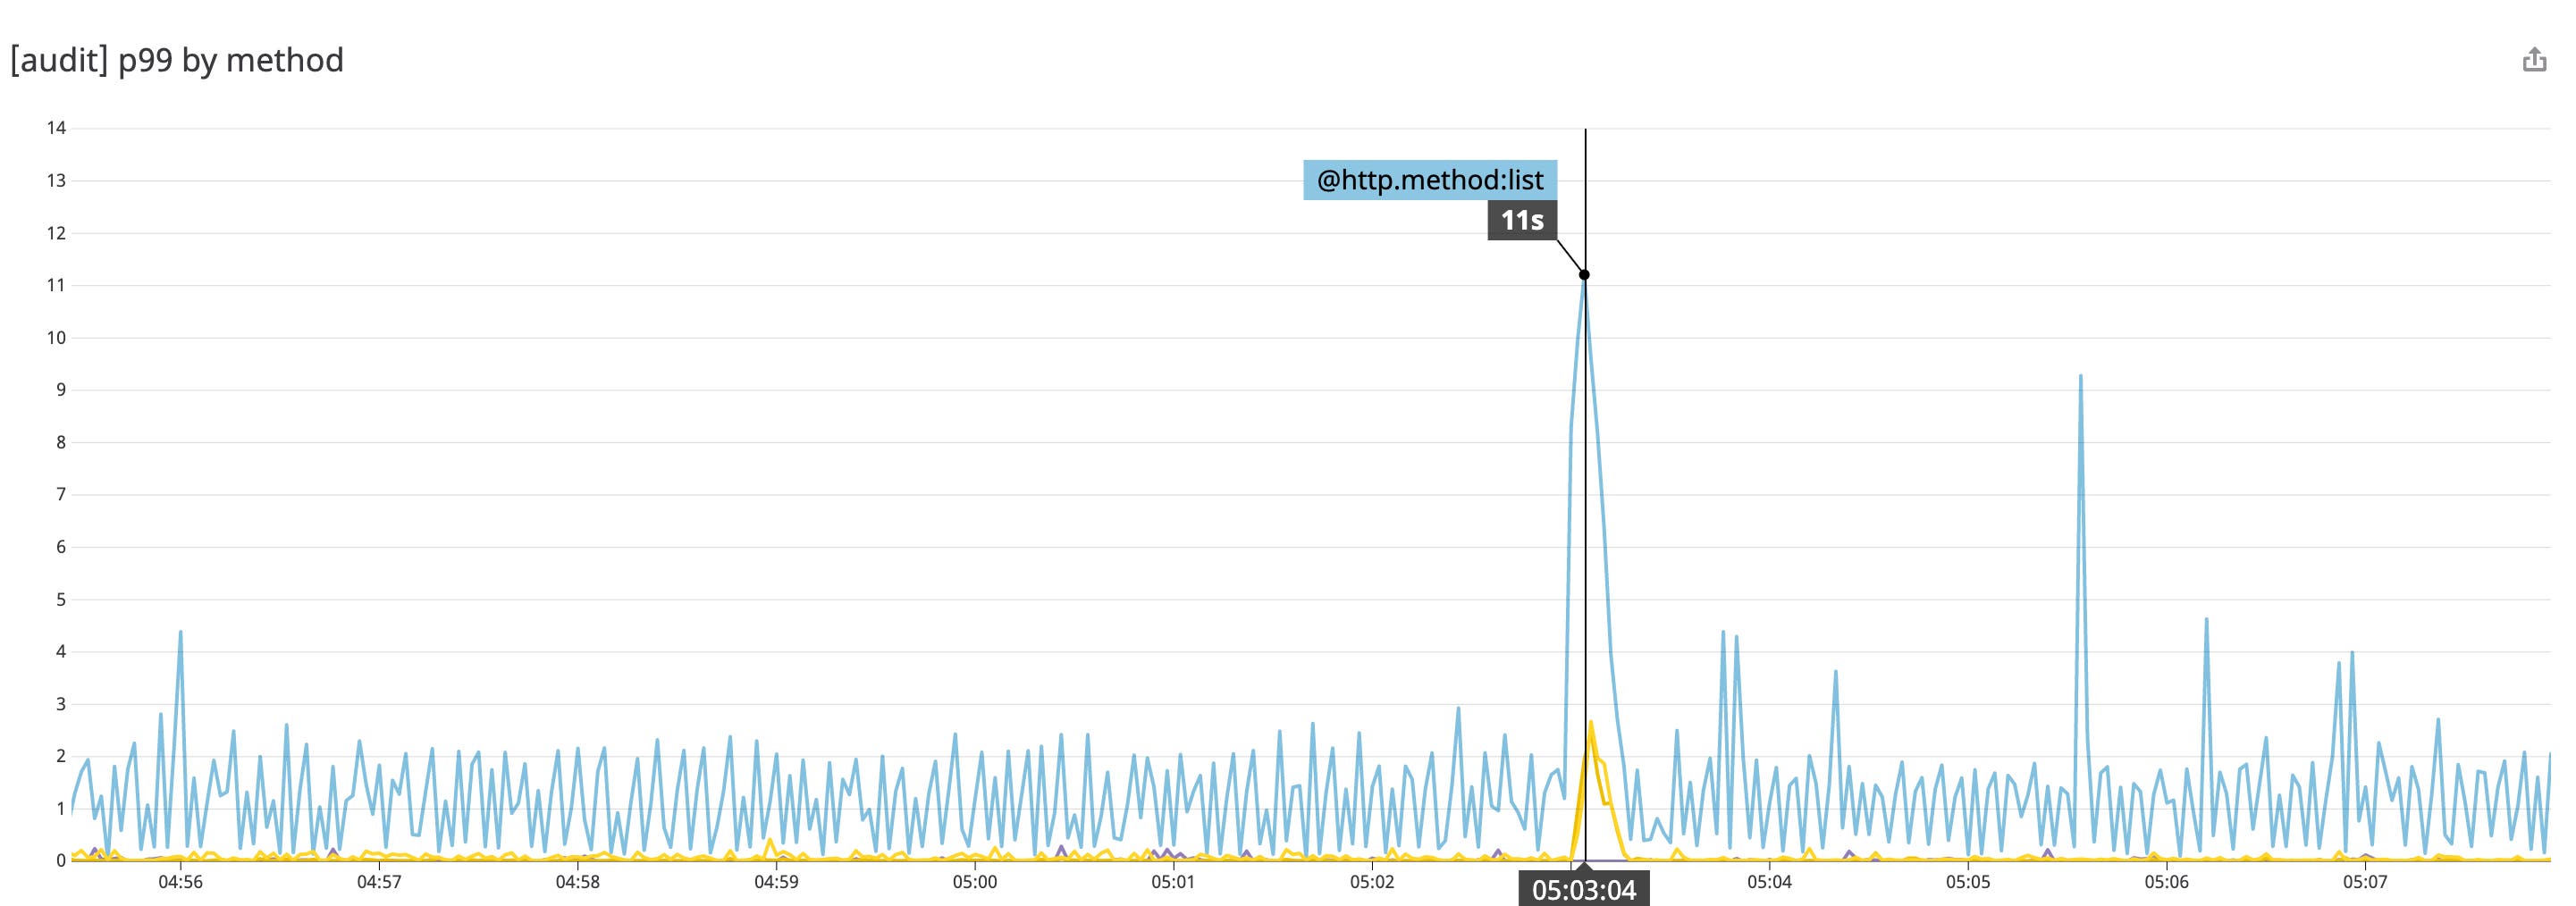
Since the API is central to cluster operations, slow API calls are likely to snowball into performance problems elsewhere in your cluster. Datadog’s log processing pipeline automatically calculates the latency of API calls—including percentile values—so you can visualize trends over time. Below, we’ve plotted the 99th-percentile latency of API calls per HTTP method. The graph indicates the duration of list calls spiked recently.
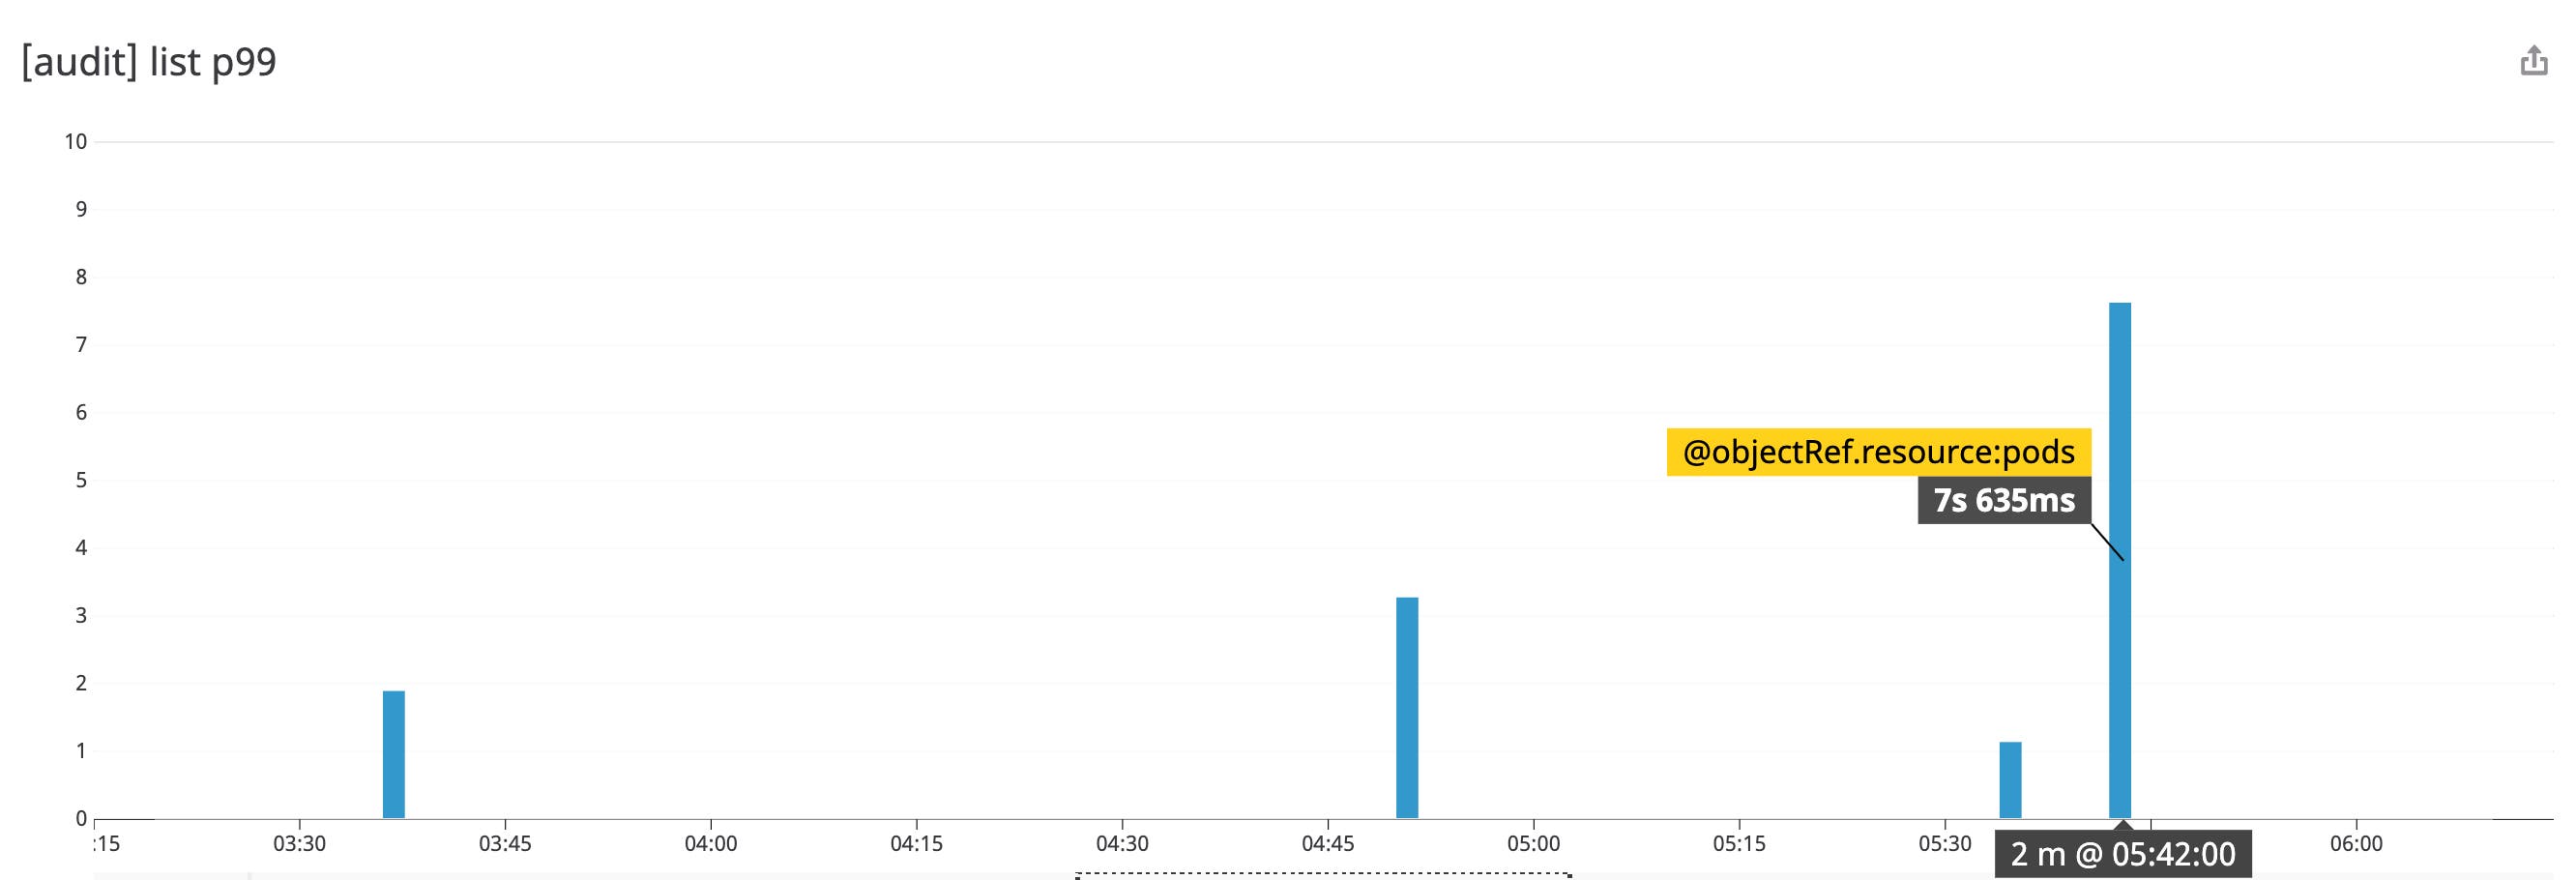
You can also break down the 99th-percentile latency of list API calls by the requested resource (the objectRef.resource attribute). It looks like the spike in list call latency is primarily limited to the pods resource.
If you click on the graph to inspect the audit logs generated from these slow requests, you can get even further details. The audit log below indicates that this request took longer than three seconds. By looking at the key attributes, you can gather more context around this request, like sourceIPs (where the request came from) and user (the RBAC information about the user and groups that sent the request).
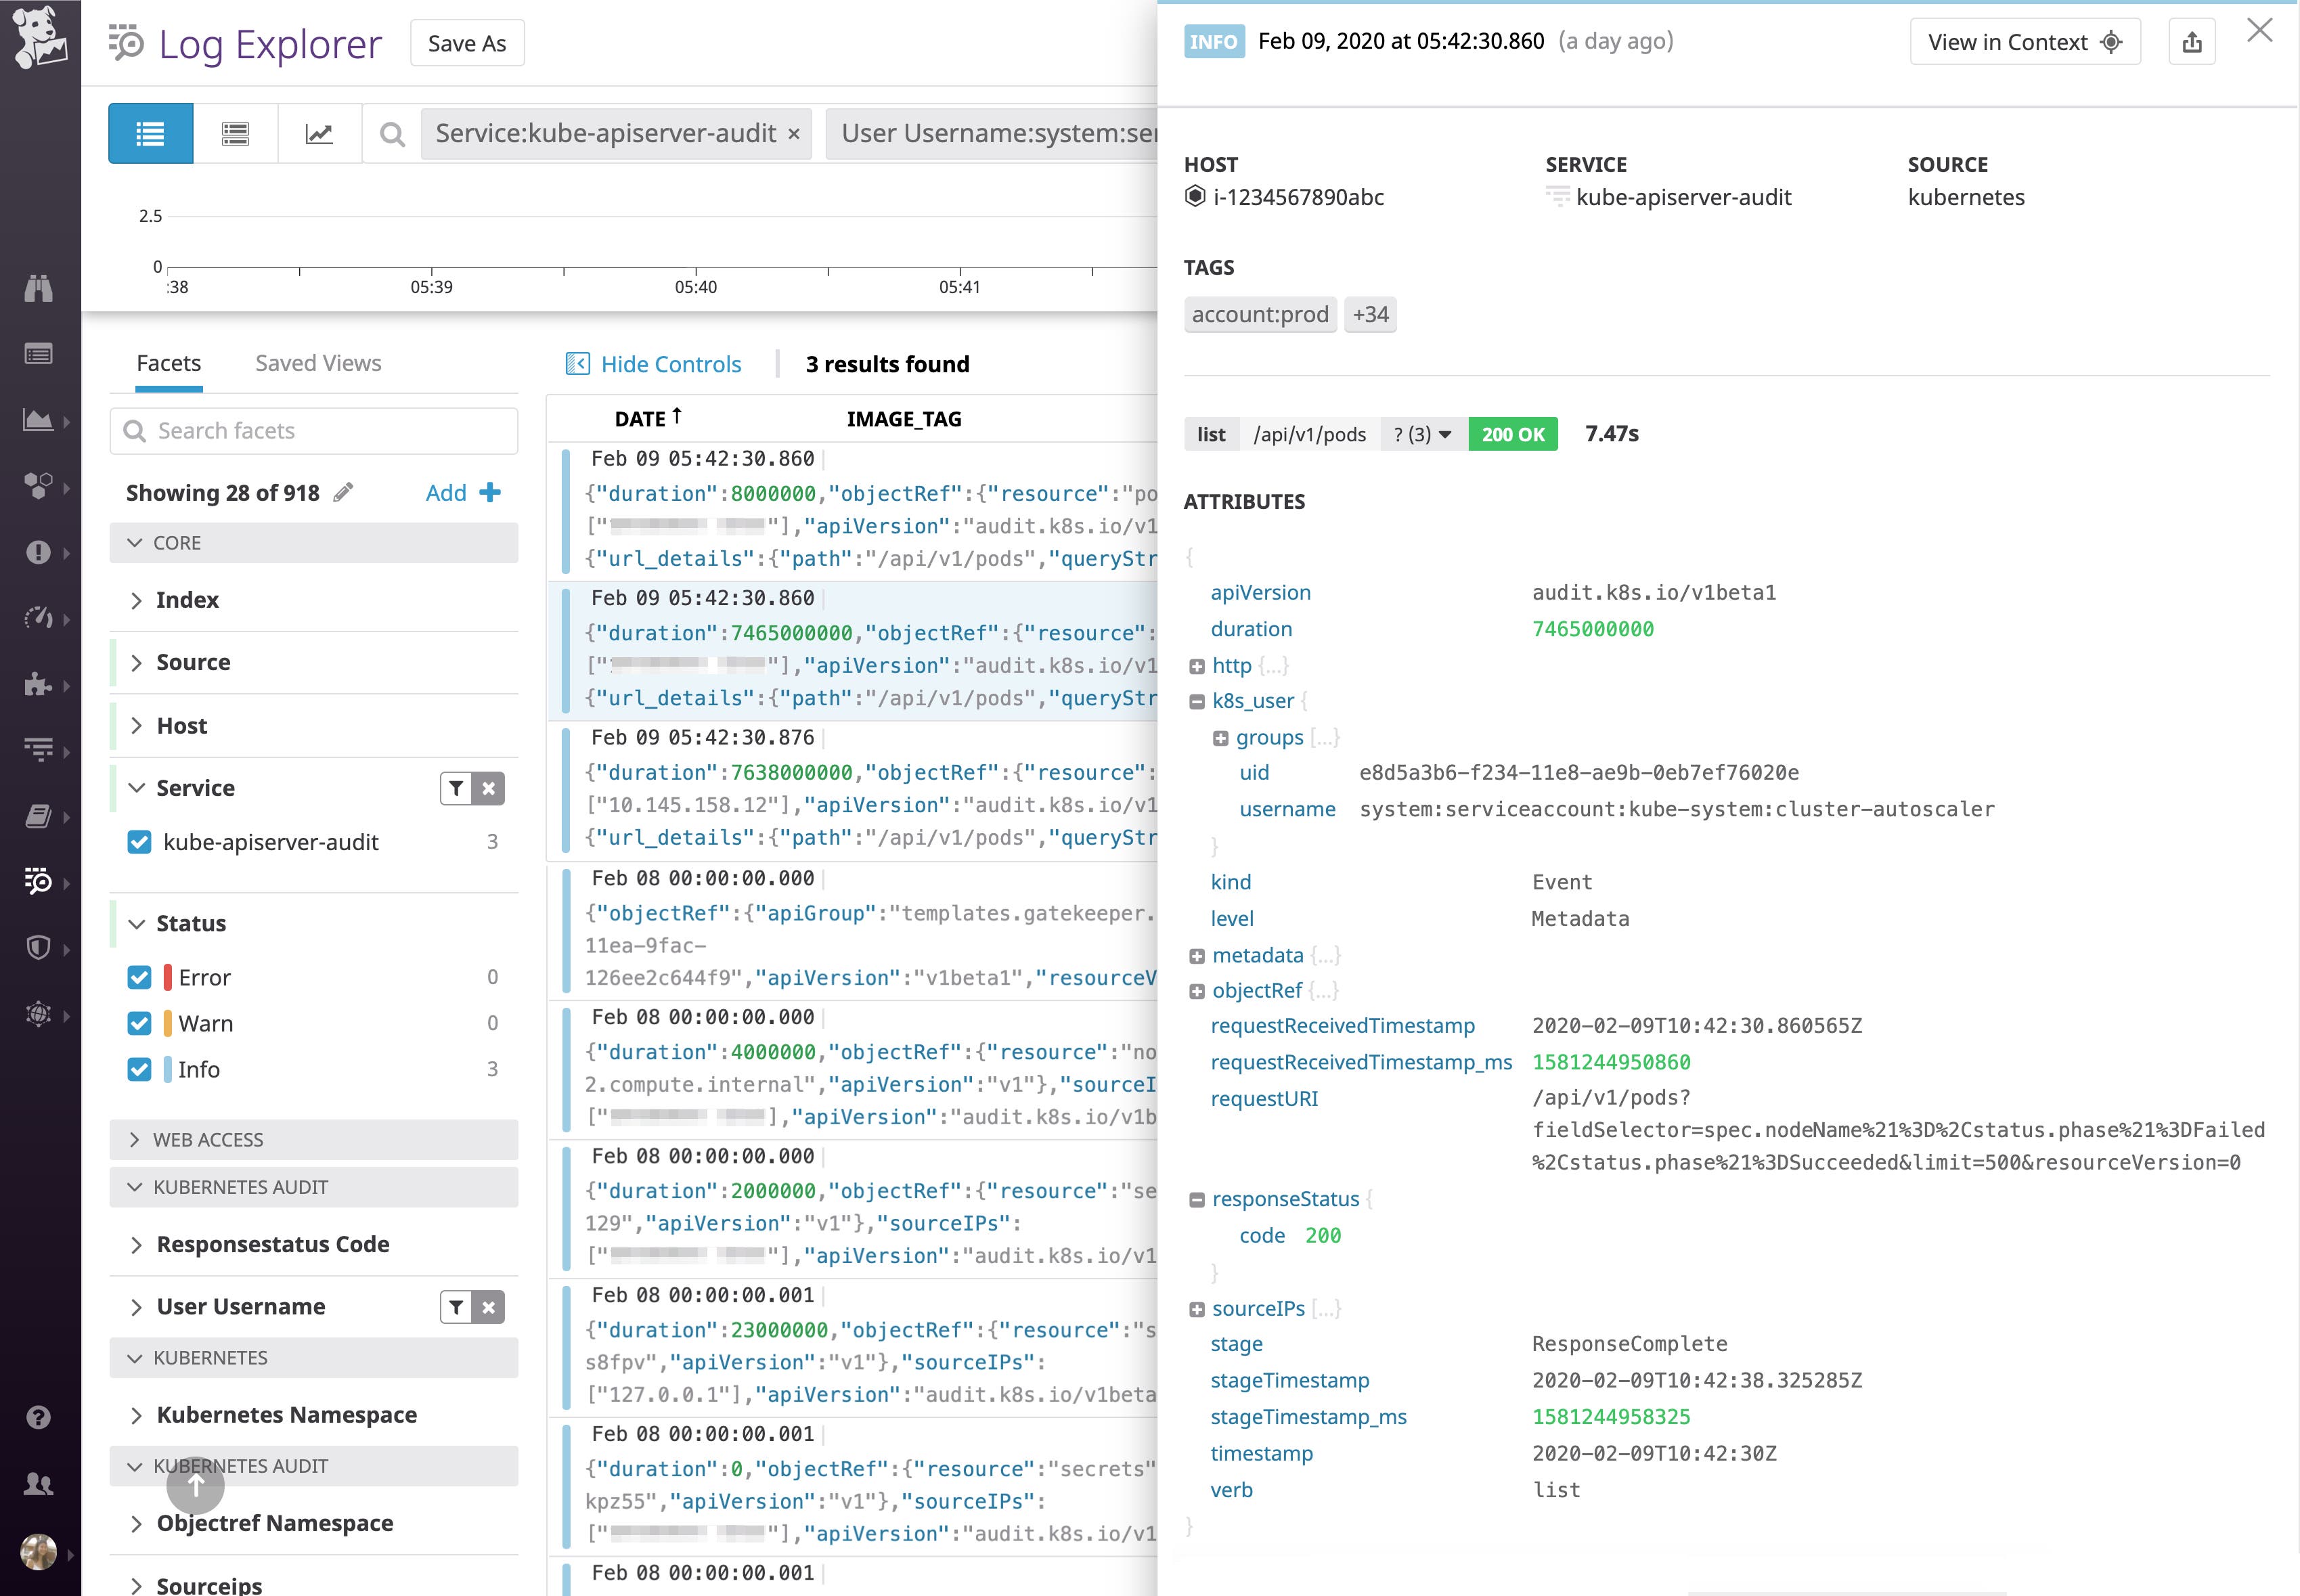
By looking at the service account that generated this request, we can see it came from cluster-autoscaler, an upstream component that queries the API server for a list of currently running pods when it starts up. If this request is slow, it means this controller is taking a long time to gather information about the state of the resources it needs to do its work. Furthermore, these slow list requests place heavy load on the API server, which affects the performance of the cluster overall. To optimize this component and speed up the list query, we can consider moving some pods and their associated resources to a different cluster (to reduce the total number of objects in this cluster) or scaling up the API server (e.g., adding more memory, more instances, etc.).
Although audit logs are useful for getting granular insights into cluster operations, they can also capture more details than you need—leading to information overload and high-cost storage requirements. You may also want to exclude sensitive data from your audit logs, such as authentication tokens.
With the right configuration, you can ensure that your audit logs capture the key information you need, while filtering out noise. In the next section, we’ll show you how to configure an audit policy that captures the necessary level of detail in your audit logs.
How to configure Kubernetes audit logs
Your Kubernetes audit policy specifies the types of API requests you want to capture in your audit logs. Each Kubernetes API call is composed of stages, including RequestReceived (the API server received the request) and ResponseComplete (the API server generated a response). Some stages are not applicable to every type of request—for instance, a watch operation moves from RequestReceived to the ResponseStarted stage rather than directly to ResponseComplete because it continuously watches for updates and receives responses accordingly, rather than receiving just one response.
In your audit policy, you can configure which stages of each request should generate logs, as well as the desired level of verbosity for each type of resource. For example, kubectl get pod <POD_NAME> would generate an audit log at the level of detail specified for the pods resource. You can use the omitStages parameter in an audit policy to refrain from logging information about one or more stages of a request.
Audit policy rules are evaluated in order. The API server will follow the first matching rule it finds for each type of operation/resource. So make sure you list more specific rules at the top, followed by more broadly applicable rules.
A typical Kubernetes audit policy looks something like this:
apiVersion: audit.k8s.io/v1kind: Policyrules:# do not log requests to the following- level: None nonResourceURLs: - "/healthz*" - "/logs" - "/metrics" - "/swagger*" - "/version"
# limit level to Metadata so token is not included in the spec/status- level: Metadata omitStages: - RequestReceived resources: - group: authentication.k8s.io resources: - tokenreviews
# extended audit of auth delegation- level: RequestResponse omitStages: - RequestReceived resources: - group: authorization.k8s.io resources: - subjectaccessreviews
# log changes to pods at RequestResponse level- level: RequestResponse omitStages: - RequestReceived resources: - group: "" # core API group; add third-party API services and your API services if needed resources: ["pods"] verbs: ["create", "patch", "update", "delete"]
# log everything else at Metadata level- level: Metadata omitStages: - RequestReceivedIn this file, we configured the API server to log at the highest level of detail (level: RequestResponse) for certain types of cluster-changing operations (update, patch, create, and delete). We also tracked requests to the subjectaccessreviews resource at the highest level to help troubleshoot authentication delegation issues. You may want to reduce the level of verbosity to Metadata for endpoints that contain sensitive data (e.g., the tokenreviews resource shown above). We also omitted the RequestReceived stage from our logs (more on that below).
In the last section, for everything that was not explicitly configured by the previous rules, we logged that information at Metadata level. Although these logs may not be useful all the time, you never know when you’ll need these logs for debugging. However, if you would like to reduce the volume of audit logs you’re generating, exclude less critical actions/verbs (e.g., operations that don’t change the cluster state, like list, watch, and get).
You can find examples of audit policies in the Google Kubernetes Engine (GKE) documentation and in the Kubernetes documentation.
Kubernetes audit log policy tips
Although your audit log policy will vary according to your use case, we have a few general guidelines to share:
- The
RequestReceivedstage is usually redundant, so you can useomitStagesto ignore it. TheRequestReceivedstage tracks when the API server first receives the request, but this information is already captured in therequestReceivedTimestampattribute of your audit logs at theResponseCompletestage. - Use
level: Noneto ignore endpoints that don’t capture relevant information, such as/healthzand/metrics. At Datadog, we also ignore/logs,/swagger*, and/version. - The
RequestResponselevel captures the body of the request and the resulting response. Although this can provide a lot of valuable information, keep in mind that requests with large response payloads can place a significant load on the API server and increase storage needed for audit logs.
Set your audit policy in motion
Once you’ve configured your Kubernetes audit policy, use the --audit-policy-file flag to point to the file, and the --audit-log-path to specify the path to the file where the API server should output audit logs. If you don’t specify a path, the API server will output logs to stdout.
kube-apiserver --audit-log-path=/var/log/kubernetes/apiserver/audit.log--audit-policy-file=/etc/kubernetes/audit-policies/policy.yamlThe Kubernetes API server will start logging to the specified audit.log file in JSON format.
Monitor Kubernetes audit logs with Datadog
Now you can start using a monitoring service like Datadog to analyze audit logs and create automated alerts to detect unusual activity. If you want to learn how to configure Datadog to collect your Kubernetes audit logs, check out our documentation.
Datadog’s log management features can help you cost-effectively monitor your logs by setting dynamic indexing policies (e.g., capturing more logs during an outage) that provide critical visibility into logs when you need them. We recommend indexing audit logs that capture more crucial information (such as cluster-changing operations like create, patch, update, and delete), as well as any subjectaccessreviews requests, as these tend to be critical for enforcing the security of your cluster.
You can also generate metrics from audit logs and index just a portion of those logs to make them available for graphing, analysis, and real-time alerting.
Once you’re collecting audit logs—and indexing the ones that matter most to you—you can set up monitors to help you detect potential issues in Datadog. Let’s walk through an example of investigating a spike in anonymous traffic to the API server.
Investigate anonymous requests to the API server
When an API call does not include a user, it is known as an anonymous request. Although anonymous users should only be able to access publicly accessible resources (anything not protected by authorization policies), they may still indicate malicious activity that is worthy of investigation.
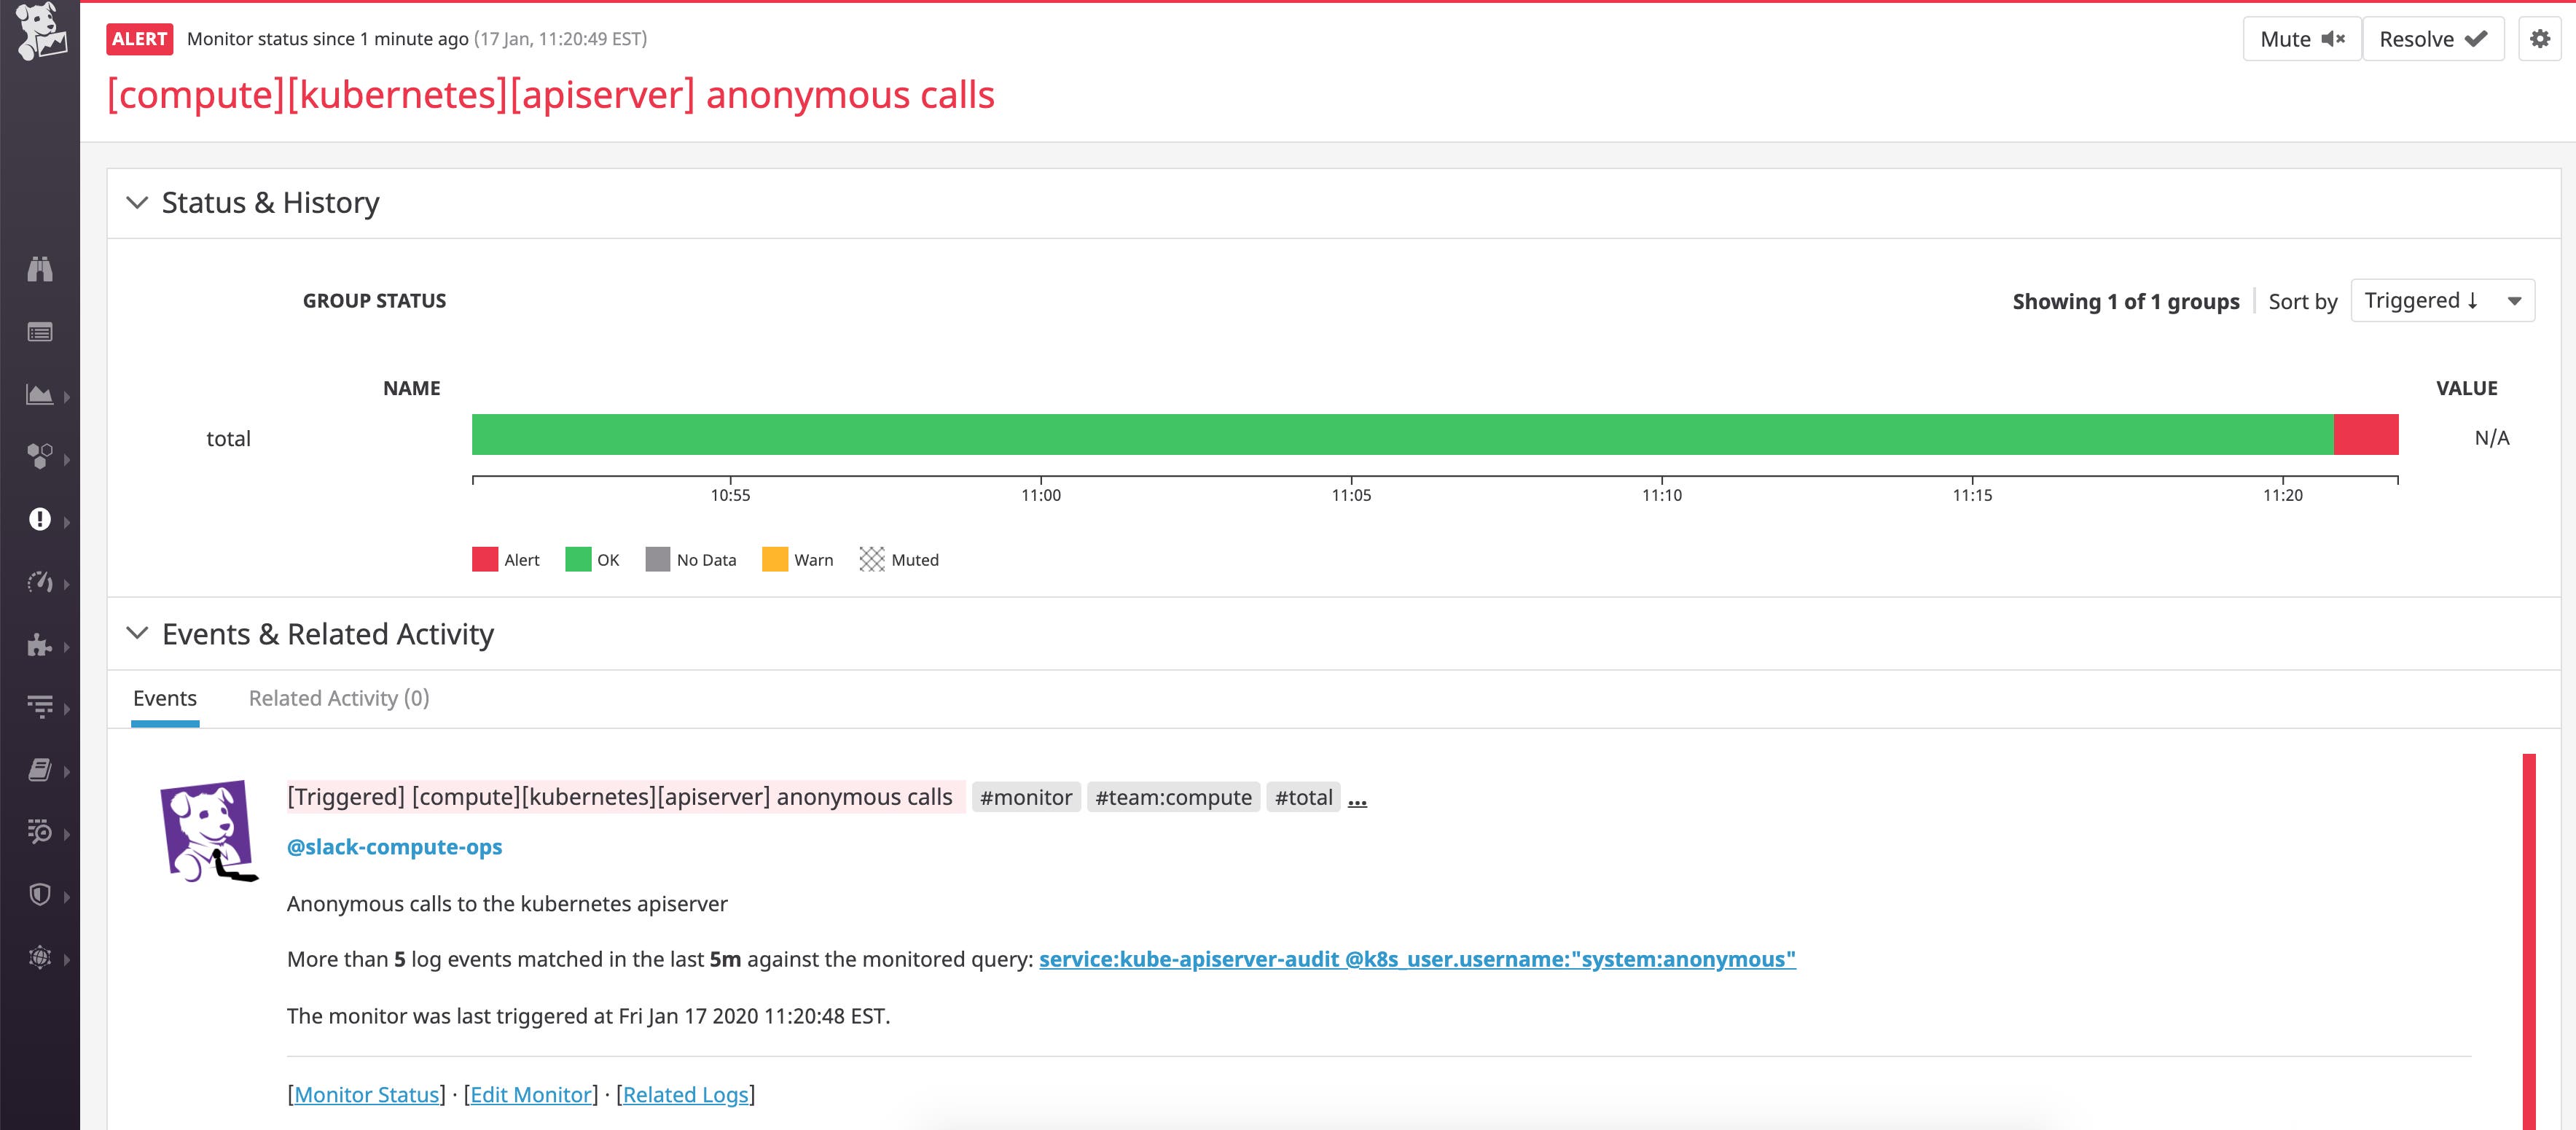
The monitor below triggered upon detecting an uptick in anonymous API calls in our audit logs. To investigate, we can click on the Related logs link in the alert notification message, which allows us to inspect the audit logs that triggered this particular alert.
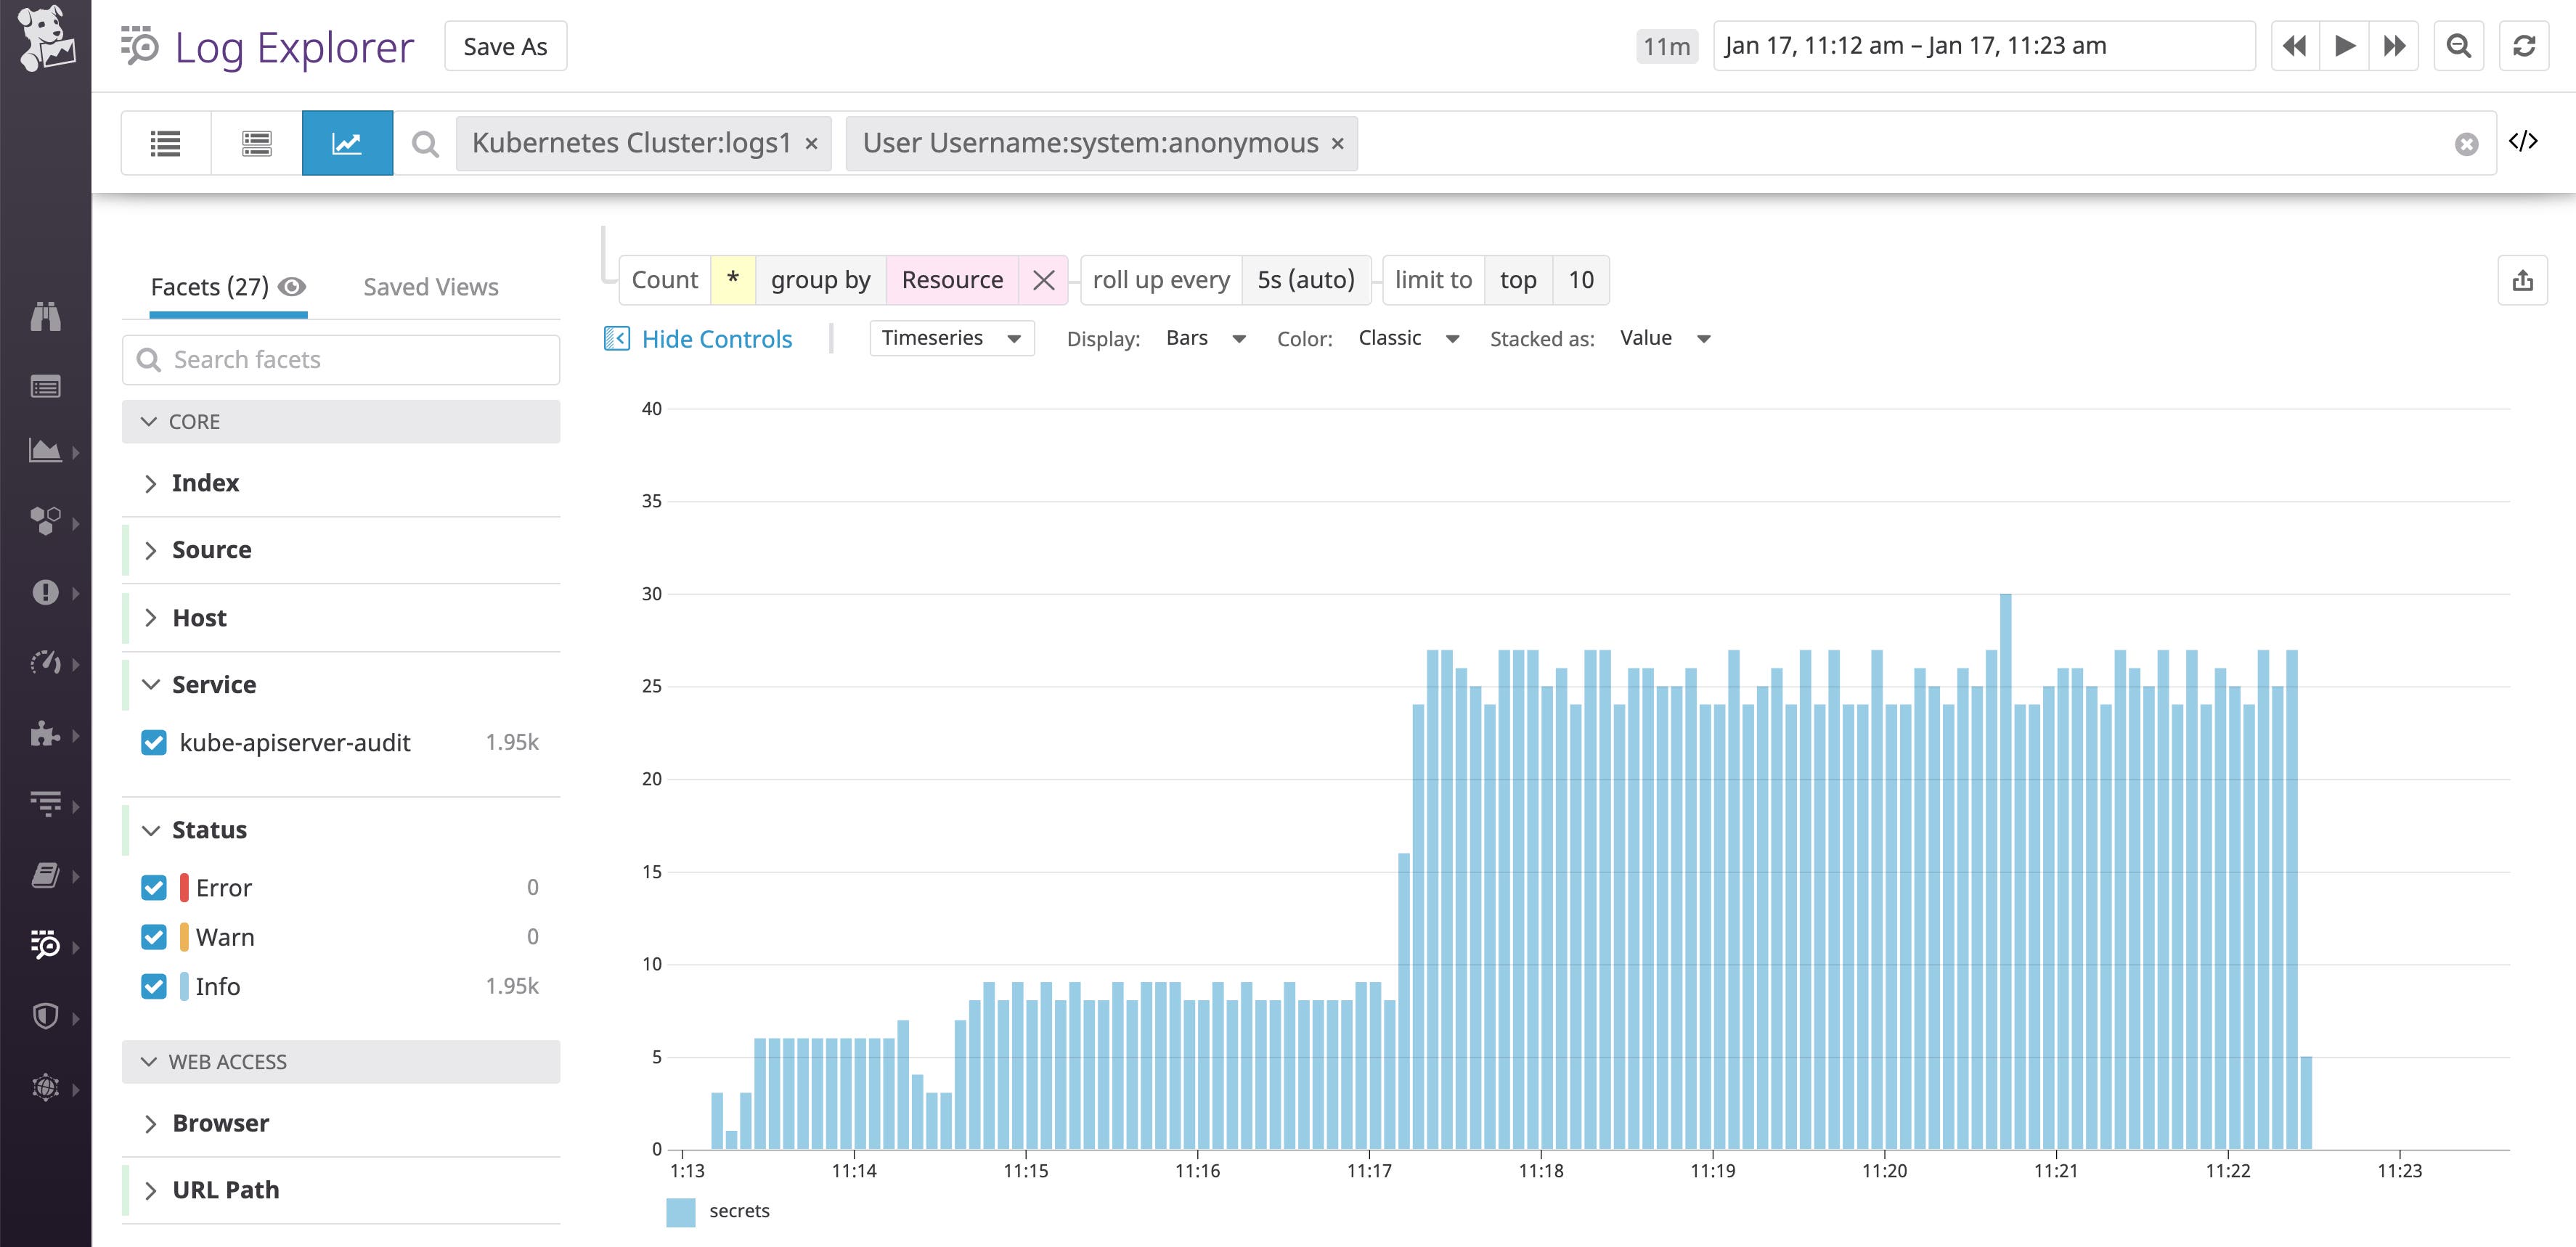
From there, we can switch to the analytics view to observe what kind of anonymous calls we are receiving. The example below shows us that the anonymous calls are focused on the secrets resource.
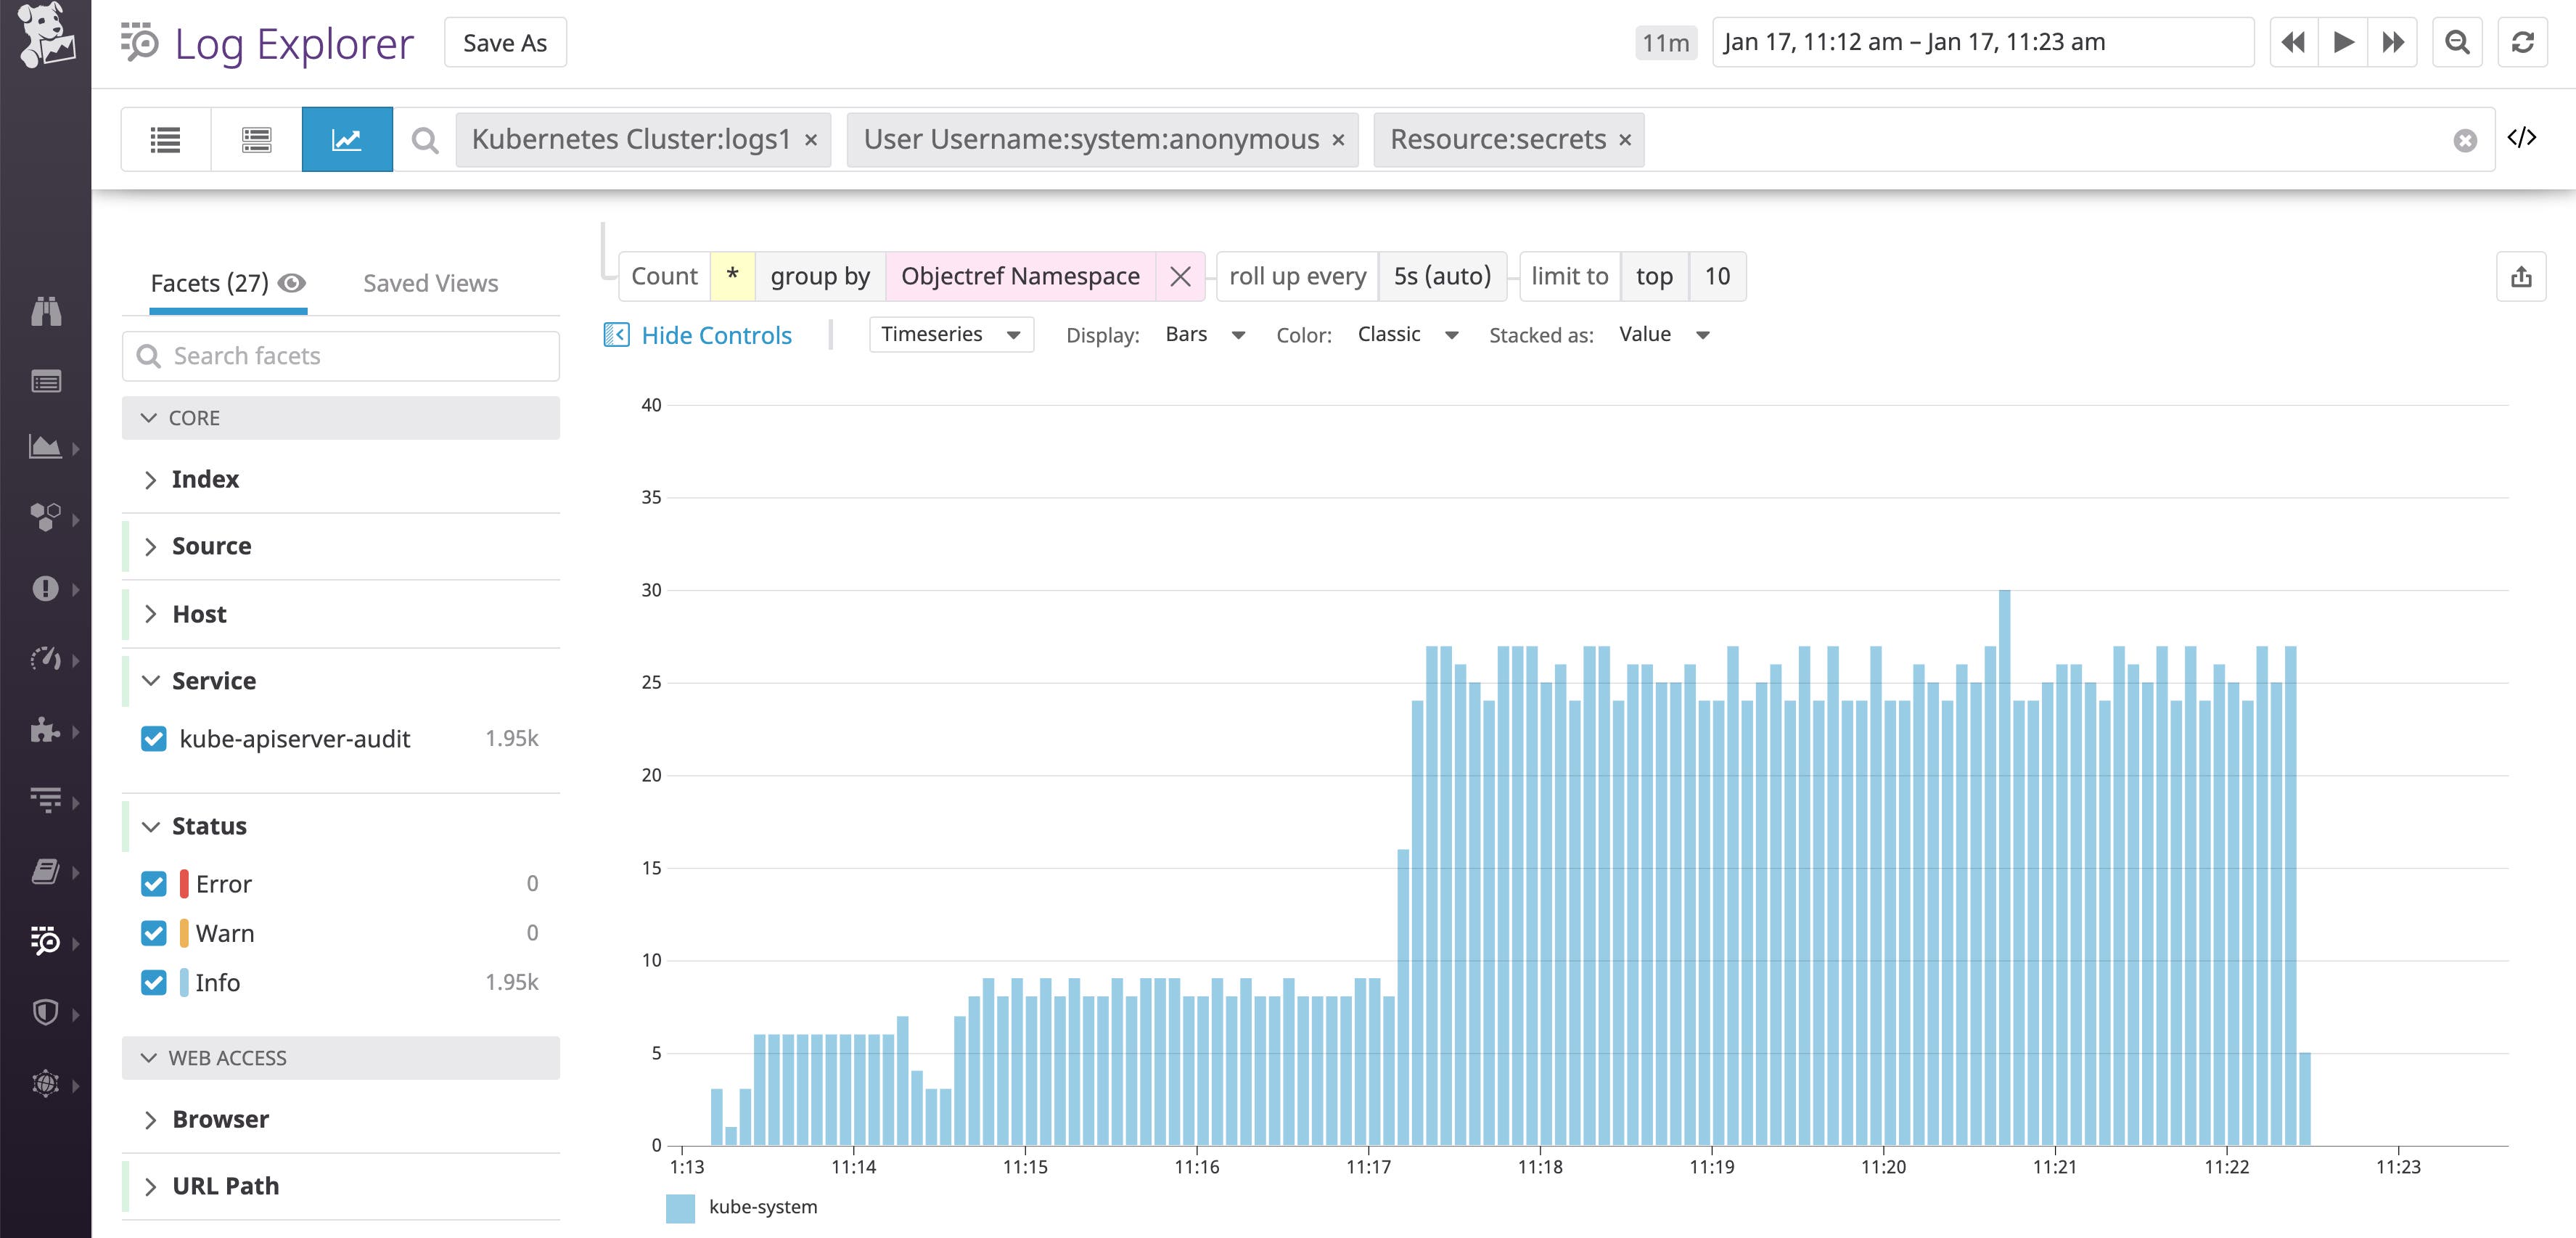
To dig deeper, we can break down these queries by namespace. This indicates that the anonymous calls are focused on requesting secrets from the kube-system namespace.
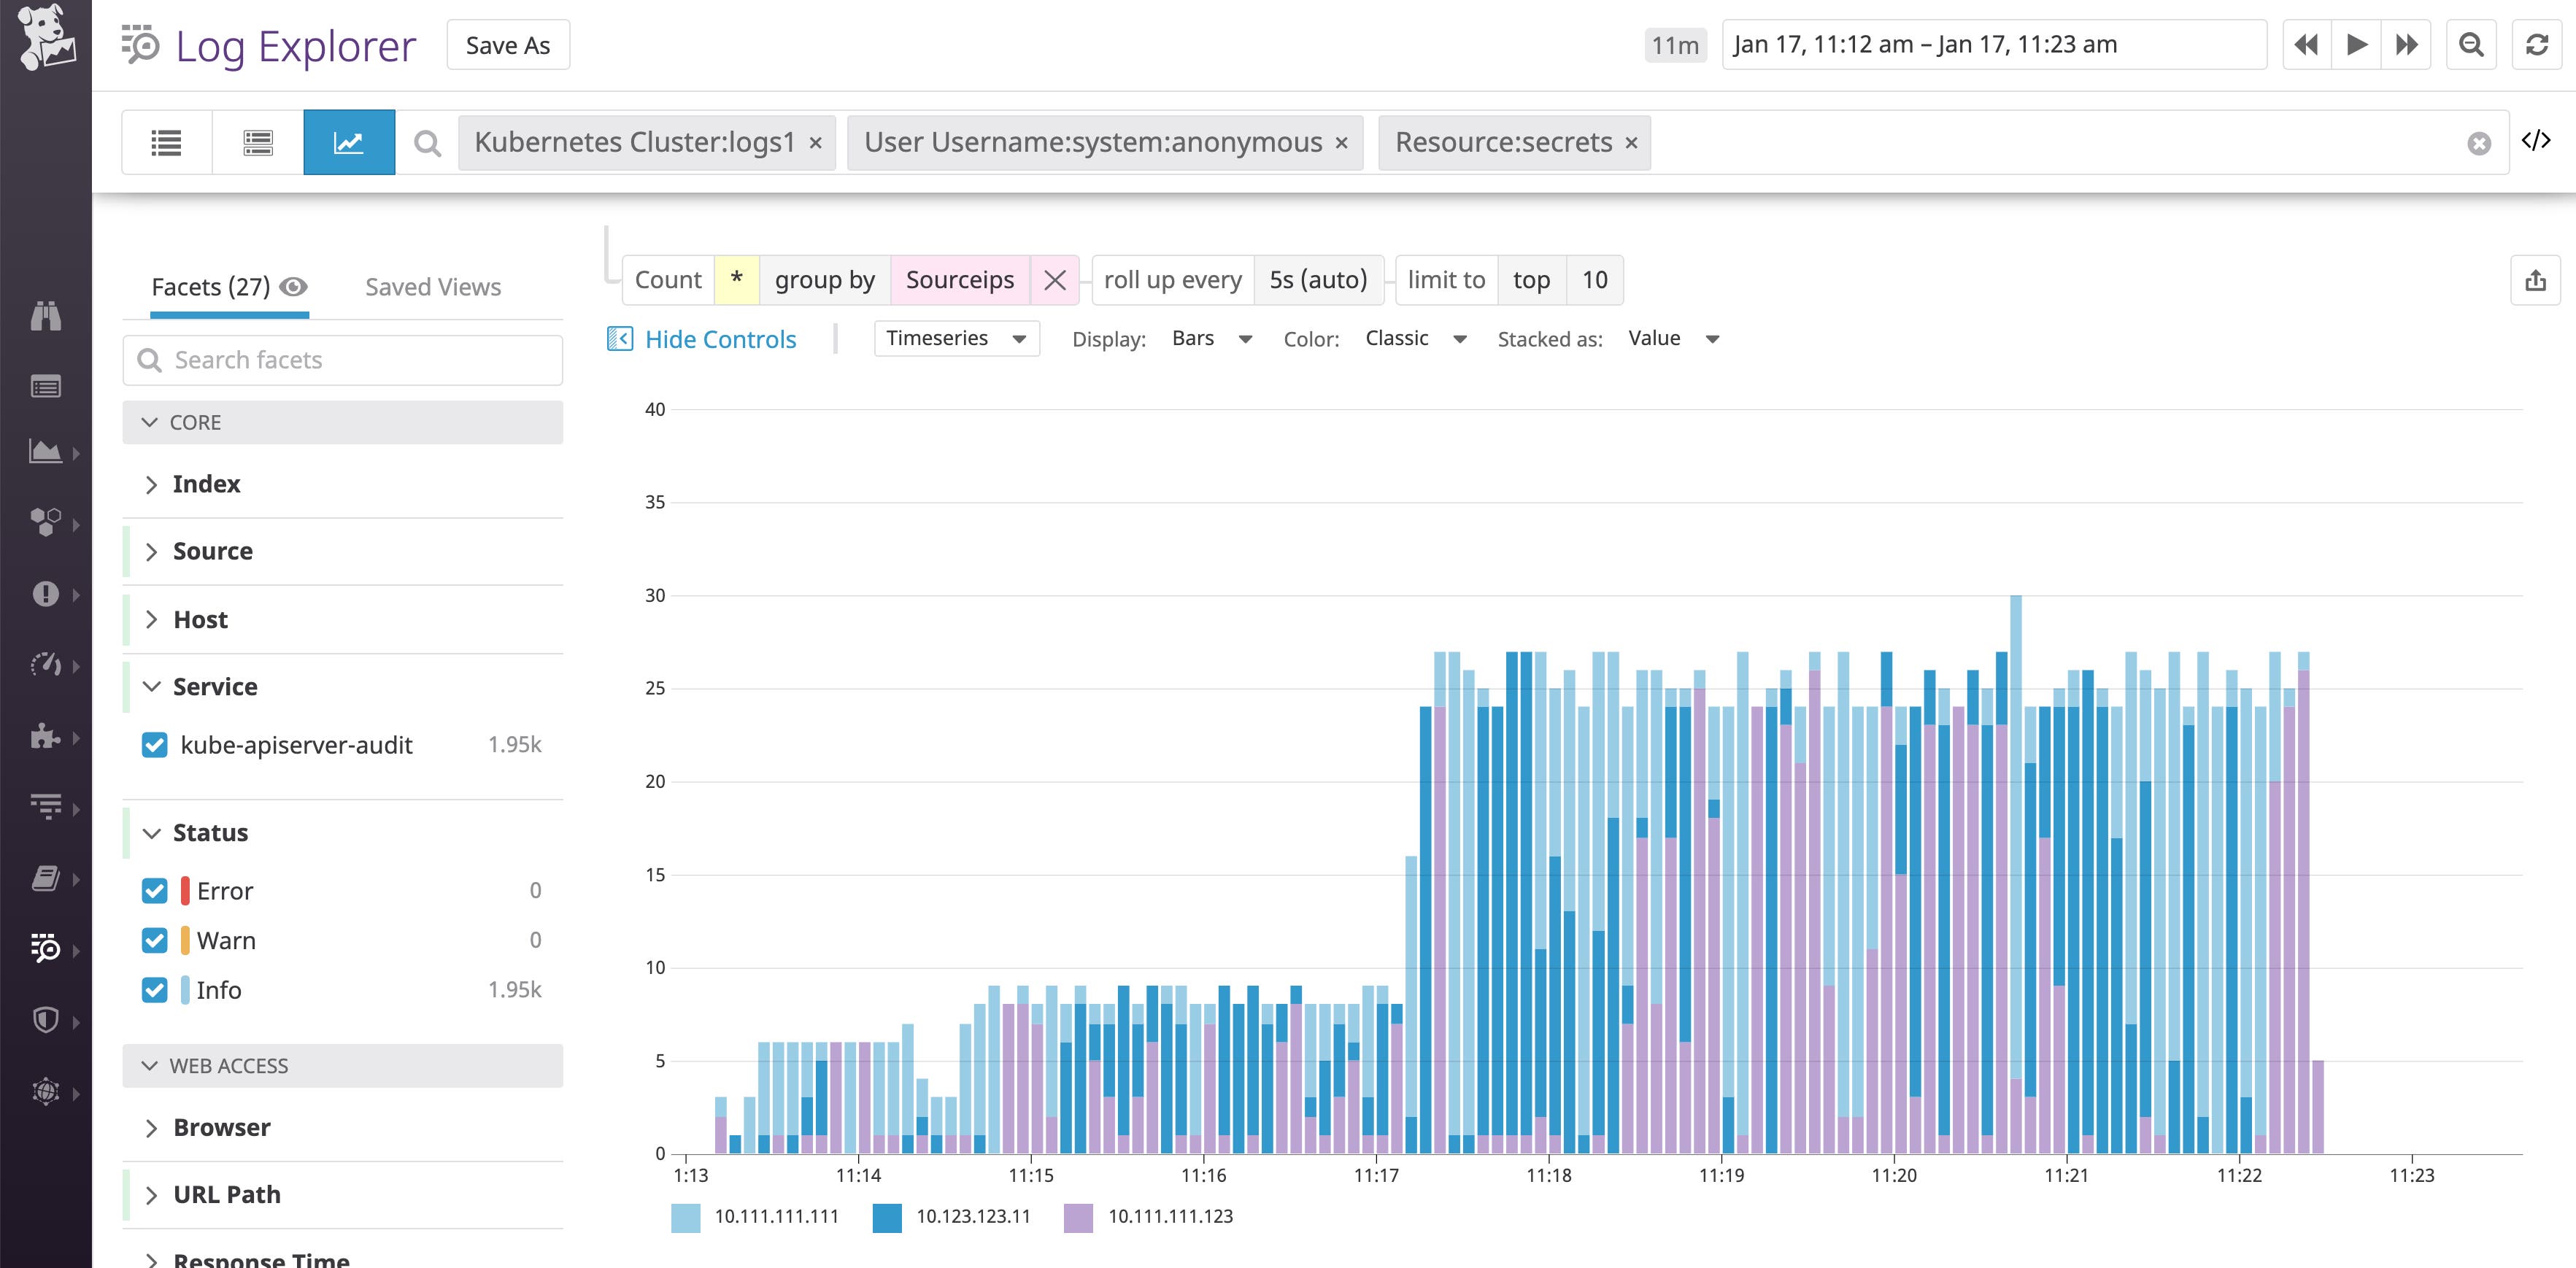
Then, if we break down these logs by the Sourceips attribute, we can identify the exact source IPs these queries came from:
In order to check if these anonymous requests are causing significant load on our API server, we can visualize the 99th-percentile latency. According to the graph below, this potential attack or misconfiguration had a very low impact on the API server in this namespace:
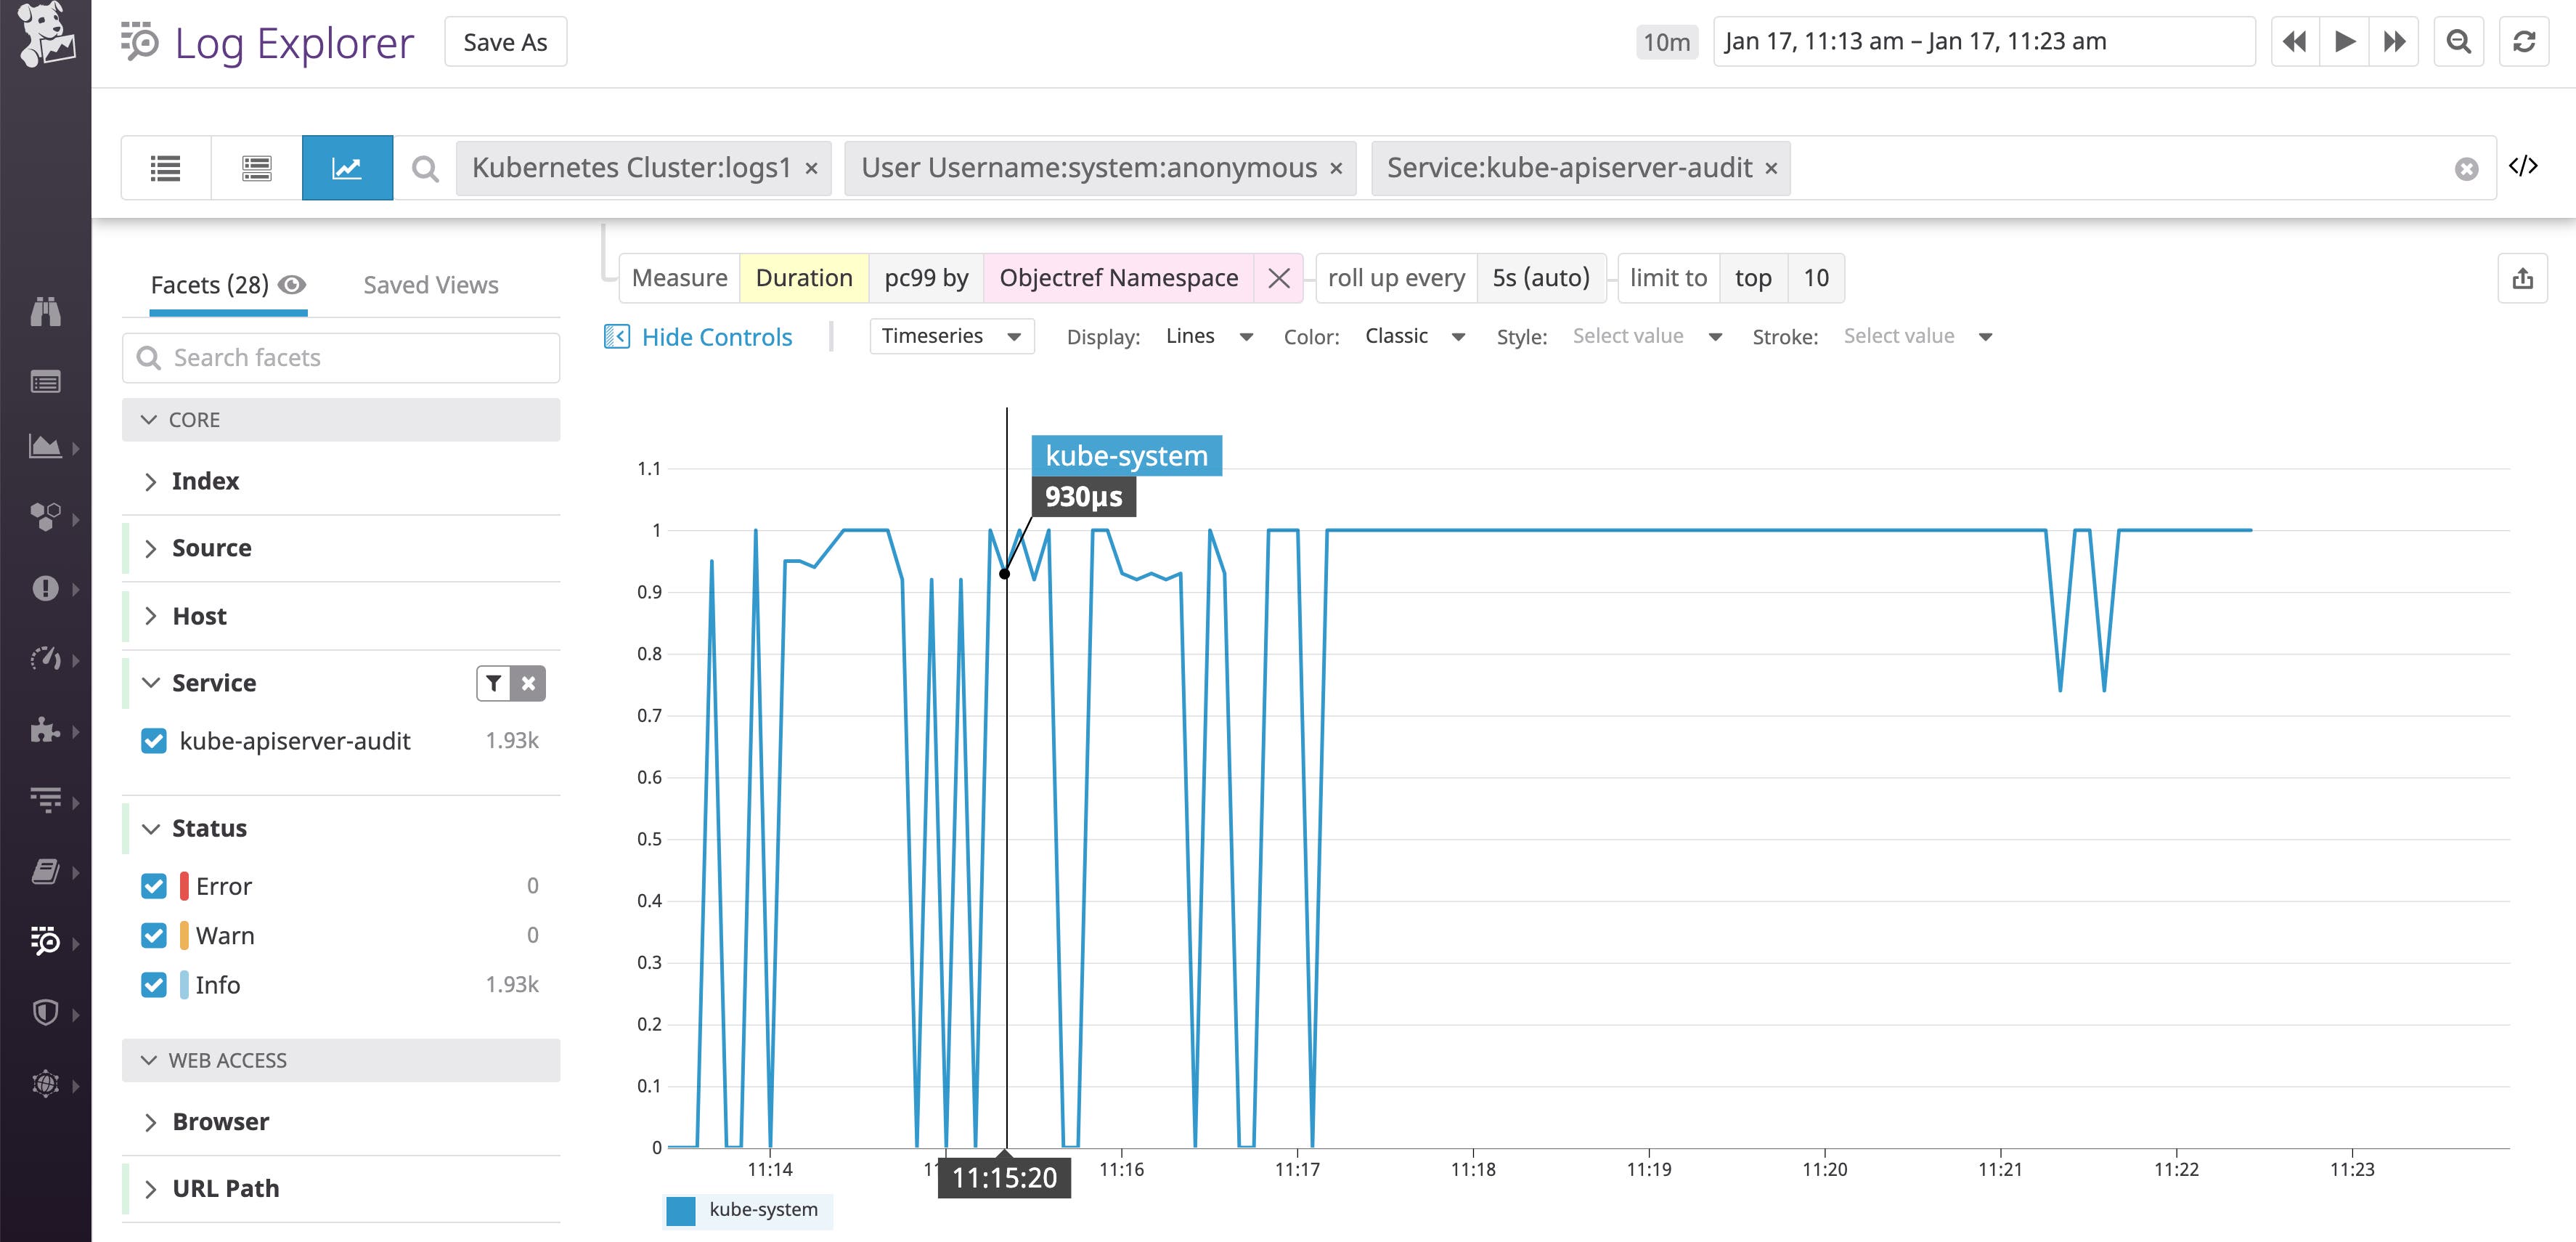
Although these anonymous requests did not overload the API server in this case, we can provide a list of those source IPs to the security team so they can investigate further. In the past at Datadog, monitoring the number of anonymous calls to the API server has helped us identify misconfigured clients and RBAC policies that needed to be more restrictive.
Get more out of your audit logs
In this post, you’ve learned how to configure and collect Kubernetes audit logs to get deeper visibility into cluster operations and to troubleshoot issues in your container infrastructure. For more on this topic, you can watch our KubeCon talk on getting the most out of Kubernetes audit logs. See our documentation to start collecting and analyzing your Kubernetes audit logs in the same platform as the other logs, metrics, and distributed request traces from your containerized applications. Or sign up for a free trial to get started.

