Betsy Sallee

Alon Berger
Kubernetes audit logs contain detailed information about every request to the Kubernetes API server and are critical to detecting misconfigurations and vulnerabilities in your clusters. But because even a small Kubernetes environment can rapidly generate lots of audit logs, it’s very difficult to manually analyze them.
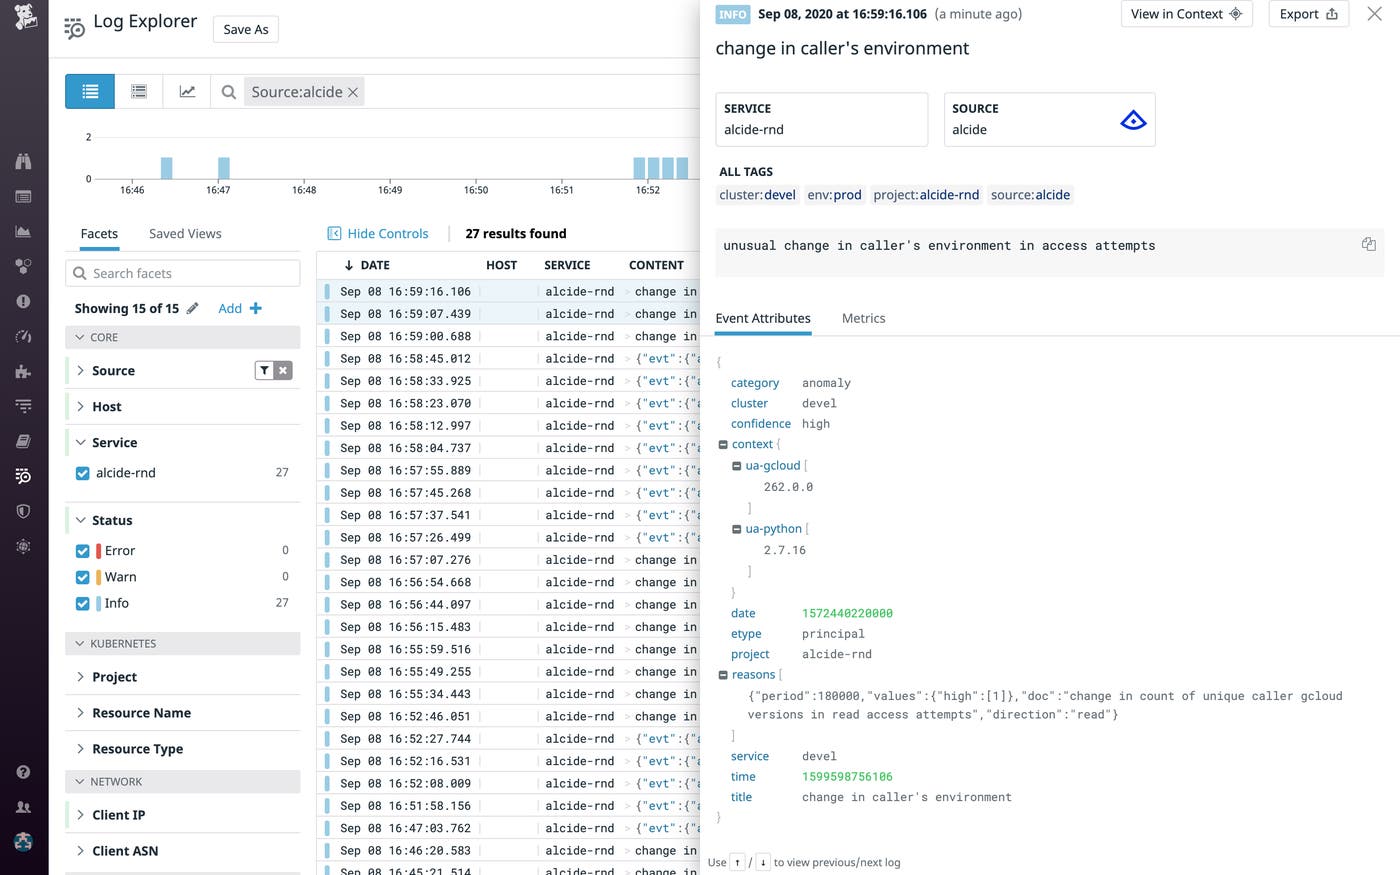
Alcide kAudit is a powerful forensic tool that leverages user-configured rules and a machine learning algorithm to collect and analyze Kubernetes audit logs in order to detect compliance violations, security incidents, and administration activity anomalies in real time. Datadog’s integration with Alcide kAudit enables users to create alerts and security rules based on kAudit logs—and to explore kAudit logs within the context of system-wide monitoring data. With Datadog, you can archive ingested kAudit logs for long-term cloud storage and rehydrate them whenever needed, so you will always have the necessary data to conduct an investigation.
How Alcide kAudit works
Alcide kAudit takes a two-pronged approach to monitoring Kubernetes audit logs.
First, kAudit users proactively configure a set of rules that dictate which activity they’d like to capture in order to monitor compliance with their internal audit policy. For instance, they might indicate that they’d like a record of every create/read/update/delete action within their cluster, in addition to every time a user deletes an audit log, which would constitute a compliance violation.
Second, Alcide kAudit uses machine learning to observe and identify patterns in your system over time—and to detect anomalies within the audited activity. For instance, kAudit may detect an increase in requests that receive a 403 Forbidden response, which could signal a misconfigured RBAC policy. Alcide kAudit may also identify unusual behavior on the part of a particular user, such as API requests coming from a new location, which could indicate that the user’s credentials have been stolen.
Monitor and contextualize Kubernetes incidents and anomalies with Datadog’s Alcide kAudit integration
Datadog’s integration with Alcide kAudit enables users to monitor and alert on kAudit logs and to contextualize them with system-wide monitoring data. This helps you launch efficient investigations in response to Kubernetes security incidents and minimize their impact without needing to leave the Datadog platform.
Create custom security rules for anomalous behavior
With Datadog’s Detection Rules, users can define conditional logic that applies in real time to all ingested logs, including those that are coming from kAudit. Customers can write their own rules—without having to learn a proprietary query language—which will trigger as soon as the condition is met.
For instance, customers taking advantage of the kAudit integration could create a security rule that will trigger when an anomalously high number of user agents is being used by a single user or service account.
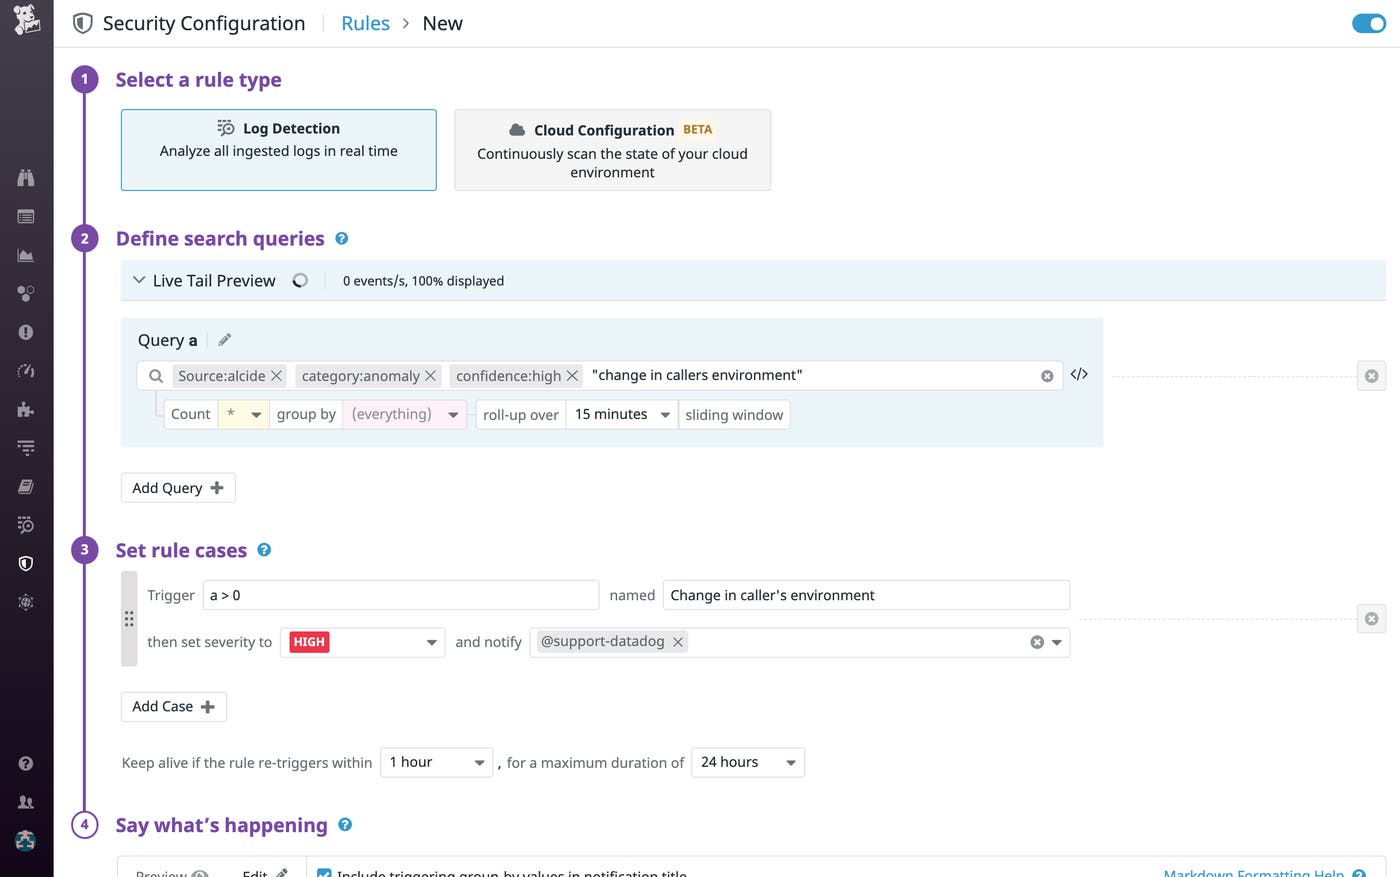
When that rule generates a security signal, users can dive immediately into associated logs with a single click—and correlate this signal with any other signals triggered during the same time frame by their cloud environment—in order to assess the origin and scope of the issue.
Generate log-based metrics to visualize trends and configure alerts
The dynamic, ephemeral nature of any Kubernetes system yields an enormous number of audit logs, which, in turn, leads to a high volume of kAudit logs. These logs are essential for monitoring purposes, but getting useful information out of them can be difficult, and indexing all of them can be costly. With Datadog, you can generate metrics based on the data in your kAudit logs, which allows you to easily monitor long-term trends without having to index everything.
For example, you can create a log-based metric that tracks the number of delete actions within your cluster. Then, you can configure a monitor that will trigger an alert when the rate increases beyond a certain threshold, as shown in the screenshot below.
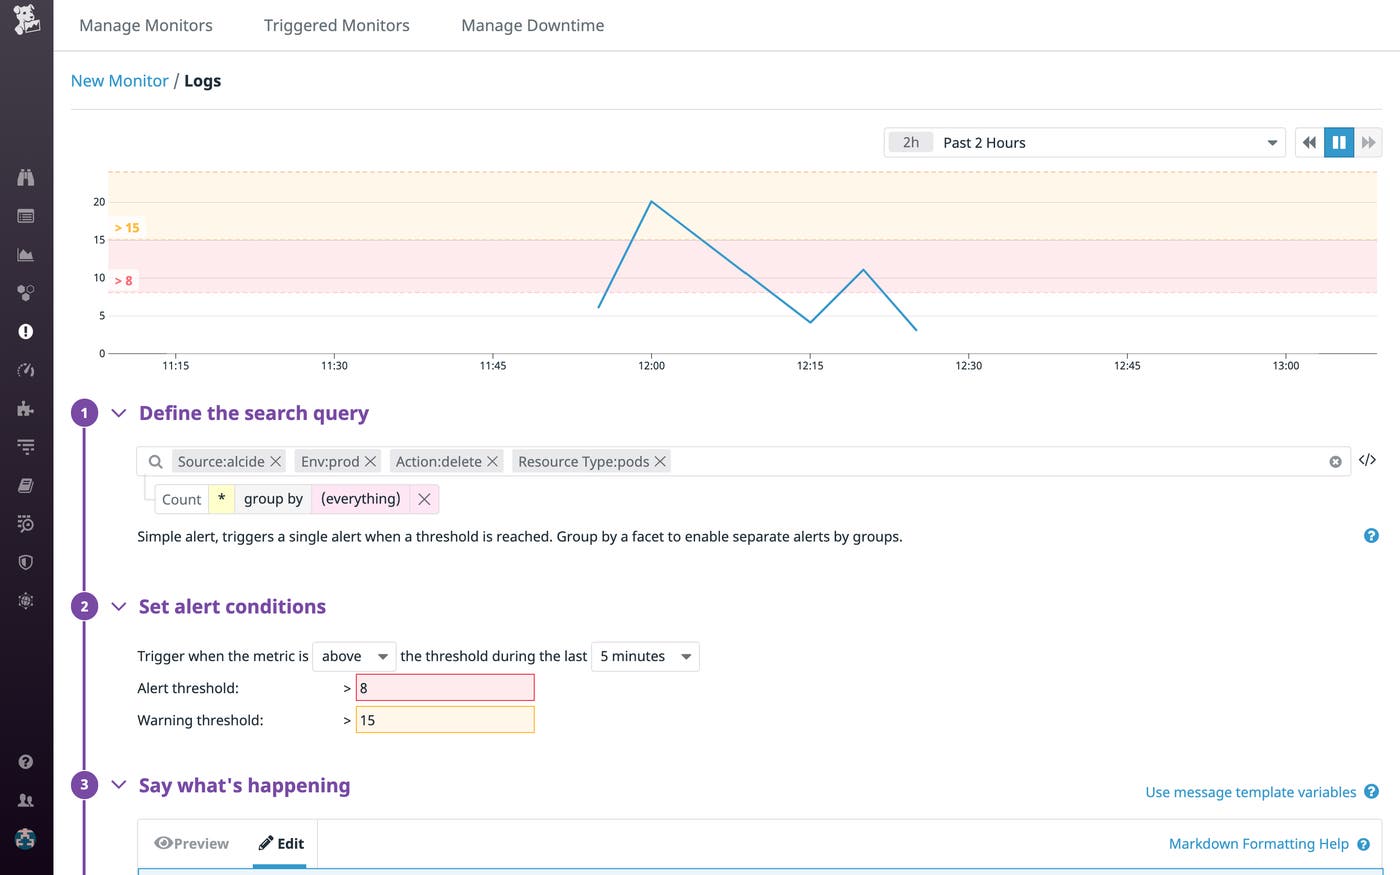
You can also create a timeseries graph for this log-based metric and add it to a custom dashboard.
Explore kAudit logs in context
Datadog parses and enriches your kAudit logs on ingestion, so you can slice and dice them with the same tags and facets that you use when exploring logs from your applications and infrastructure. This enables you to view logs from kAudit within the context of monitoring data from your entire system.
For instance, if kAudit detects an anomalous number of list requests coming from a particular client IP, you can filter all available logs in Datadog—i.e., not just logs from kAudit—for that particular IP in order to see what other activity is coming from that address. You may find that the client IP responsible for the anomalous list requests is also associated with other suspicious behavior, such as requests to privileged resources within AWS.
Datadog’s Logging without Limits™ also allows you to archive every ingested log—even the ones you don’t index—in long-term cloud storage, ensuring that you have a comprehensive record of all activities and anomalies that have occurred within your Kubernetes system in the event of a breach.
Make the most of your Alcide kAudit logs with Datadog
Datadog’s integration with Alcide kAudit allows customers to create custom security signals and metrics based on kAudit logs—and, with over 1,000 other integrations, to contextualize these logs with monitoring data from the rest of their stack. And because logs can be archived to long-term storage and rehydrated on demand, users can be sure that they’ll be able to quickly and efficiently troubleshoot any security incident, no matter when it occurs.
If you’re already a Datadog customer and would like to learn more about Datadog’s Alcide integration, check out the documentation. New to Datadog? Get started with a 14-day free trial.

