Rachel Groberman
Product Manager, Datadog

Will Roper
Developed and released by Google in 2018 with contributions from IBM, VMWare, Red Hat, and other companies, the Knative project is designed to make it as simple as possible to build, deploy, and scale serverless containers across your existing Kubernetes infrastructure. By operating on top of Google Anthos, Knative for Anthos takes this even further by allowing developers to build and deploy applications across any hybrid environments that include both on-prem and cloud-hosted serverless clusters. By taking care of networking, autoscaling, revision management, and infrastructure, Knative for Anthos lets teams focus on the core logic and code of their applications and services.
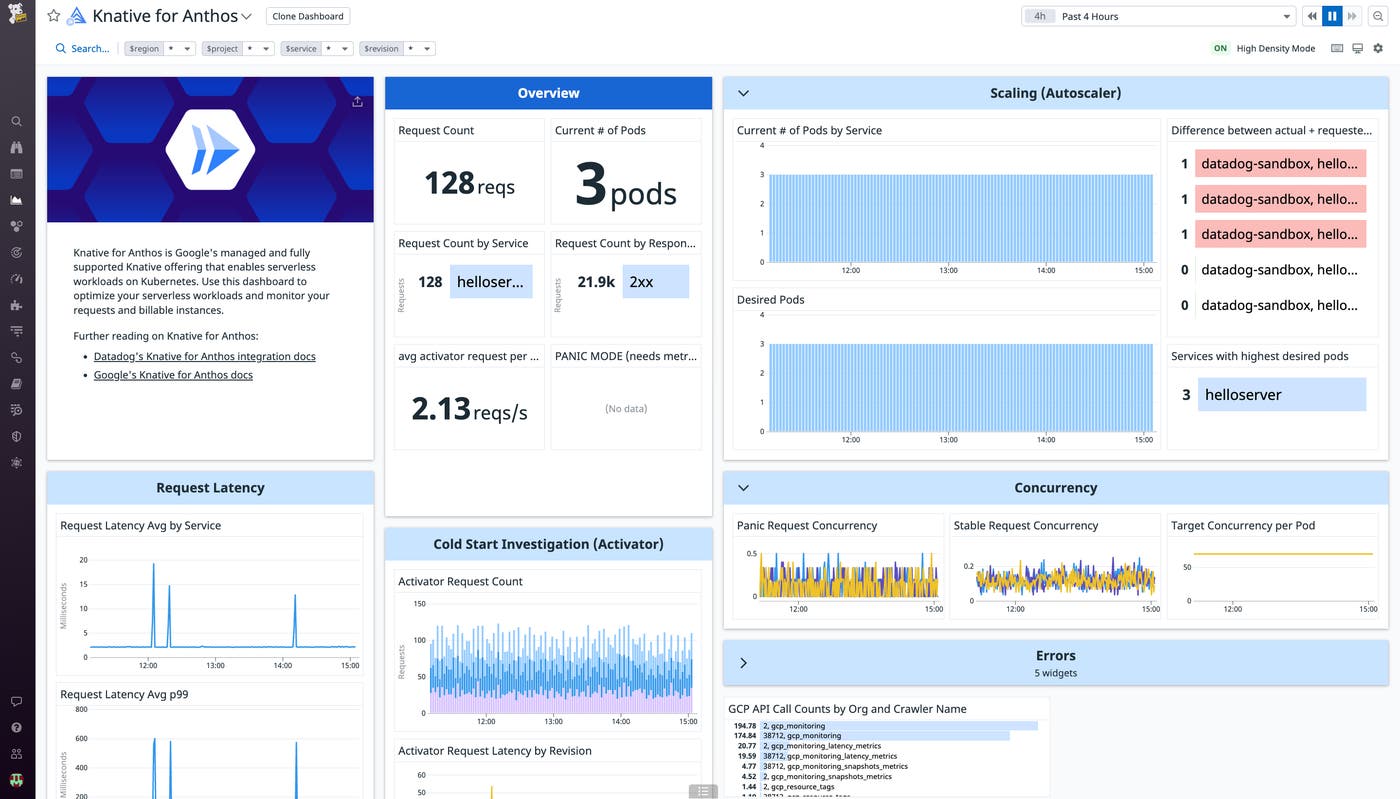
Now, with Datadog's Knative for Anthos integration, you can seamlessly and efficiently monitor all of your serverless workloads in one place, no matter where they’re running. Once you’ve enabled our new integration, Datadog will automatically populate an out-of-the-box dashboard with key Knative metrics and other complementary data to give you a high-level overview of cluster activity, revision performance, pod concurrency and Autoscaler data, and much more.

In this post, we’ll look at a few use cases for monitoring Knative for Anthos and highlight how monitoring with Datadog can provide key visibility into:
Hybrid workloads
Knative for Anthos utilizes Google Cloud Run so that you can deploy identical serverless applications to different environments and manage them via a unified control plane. All the underlying infrastructure complexities and Kubernetes abstractions are handled through Anthos so you can easily deploy, scale, and revise across these hybrid and multi-cloud environments with the same consistency.
Datadog collects Knative metrics across all your clusters for a birds-eye view into the health and performance of your workloads regardless of where they’re hosted—all on a single dashboard. Datadog automatically tags your metrics with key metadata out of the box, such as by the specific region or revision, to enable you to filter and group your key Knative metrics for either on-prem or cloud-hosted environments. For example, you can easily locate and compare spikes in request latency across regions regardless of whether they’re in datacenters or in cloud servers, as well as pinpoint average request latency and count number by revision throughout your hybrid infrastructure. If you identify a problem, you can easily pivot to other metrics, logs, or request traces for more context.
Autoscaling
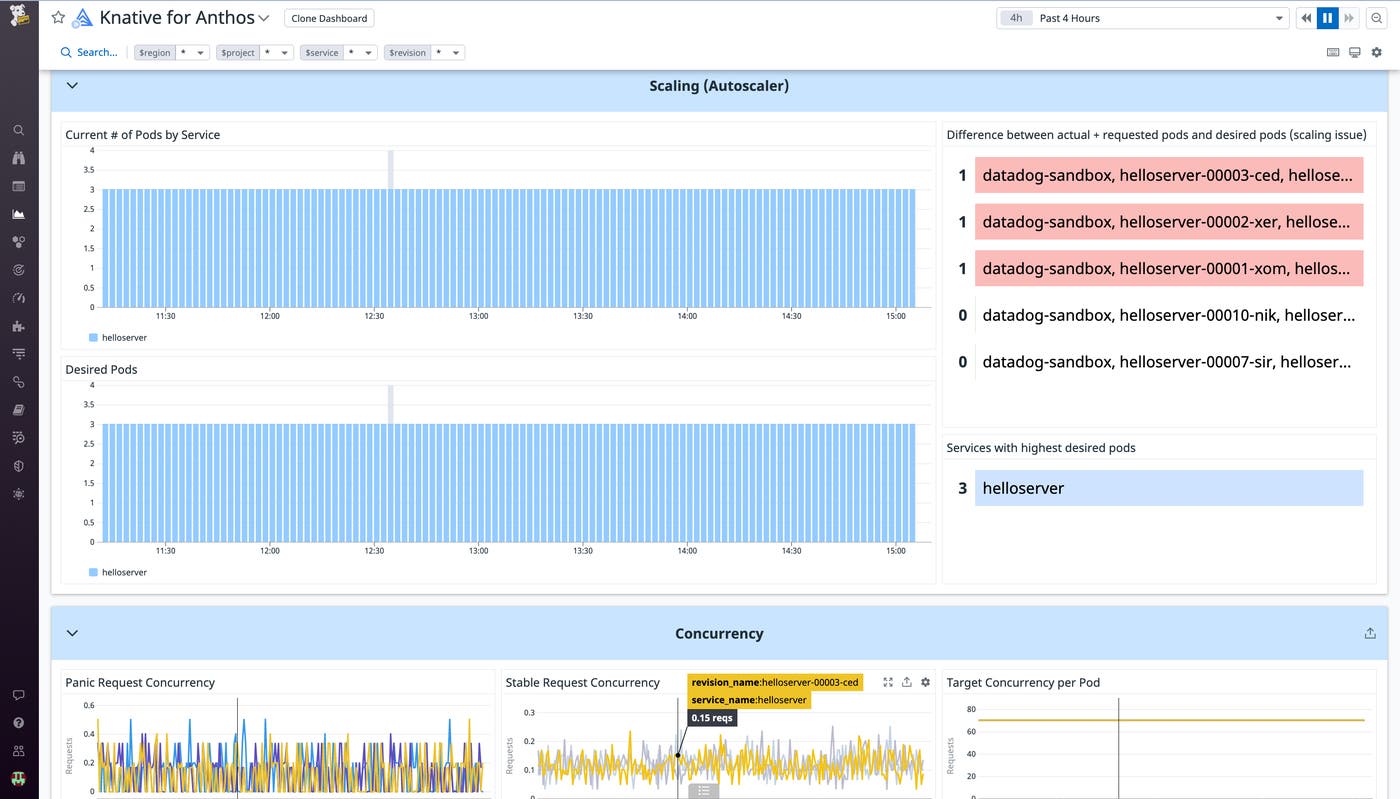
The Knative Autoscaler automatically scales container instances running your workloads to appropriately meet new requests while maintaining any existing concurrency targets, or the maximum number of requests a single instance can process simultaneously. It's important to monitor auto-scaling activity across your clusters to ensure that your services can handle any spikes in incoming requests and that, especially in the case of on-prem environments, you have enough underlying resources. You should make sure, for example, that there aren't major differences between the number of actual and desired pods running your services. This can help alert you to any issues where new instances are not launching, which could mean your service might not be able to handle the requests it's receiving.

It's also important to monitor concurrency across your instances. The Autoscaler uses a default limit of 80 concurrent requests per instance but makes use of a concurrency setting that could scale the number of simultaneous requests for each container instance up to 1,000 for traffic surges. The Autoscaler has two modes it uses to manage concurrency: stable and panic, with the panic mode rapidly scaling pods within a shorter time window to meet a higher number of incoming requests. Among other metrics, Datadog collects the total request concurrency and the target concurrency per pod assigned to the Autoscaler to ensure you’re up to speed on both the average concurrent requests per pod and the recommended concurrent requests during the normal stable scaling window of 60 seconds. Overall, monitoring your Knative Autoscaler gives you a granular view into the performance of your pods and clusters throughout your hybrid environments as you scale up and down.
Revision management
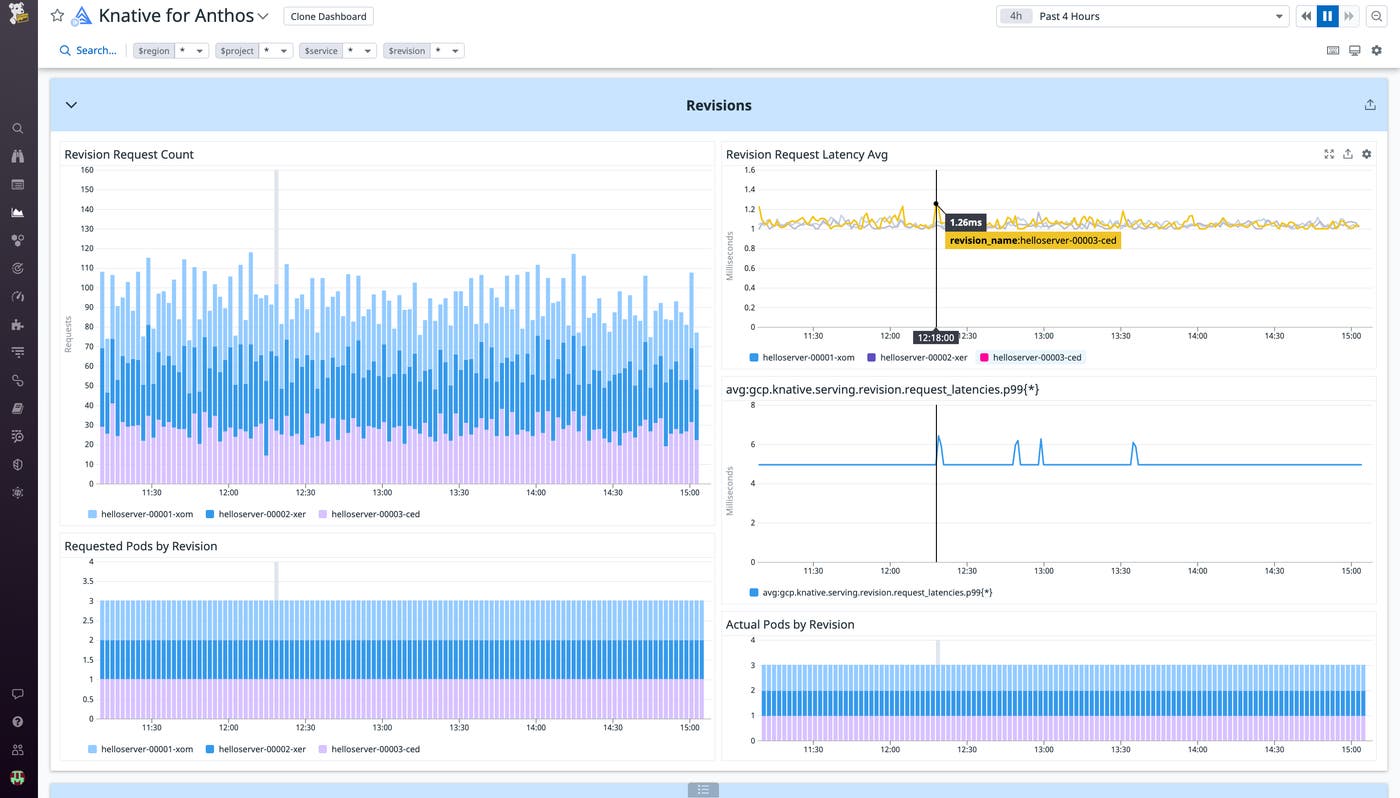
A revision is a new version of an existing service, and it’s important that you stay updated on how each revision is impacting traffic to your services. Drops in request counts or spikes in latency for new revisions indicate several potential problems, such as underlying bugs or improper deployment across pods. Real-time insight into key health and performance metrics lets you effectively manage these inevitable issues and focus more on your service.

Latency distribution and request count are two important metrics for tracking the health and performance of your revisions and quickly identifying whether you’re rolling out a bug so you can roll it back. For example, Datadog shows the request count and average request latency with the service name and revision so you can easily graph and compare new revisions to determine whether they’re experiencing any abnormalities, showing you the aggregate requests and latencies of your services and pods spread across your hybrid infrastructure over a period of time.
Get started with monitoring Knative for Anthos today
Knative for Anthos enables developers to deploy and manage serverless apps and services across both hybrid and multi-cloud environments. Datadog’s integration gives you full visibility into your clusters and serverless workloads by letting you visualize and alert on metrics on the revision management and auto-scaling features that matter to you. Datadog also integrates with more than 500 other services and technologies, so you can monitor your entire stack using one unified platform. For example, you can use Datadog's Kubernetes integration to visualize and alert on key metrics from the Kubernetes objects that support your Cloud Run services. If you aren’t already using Datadog to monitor your infrastructure and applications, you can start your 14-day free trial.

