Daniel Langer
Google Cloud Run is a new compute platform that allows you to run stateless containers without having to manage the underlying infrastructure. You can choose between a fully managed version of Cloud Run, or manage your existing clusters with Cloud Run for Anthos—Google's platform for operating containerized workloads consistently across Google Kubernetes Engine (GKE), multi-cloud, on-premise, and hybrid infrastructure.
With Cloud Run, deploying is as easy as specifying a container image, along with settings such as environment variables, memory limits, and concurrency, or the maximum number of requests that can be sent to a container instance at any time.
Datadog is proud to be a launch partner for Cloud Run and Cloud Run for Anthos. These services are now generally available, and we're excited to provide visibility for our customers who are adopting serverless container workloads in Google Cloud. In this post, we’ll show you how you can monitor all the flavors of Cloud Run with Datadog.
Cloud Run in any cloud
Google Cloud Run is powered by Knative, a Kubernetes-based open API and runtime environment for serverless computing. And because Cloud Run for Anthos runs Kubernetes under the hood, you can use Datadog’s Google Cloud and Kubernetes integrations to monitor your Cloud Run services. (Note: when deploying the Datadog Agent DaemonSet, make sure hostNetwork: true is set within the pod spec.)
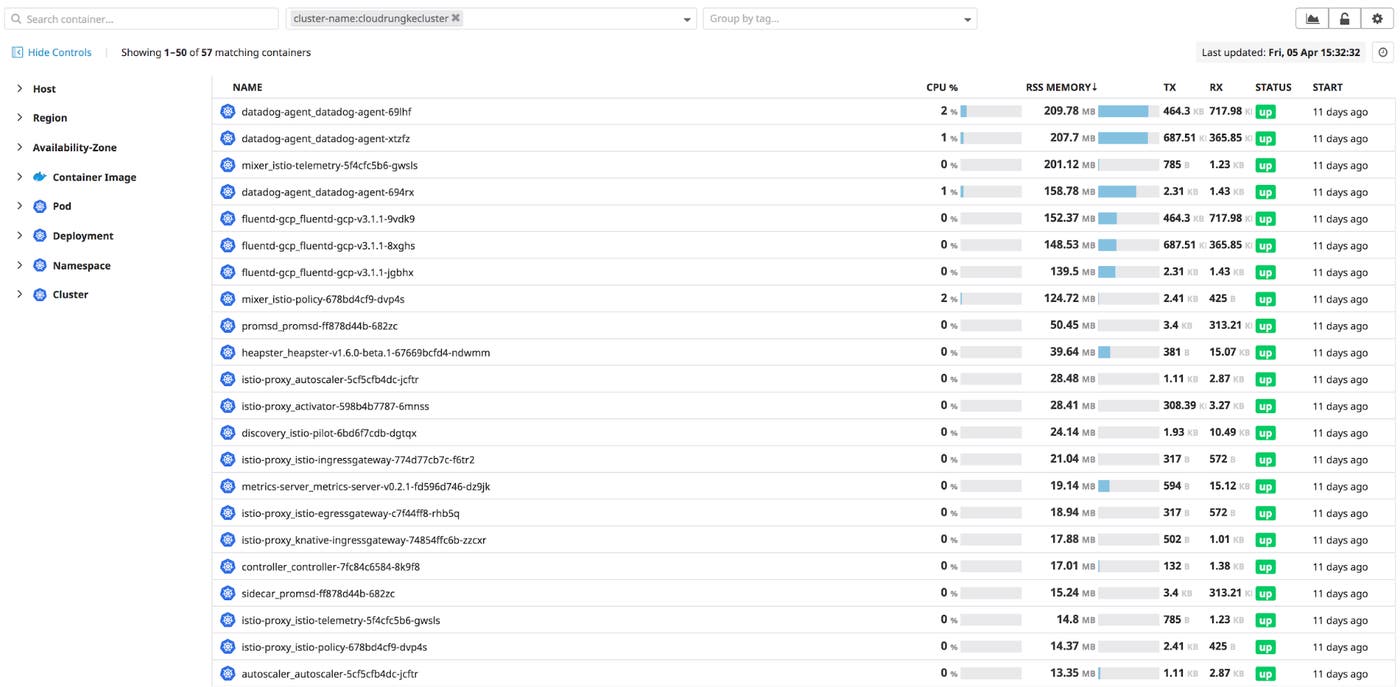
Once you integrate Cloud Run with Datadog, you'll automatically see data that reflects the performance of your container workloads, including latency and request counts, as well as the CPU and memory resources used by your code. You can collect metrics, traces, and logs from across your cluster, and as your application scales up and down, you'll see real-time information on every container in your environment in the Live Container view. You can search and filter your Cloud Run container fleet using tags that we ingest automatically from Google Cloud and Kubernetes. For example, you can use the cloudrun_service tag to filter for containers that host a particular service, and the cloudrun_revision tag to see specific revisions of that service.
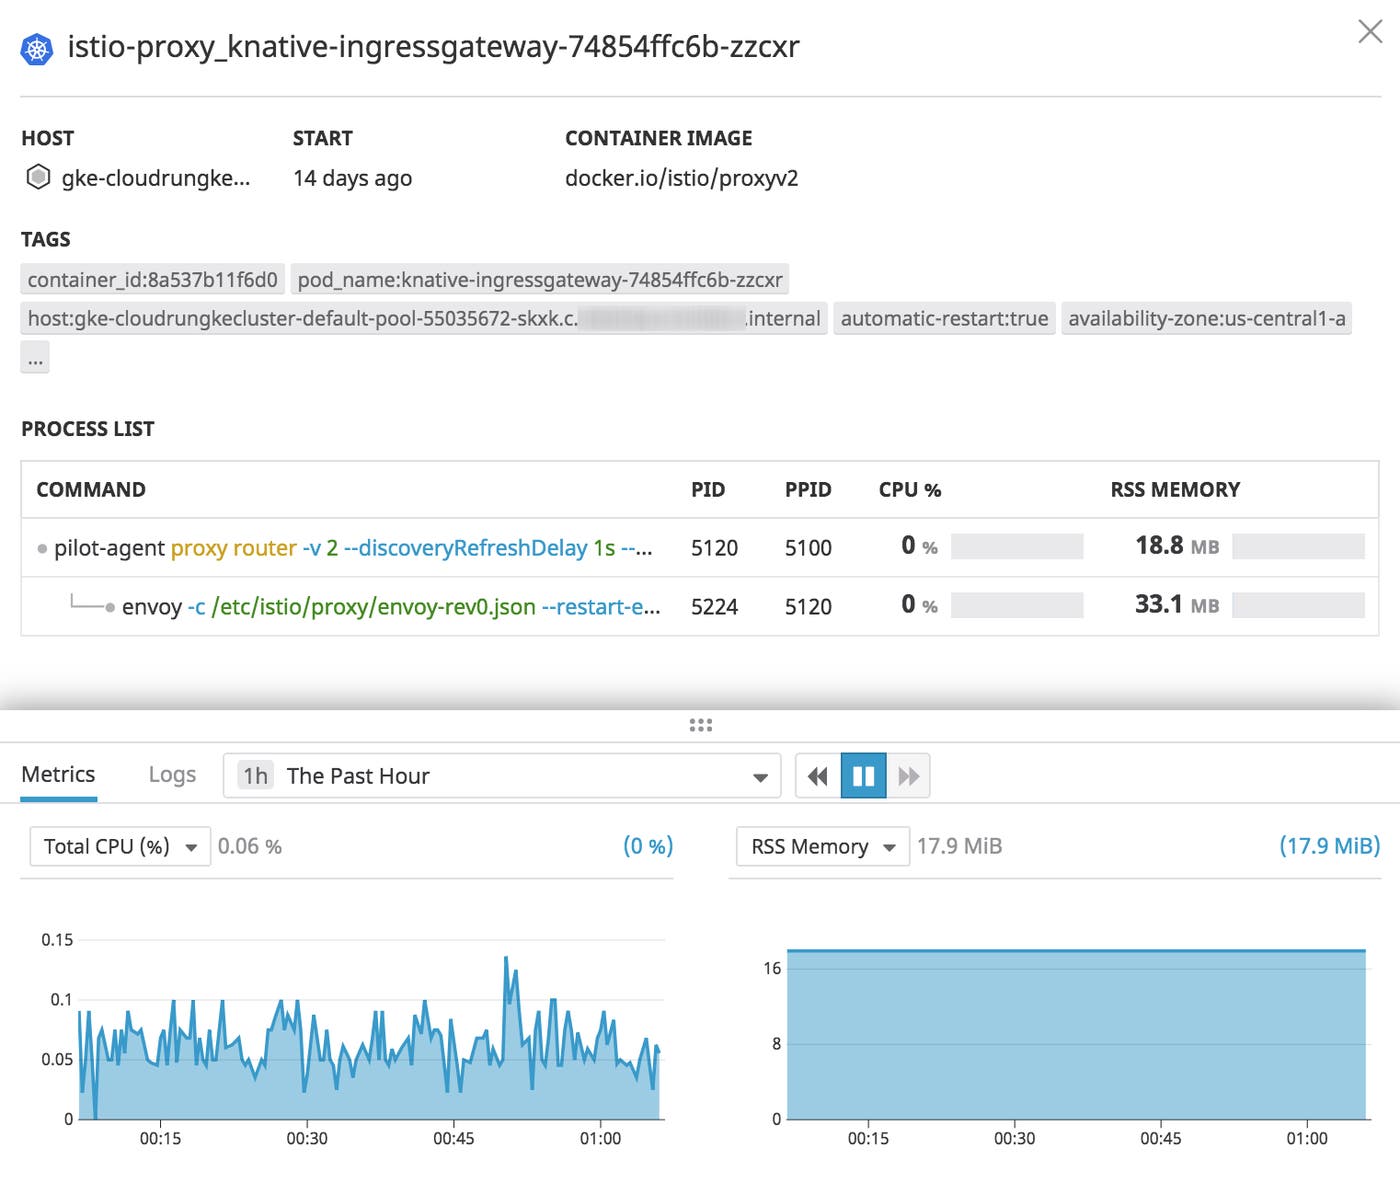
You can inspect any individual container to see high-resolution CPU and memory metrics, real-time container logs, and the full process tree running inside the container.
In your data center and in the cloud
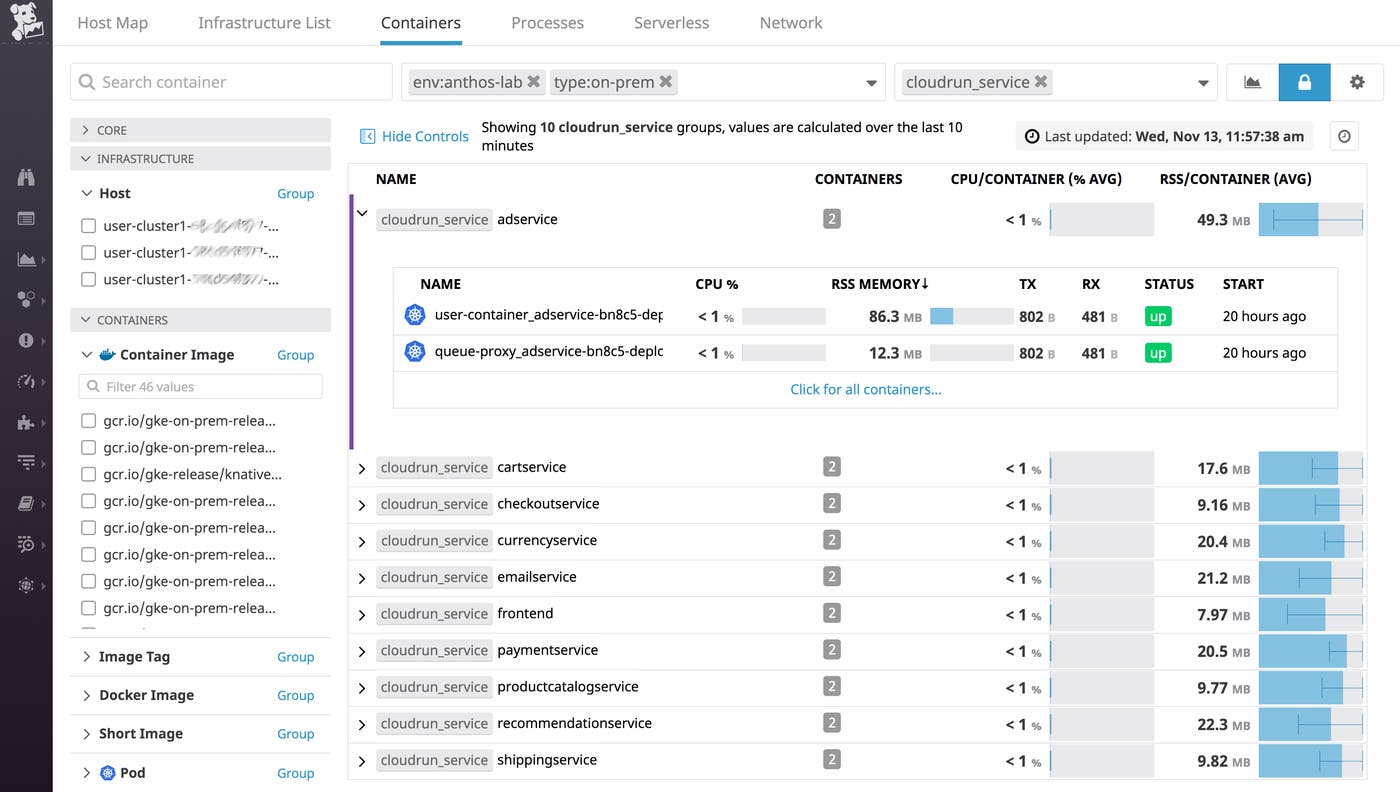
Anthos isn't limited to managing your GKE clusters. Anthos deployed on VMware lets you manage on-premise clusters using the Google Cloud Console, so you can deploy Cloud Run-managed pods within your own data center. The Cloud Run integration automatically collects the metrics and logs generated by your application, and Datadog's vSphere integration lets you monitor your infrastructure's resource utilization so you can graph and alert on CPU, disk, memory, and network usage metrics. You can even publish vCenter Server events automatically in your team's Slack channels and Pagerduty services.
And you can seamlessly monitor your on-premise and cloud infrastructure in a single platform. Cloud Run for Anthos supports hybrid infrastructure, so Datadog gives you visibility into the infrastructure in your own data center alongside your cloud-based clusters. If your data is local and your workloads are in a GKE cluster, for example, you can view and alert on the performance of all your infrastructure in Datadog.
No nodes, no problem
If you use the fully managed version of Cloud Run, Google Cloud manages and automatically scales the underlying infrastructure needed to handle your application’s load. Since the servers powering your service aren’t exposed, the Datadog integration gathers metrics and logs via brand-new integrations with Google Cloud monitoring APIs rather than from the Datadog Agent. Whichever flavor of Cloud Run you choose, Datadog provides comprehensive visibility into your container workloads.
Once you install the Google Cloud integration, metrics for your Cloud Run revisions (deployments of a specific service) will be available in Datadog under the gcp.run.* namespace. You can group, filter, and query your Cloud Run metrics using automatically generated tags such as region, configuration_name, revision_name, and service_name, and visualize them alongside data from the rest of your Google Cloud environment.
Audit logs
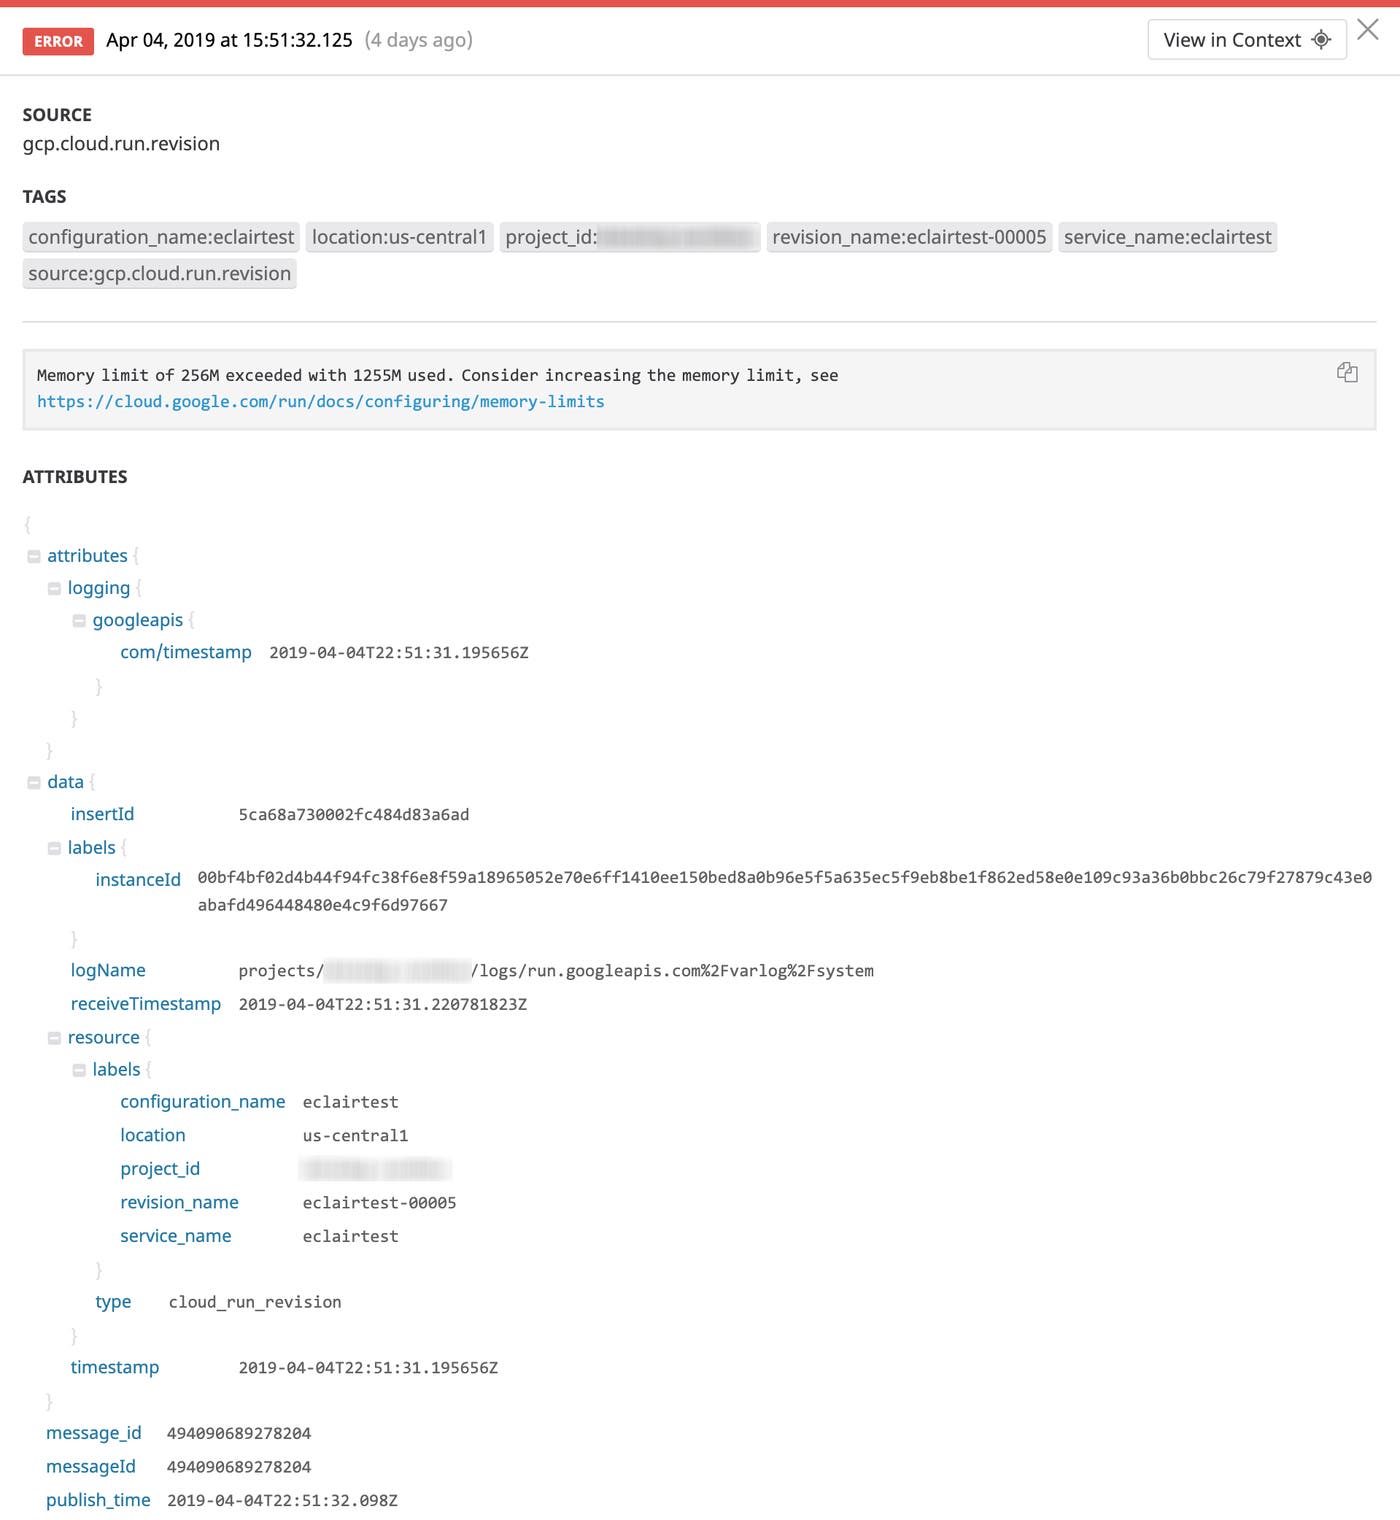
Cloud Run also exposes rich audit logs so you can keep close tabs on the activity surrounding your services, revisions, and configurations. You can send these logs into Datadog using our Stackdriver Logs integration, so you can monitor and analyze them alongside the logs from the rest of your Google Cloud services.
Datadog’s prebuilt processing pipeline for Cloud Run logs automatically parses out important attributes from your logs so you can search, filter, and group them by the data that matters to you most.
Get started today
Whether you're building new workloads on top of Google Cloud Run or migrating existing Kubernetes workloads to Cloud Run on an Anthos GKE cluster, you can start monitoring your containers and services in minutes by setting up our Cloud Run integration. Visit our documentation for Cloud Run or Cloud Run for Anthos to get started.
If you aren't already using Datadog to monitor your infrastructure and applications, you can start today with a 14-day free trial.
