Jordan Obey
Juniper Networks provides a range of IT network and security devices, including routers, switches, access points, and firewalls. As you scale your on-prem infrastructure with potentially thousands of devices distributed across multiple locations, getting visibility into your entire network can easily become a pain point. The larger your fleet of devices becomes, the more challenging it is to keep your data centralized so when an issue arises, you can quickly determine the health and performance of any of your devices.
Datadog’s Network Device Monitoring now supports Juniper devices, enabling you to collect metrics from your on-prem and virtual Juniper devices so you can ensure your IT infrastructure is performing optimally and maintains its health even at scale.
Collect and visualize Juniper metrics from SNMP
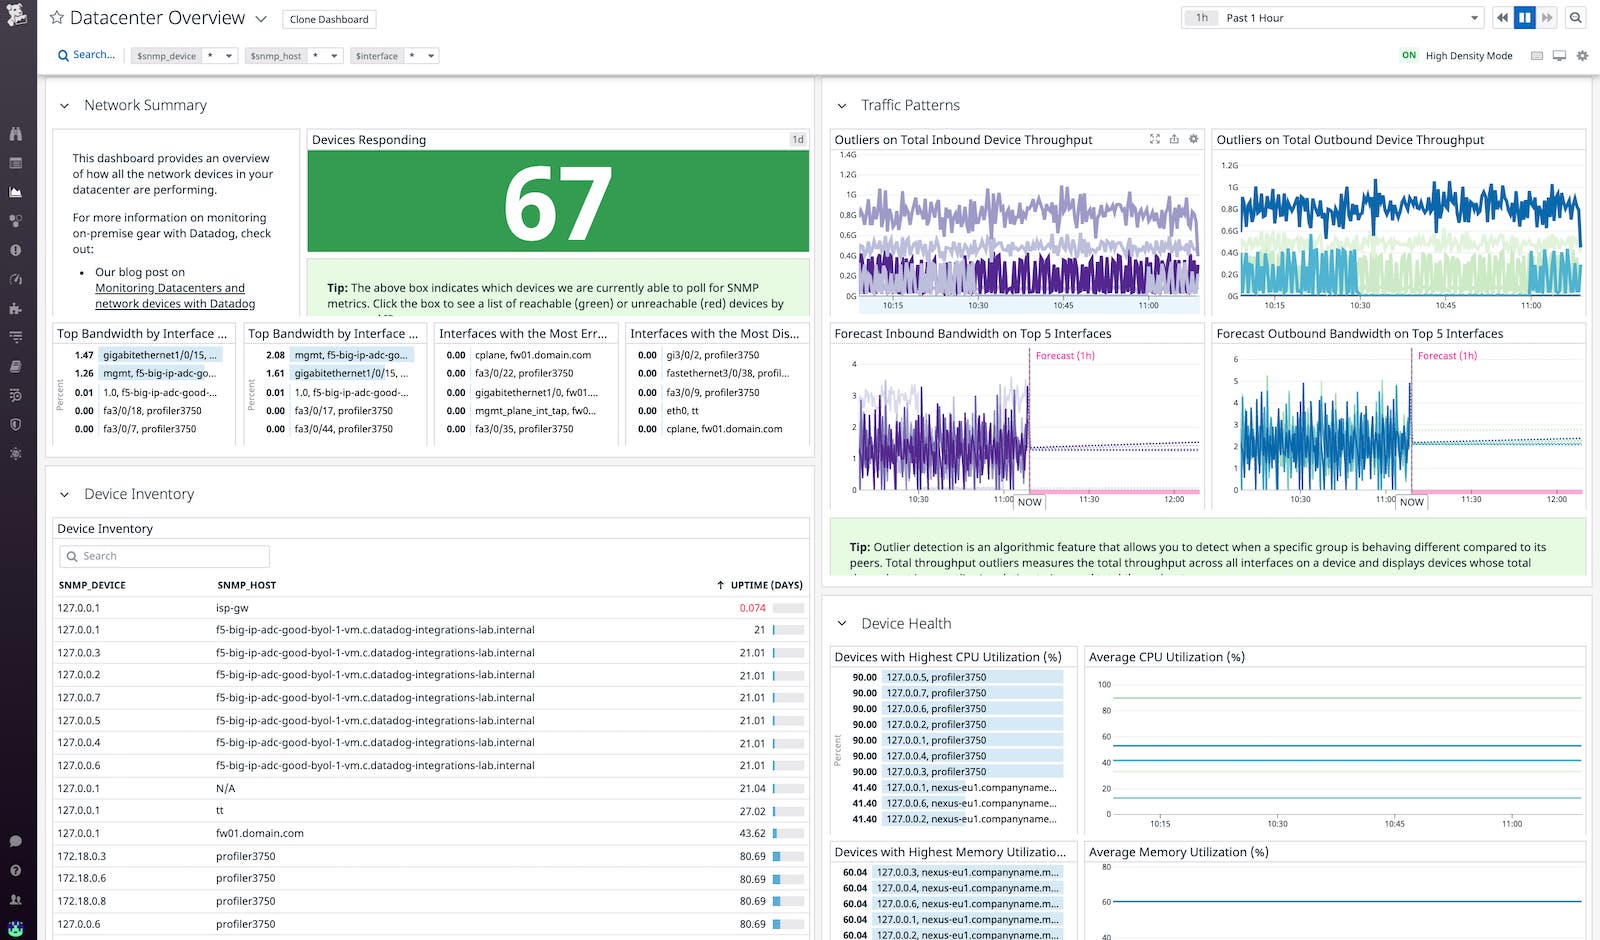
After you enable the Juniper integration, Datadog’s device autodiscovery will automatically recognize and collect metrics from all of your Juniper devices alongside those from other vendors we integrate with, including Cisco, Dell, and F5. You can then view your Juniper metrics in our out-of-the-box Datacenter Overview dashboard, which provides a centralized, high-level view of health and performance metrics across your entire network.

Datadog automatically tags your Juniper metrics with details about the devices emitting them. This includes device-level metadata like hostname and chassis port name, as well as broader tags like network name and geographic location. You can use these tags to group, filter, and sort through your devices, letting you contextualize your monitoring data and identify which devices or subset of devices are experiencing problems.
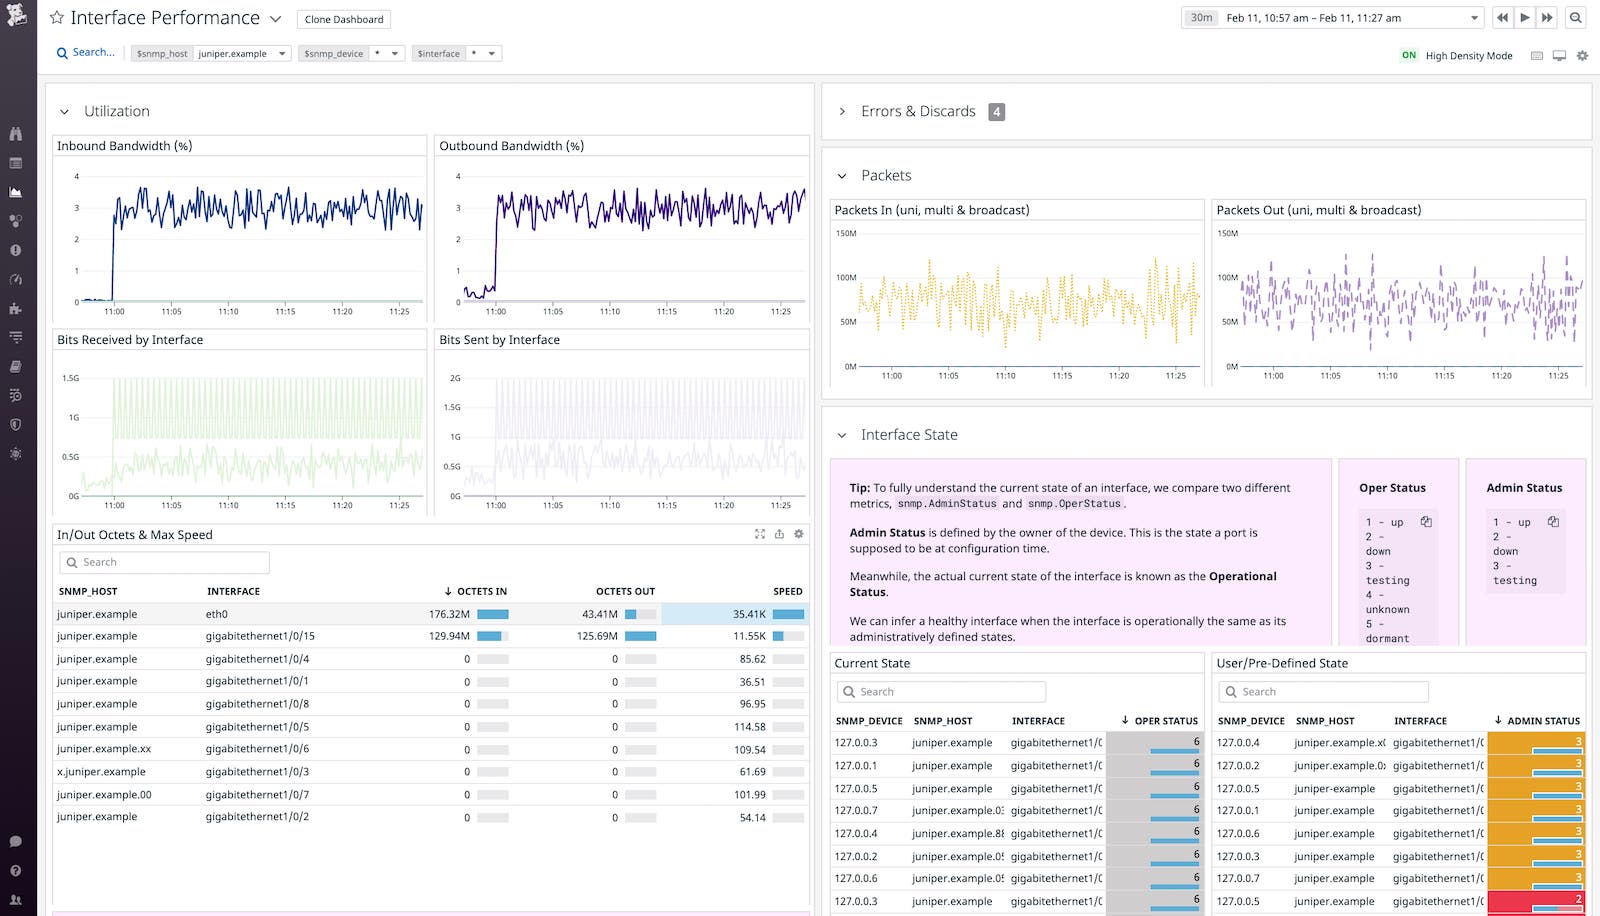
You can also view Juniper metrics on the Interface Performance dashboard. This dashboard provides you with visibility into device-level throughput by tracking key metrics like inbound and outbound bandwidth and packets in/out so you can quickly determine if a particular device is experiencing a bottleneck.

Hone in on key Juniper metrics alongside other network infrastructure
In addition to letting you monitor SNMP metrics that are common across all network devices like TCP and UDP statistics, our new integration enables you to dig deeper into key metrics that are specific to your Juniper devices like the total number of dropped packets in a queue (snmp.jnxCosIfsetQstatLpNonTcpRDropPktRate). You can also view metrics from your virtual Juniper infrastructure. For instance, Datadog helps you ensure the health and performance of your virtual chassis by enabling you to view their total number of packets received per port, per second (snmp.jnxVirtualChassisPortInPkts1secRate).
To identify problems with your network before they spread, you can set alerts to be notified of issues and start troubleshooting immediately. For example, because an increase in the total number of collisions on a virtual port could lead to an increase in network latency, you can alert on the total count of collisions on the virtual chassis port (snmp.jnxVirtualChassisPortCollisions) to determine if you need to make changes to your network infrastructure.
Get a full view of your corporate IT infrastructure today
With our new integration and Network Device Monitoring, you can easily monitor and visualize metrics from Juniper devices within your on-prem or hybrid network alongside the rest of your IT infrastructure. If you have a Datadog account, you can get started here. Otherwise, sign up today for a 14-day free trial.


