Bowen Chen

Karl Kalash
JumpCloud is a cloud-based directory platform that provides a unified approach to Active Directory and LDAP services centered around user authentication and network management. Using JumpCloud, companies can manage and provision user access to software, systems, and networks; enforce compliance with audit trails; and provide a unified login experience through single sign-on (SSO). As a cloud-native platform, JumpCloud enables a remote and flexible form of IT management by providing domainless security solutions for traditional directory needs.
We’re excited to announce that Datadog now integrates with JumpCloud, enabling you to ingest all of your JumpCloud event logs for monitoring, visualization, and long-term retention alongside the rest of the data across your environment. In this blog post, we’ll look at how you can create dashboards to track changes in your network over time; quickly search, filter, and sort your logs for ad hoc investigations; and flag non-compliant user activity with Datadog’s out-of-the-box (OOTB) Cloud SIEM rules.
Visualize your event logs with dashboards
Once you’ve configured Datadog to pull logs from JumpCloud using our integration, you can begin to create dashboards to observe trends and changes in user behavior. Datadog’s log processing pipeline automatically parses and extracts attributes from your JumpCloud logs, such as the type of database operation (db.operation), HTTP response status codes (http.status_code), and error types (error.kind), enabling you to track common operations and errors within your environment. After you enable the integration, Datadog populates an OOTB dashboard that provides a broad view of key user activity, such as the top event types and the top users by event count.
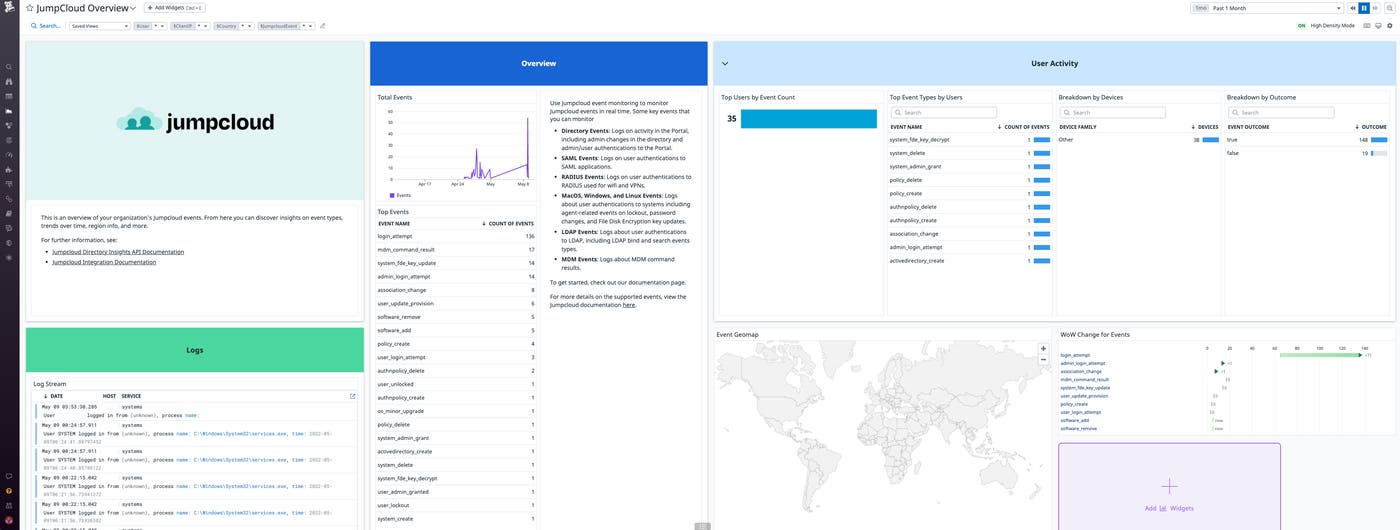
Security Assertion Markup Language (SAML) is a protocol that authenticates users to different web-based applications and is a central aspect to JumpCloud’s goal of providing a single, core identity for your network. Using SAML, JumpCloud enforces SSO so users can securely access web apps within your organization’s network. You can use Datadog to generate log-based metrics from SAML authentication logs; metrics like user latency, user authentication success rate, and the total number of requests give you insights into the performance of your authentication API and the type of SAML requests received. By creating a custom dashboard, you can choose to include widgets that showcase these metrics alongside data from other downstream integrations in your environment. For example, if you use JumpCloud RADIUS servers to secure your Juniper devices, you’re able to monitor both platforms within a single dashboard.
Datadog also collects logs on changes to your directory portal—such as when an admin is created or a file is changed—and RADIUS events. With JumpCloud, customers can deploy secure RADIUS servers and eliminate shared credentials using core identities. You can easily build custom dashboards that enable you to track user authentications to your RADIUS servers to identify, for example, when your wireless networks are experiencing high volumes of traffic. View our documentation for a full list of the types of events Datadog pulls from JumpCloud.
Maintain compliance and network security with audit logs
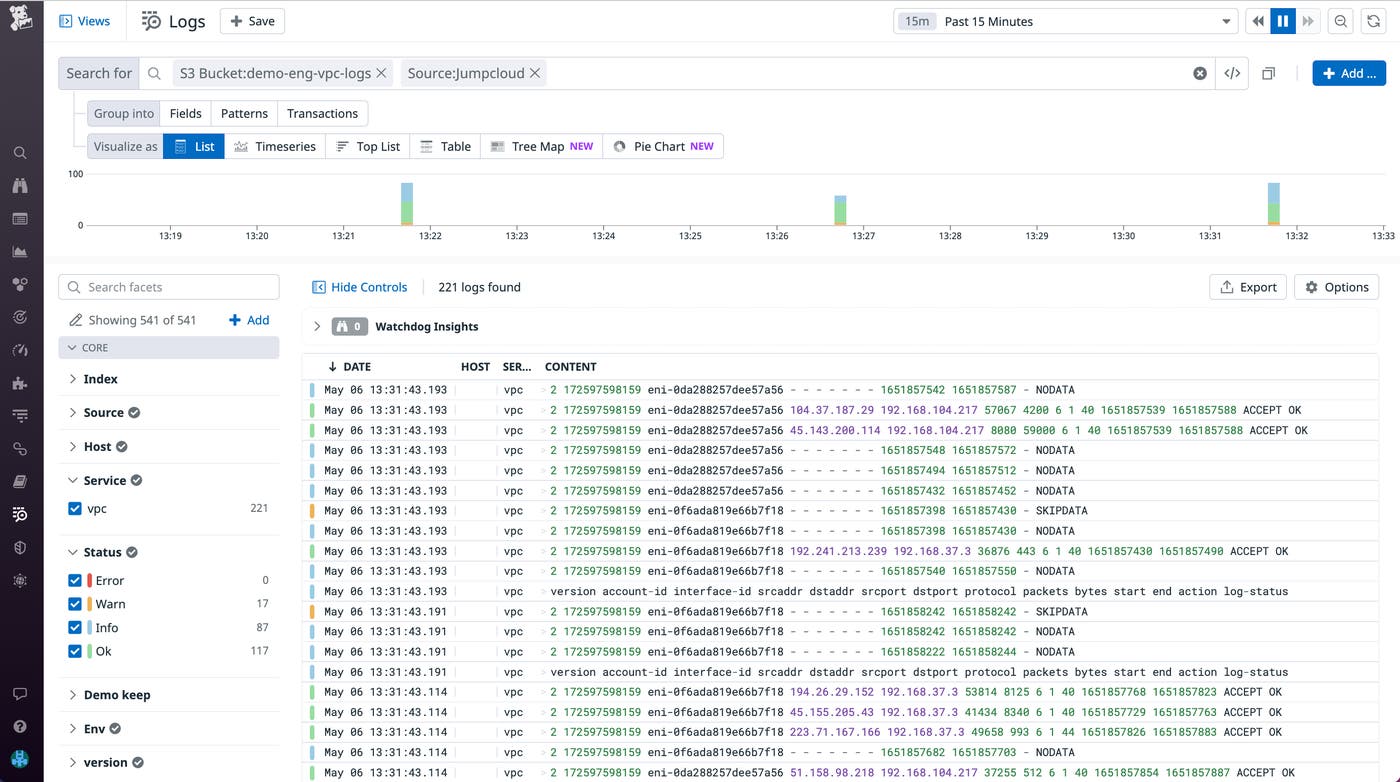
Achieving compliance with data protection guidelines like SOC2 Type II and ISO 27001 can quickly become an auditing nightmare for organizations storing and using large amounts of user information. Since JumpCloud creates a unified login experience through SSO, a centralized trail of each user’s application activity is logged; this saves companies time spent compiling audit records by offering a single place for identifying how users are interacting with different services. Using Datadog’s Log Explorer, you can filter your logs by attributes such as user IDs (usr.id) and HTTP request methods (http.method) to surface logs surrounding individual users and HTTP requests for security reports or internal audits. Tracking overall trends across your environment can help you flag unusual behavior, which you can dive deeper into with logs.
Your JumpCloud logs will be normalized with the rest of your Datadog logs, enabling your search queries to span across different sources, such as AWS services and CDNs. In the example below, we’ve used the Log Explorer to filter for all JumpCloud logs surrounding access to a specific S3 bucket. You can also keep your logs for up to 15 months with Datadog Flex Logs or forward them to your cloud storage for future retrieval with Log Rehydration™.
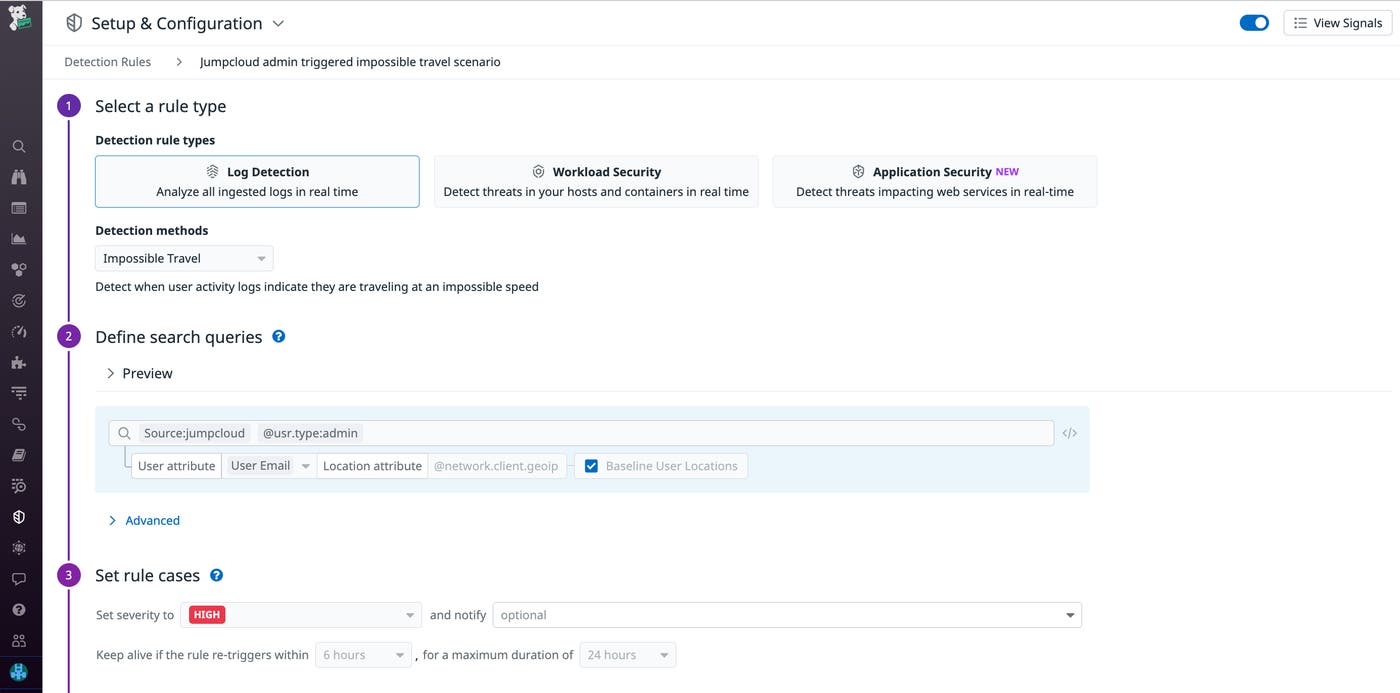
Datadog Cloud SIEM automatically analyzes your JumpCloud logs to search for any unusual behavior. Our OOTB JumpCloud rules detect impossible travel scenarios and when an administrator authenticates without multi-factor authentication (MFA). If Datadog detects any instances violating these rules, it will generate a Security Signal with key context for investigations, such as when the signal was first and last seen, log samples indicating why the signal was triggered, and related signals to assist with triaging your investigation. By configuring threat detection rules, you can stay ahead of targeted attacks to your cloud directory and uncover any insecure misconfigurations. If you’d like to safeguard against specific scenarios, you can create custom detection rules to measure thresholds, detect behavioral anomalies, and be notified when your log attributes are changed.
Gain deep visibility into your JumpCloud directory
Datadog provides deep visibility into your JumpCloud network with custom and OOTB dashboards, audit logging and compliance features, and cloud security rules. With Log Management, you can quickly surface and archive important event logs for when you need them and compare them alongside logs and other data from the rest of your environment. Install our integration today to begin monitoring JumpCloud with Datadog. If you aren’t already a customer, get started with a free 14-day trial.


