Emily Chang

Jordan Obey
Jenkins is an open source, Java-based continuous integration server that helps organizations build, test, and deploy projects automatically. Jenkins is widely used, having been adopted by organizations like GitHub, Etsy, LinkedIn, and Datadog.
You can set up Jenkins to test and deploy your software projects every time you commit changes, to trigger new builds upon successful completion of other builds, and to run jobs on a regular schedule. With hundreds of plugins, Jenkins supports a wide variety of use cases.
As shown in the out-of-the-box dashboard below, our Datadog plugin provides more insights into job history and trends than Jenkins’s standard weather reports. You can use our integration to:
- Set alerts for important build failures
- Identify trends in build durations
- Correlate Jenkins events with performance metrics from other parts of your infrastructure in order to identify and resolve issues
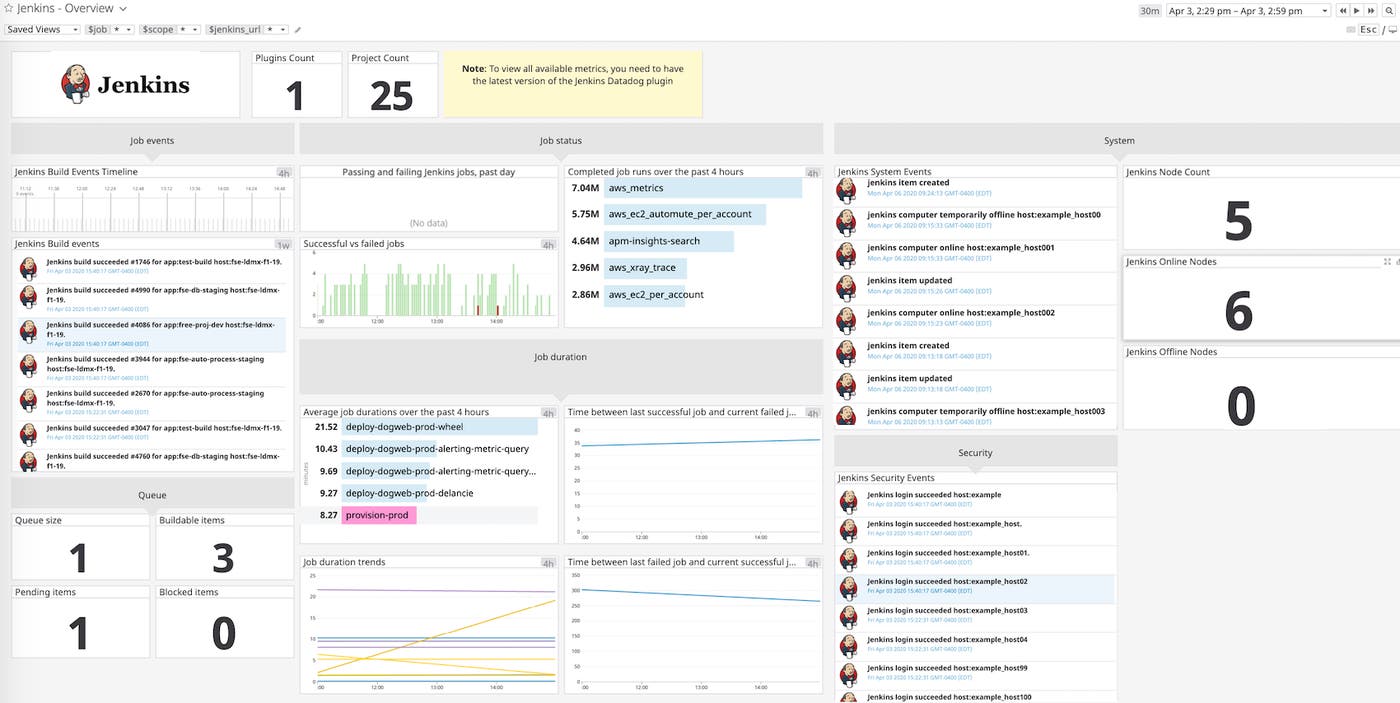
To provide even further visibility into your Jenkins environment, we’ve recently enhanced our integration to collect real-time system and security events, as well as dozens of additional metrics like queue size and executor counts. This enhancement also gives you the option to collect Jenkins build logs by configuring the plugin to forward data through the Datadog Agent.
Get insight into Jenkins queues
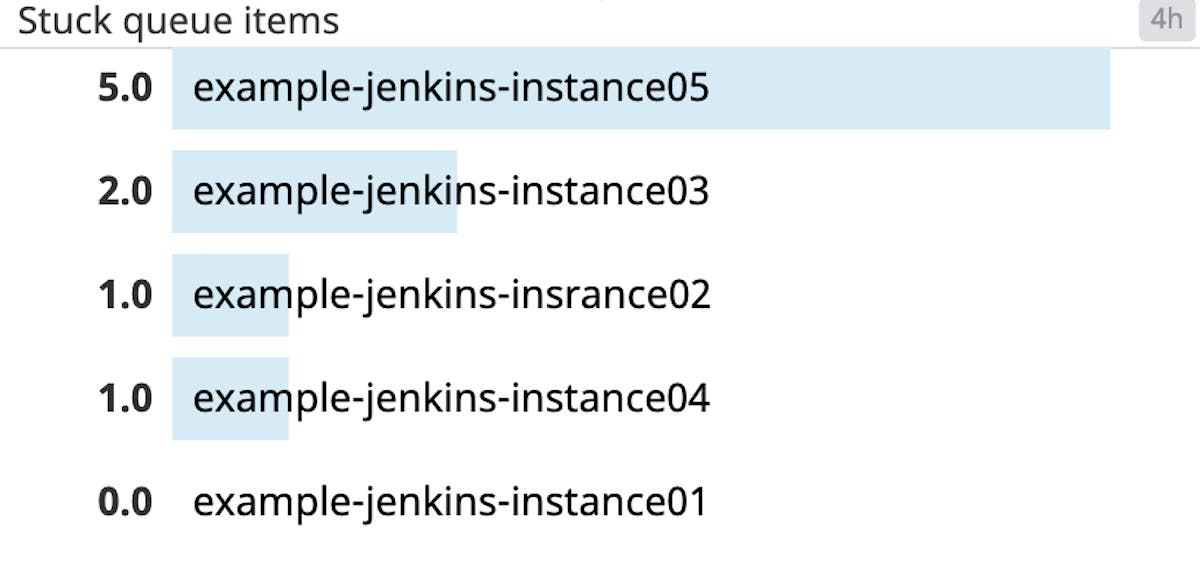
Builds in Jenkins are scheduled as items in a queue. With Datadog, you can track the total number of items in a queue, how many are pending, and how many are stuck (waiting for an executor) or otherwise delayed. Every Jenkins event, metric, and service check is auto-tagged with jenkins_url, job, result, and branch (if applicable). You can also create custom tags for the name of the application you’re building, your particular team name (e.g., team=licorice), or any other info that matters to you.
For example, you can use the jenkins_url tag to compare queue sizes across Jenkins instances and identify where potential performance issues are occuring. For example, you’ll be able to easily see if one Jenkins url has many more stuck items in its queue and is not executing builds, so you’ll know where to provision more memory or add an executor if necessary.
Track Jenkins system and security events
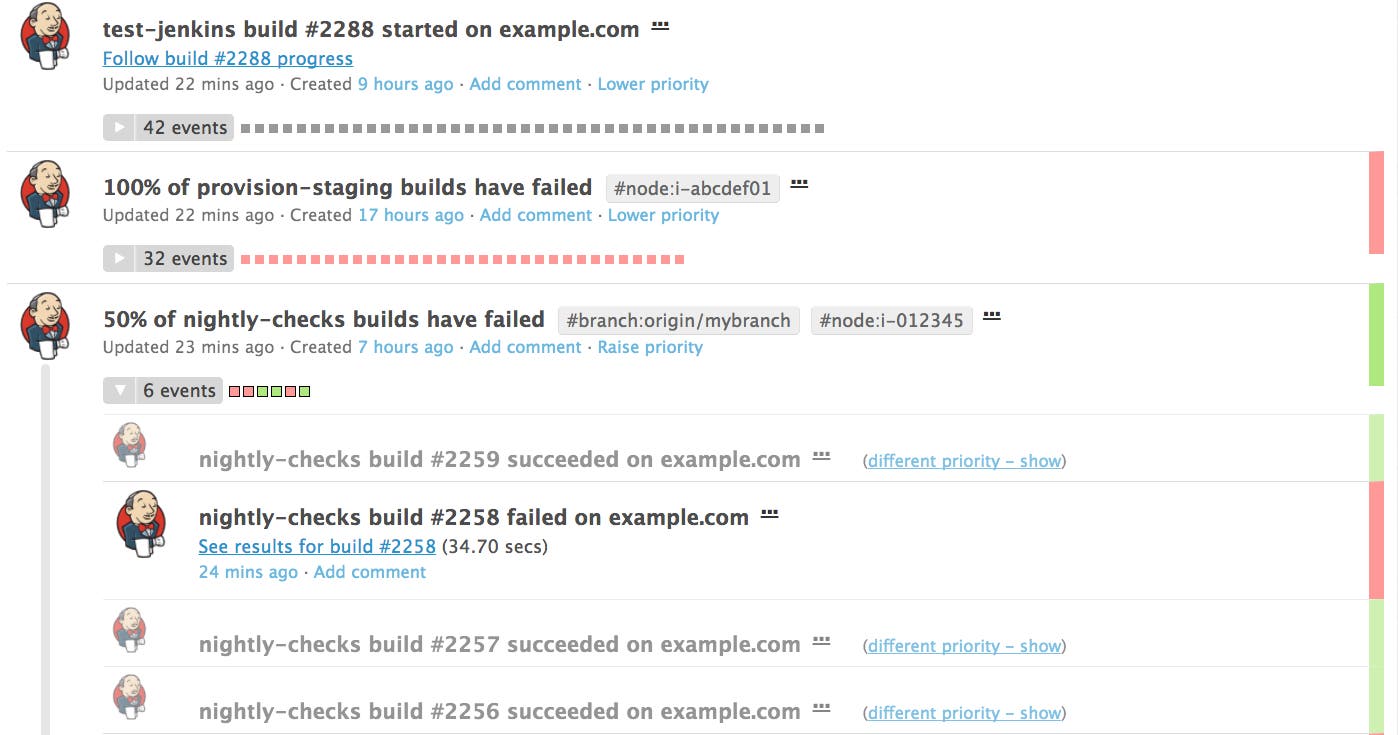
Once you install the Jenkins-Datadog plugin, Jenkins activities will start appearing in your Datadog event stream. In addition to build status updates (when a build starts, fails, or succeeds), you’ll be able to track system and security events in real time.
These events provide a window into noteworthy activity on your Jenkins instances, so you can ensure that Jenkins is secure and running as expected. For instance, if many login failures appear in quick succession, it could mean a user is trying to access Jenkins with misconfigured credentials—or it could be a sign of malicious activity. To quickly investigate this activity as soon as it occurs, you can create an alert to notify you when the count of login failures exceeds a set threshold in a short amount of time (e.g., less than 5 minutes).
Monitor Jenkins build status in real time
Datadog’s out-of-the-box dashboard lets you see what percentage of builds failed within the same job, so that you can quickly spot which jobs are experiencing a higher rate of failure than others. Remember to exclude any jobs you don’t want to track by indicating them in your plugin configuration.
Datadog’s Jenkins dashboard gives you a high-level overview of how your jobs are performing. The status widget displays the current status of all jobs that have run in the past day, grouped by success or failure. To explore further, you can also click on the widget to view the jobs that have failed or succeeded in the past day.
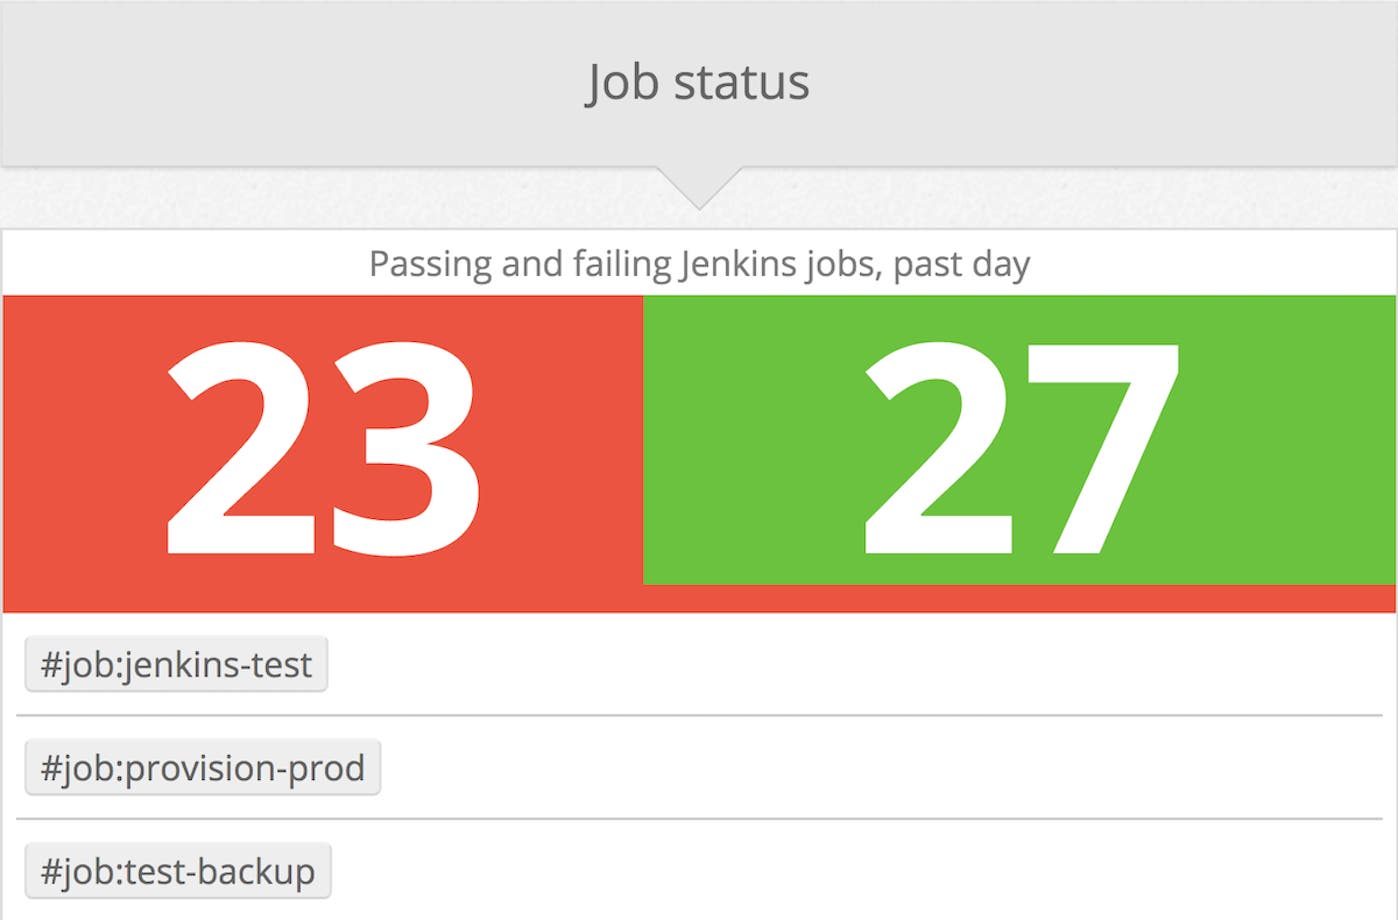
You can also see the proportion of successful vs. failed builds, along with the total number of job runs completed over the past four hours.
Visualize Jenkins metrics like build status and job duration with Datadog.
If you’ve configured the plugin to forward data through the Datadog Agent, you have the added option to collect Jenkins build logs and monitor them in the same platform as all your Jenkins metrics.
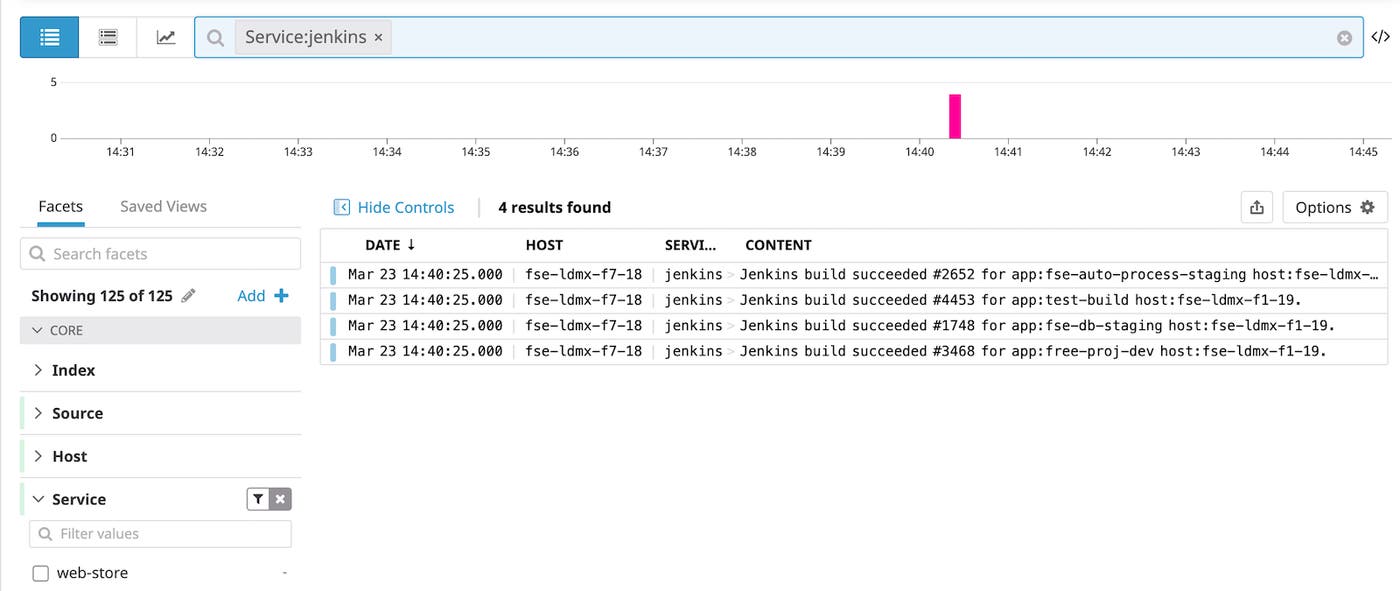
Datadog also enables you to correlate Jenkins logs with application performance metrics to investigate the root cause of an issue. For example, the screenshot below shows that average CPU on the app servers increased sharply after a Jenkins build was completed and deployed (indicated by the pink bar). Your team can use this information as a starting point to investigate if code changes in the corresponding release may be causing the issue.

Visualize job duration metrics
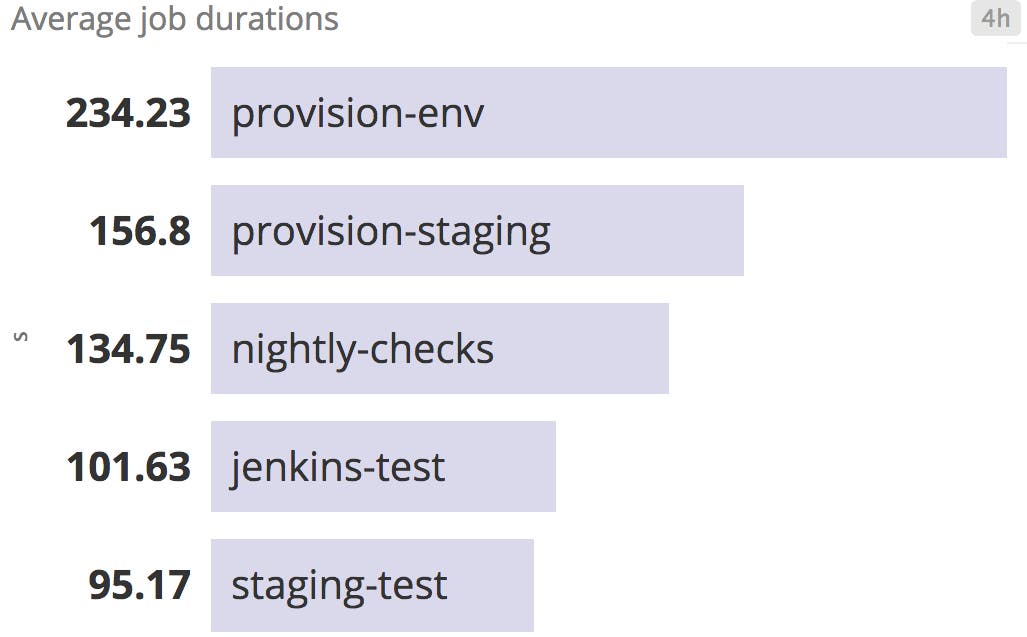
Every time a build is completed, Datadog’s plugin collects its duration as a metric that you can aggregate by job_name, jenkins_url, or any other tag, and graph over time. In the screenshot below, we can view the average job durations in the past four hours, sorted in decreasing order:
You can also graph and visualize trends in build durations for each job by using Datadog’s robust_trend() linear regression function, as shown in the screenshot below. This graph indicates which jobs’ durations are trending longer over time, so that you can investigate if there is a problem. If you’re experimenting with changes to your CI pipeline, consulting this graph can help you track the effects of those changes over time.

Start monitoring Jenkins jobs and builds
If you’re already using Datadog, you can start monitoring Jenkins jobs by following the instructions here to download the Datadog plugin. You can configure the plugin to submit Jenkins data to Datadog either through HTTP or the Datadog Agent. Jenkins logs are only available through the Datadog Agent, so we recommend using this setup to get the most out of the integration. If you’re not using Datadog yet, here’s a 14-day free trial.


