Ernest Mueller
Do you run a large or busy service that you monitor with Datadog or do you find yourself struggling to keep track of everything going on in your infrastructure? In my last role at a large software as a service company providing ratings and reviews functionality to brand and retail Web sites, we had a dozen teams all using the same Datadog account to monitor many different services, with thousands of servers and tens of thousands custom metrics. This resulted in hundreds of events each day within our infrastructure, such as hotfixes, configuration changes and servers being powered on or off. Any one person only cared about a small number of these events, and our teams were finding it challenging to pull those few key events to track from hundreds each day.
We were able to cut through the noise using the Datadog Events Stream, which creates a timeline of events relevant to your system. An event is defined as anything notable happening in your system at a moment in time such as an alert firing, a build happening, or an outage message from an integrated SaaS supplier.
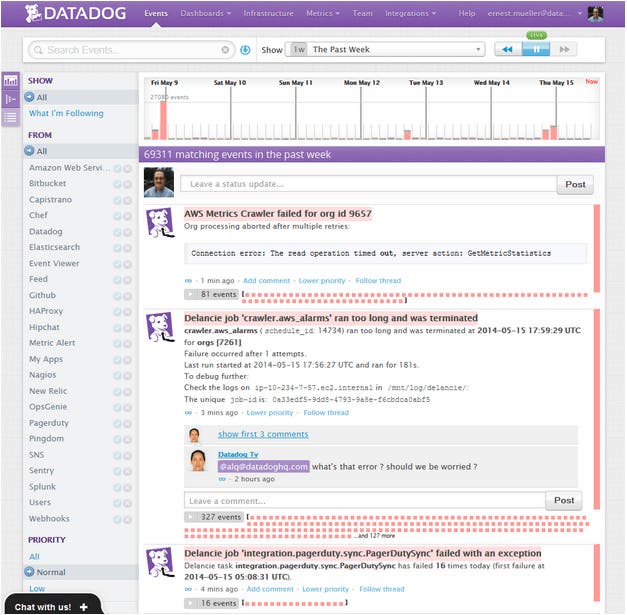
While the Events Stream allows you to visualize all of the events happening in your infrastructure and collaborate with team members around those events, it can get unwieldy when there are a lot of events per unit of time.
What if you want to see the historical alerts on one of your services or servers?
What if you don’t want to see other teams’ activity in the Events Stream view?
Luckily, the Events Stream’s search and filter functionality allows you filter out some of the event “noise” so you can focus on the events you need to address at that given time.
Focus on the events that matter to you right now
The above Events Stream example from Datadog’s own account has over 69,000 events recorded from this week alone. The Events Stream combines, or threads, similar events into one message.
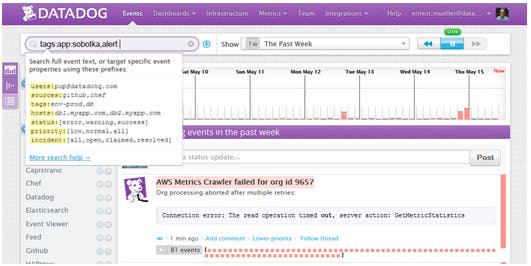
You can leverage the Events Stream’s search and filter functionality to see just events for one specific service or server. For example, if I want to see alerts for the “sobotka” service, I would put tags:app:sobotka,alert in the search box:
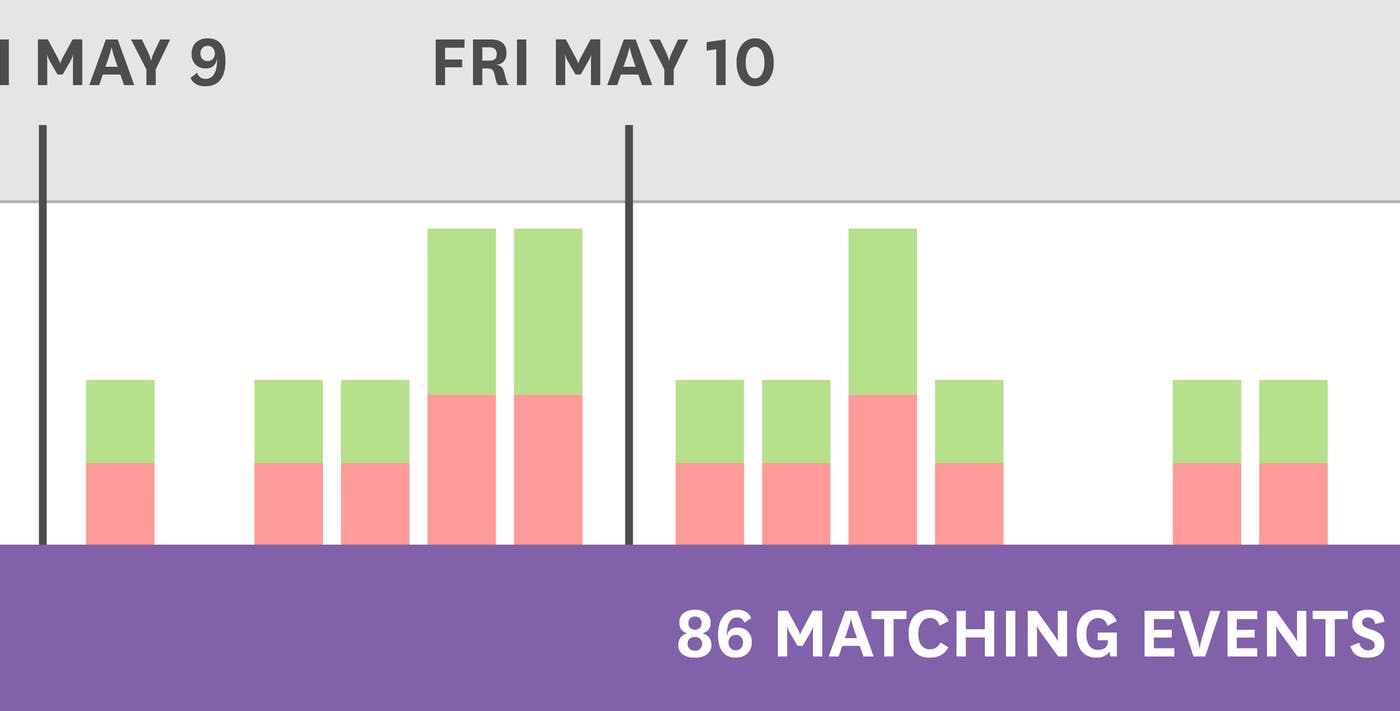
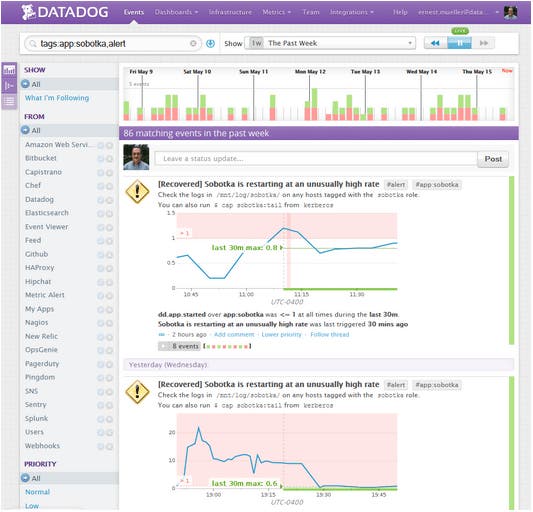
The Events Stream now displays only Sobotka alerts which narrows down the events from those 69,000 system-wide events to 86 relevant events in the last week. This allows me to delve into those specific alerts without contending with the rest of the noise. The search syntax is rich and it’s easy to add/remove items in order to zoom in on the desired scope of events.
Save your search and filter for future use
The Events Stream allows you to save your search criteria. Once you’ve created your search criteria, click on the down arrow next to the search field and then click on “Save this search.” This will save your search so you can access it later or view it in a ScreenBoard.
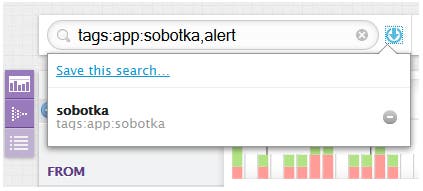
For example, our teams were required to tag their instances and metrics with team, service, and environment. With this tagging, we were able to search on our teams’ tag and create a saved search which showed events from our own team. This search became our Events Stream default view. Since our services were all interlinked into one product, it was extremely valuable to have everything in one Datadog account to see correlations when we were looking into a larger system-scoped issue. But in this circumstance, we could limit our view to the events that are most important to us.
You can also limit your view using the event filters on the left-hand side of the Events Stream.
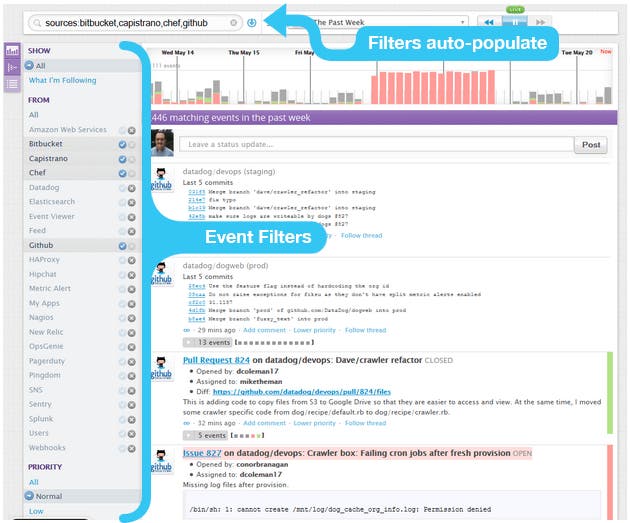
These filters allow you to manipulate your data sources and priority to add or remove specific data sources from your Events Stream. For example, if you only want to monitor release activity, you can filter on the source commits and deployment messages as shown above. Note that when you select the filters it populates the search box, which means you’re able to save this search as a saved search for future use.
You’re also able to include your filtered Events Stream in a ScreenBoard to create a customized visualization of your saved, filtered events. Here is an example of a ScreenBoard that has several kinds of event filters on it - two as Events Streams, one as an event timeline, and one as an alert graph.
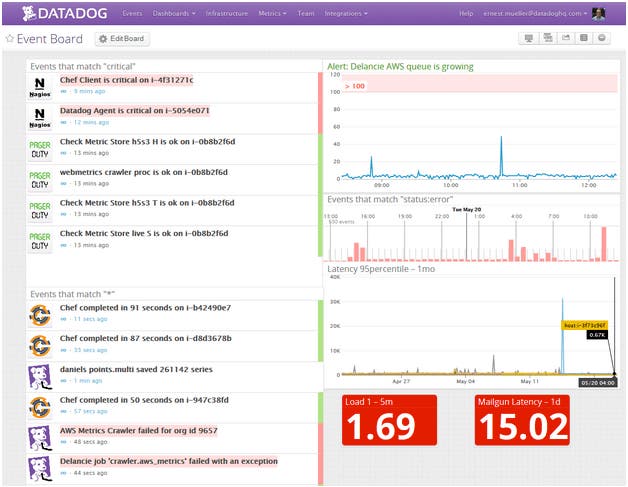
Each element is configured with its own search string using the same syntax as the search in the Events Stream.
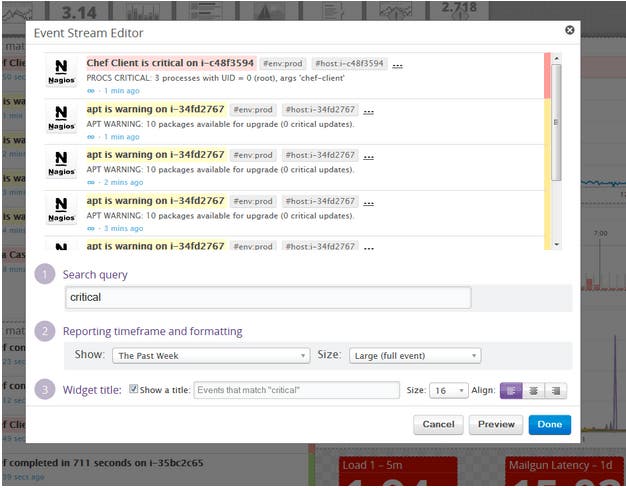
Customize your Events Stream with filtering
The Datadog Events Stream is a great way to see what events are happening across your environment. You’ve seen several ways to search and filter your events so you can focus on events that need your attention at any given time. You’re also able to save these filters for future access for use on customized ScreenBoards.
If you’re already using Datadog and have any questions about filtering the Events Stream, email us at support@datadoghq.com or ping us at @support in the Events Stream itself. If you’re not using Datadog and you’re interested in better visualization of your events and the rest of your infrastructure and application metrics, sign up for a free 14 day Datadog trial and check it out for yourself.
