Dhruv Sahni
IBM MQ is enterprise-grade message-oriented middleware (MOM). Previously known as MQSeries and renamed to WebSphere MQ, IBM MQ is known for its stability and reliability. Companies in industries ranging from financial services to retail to aviation use it as an integral part of their backend infrastructure.
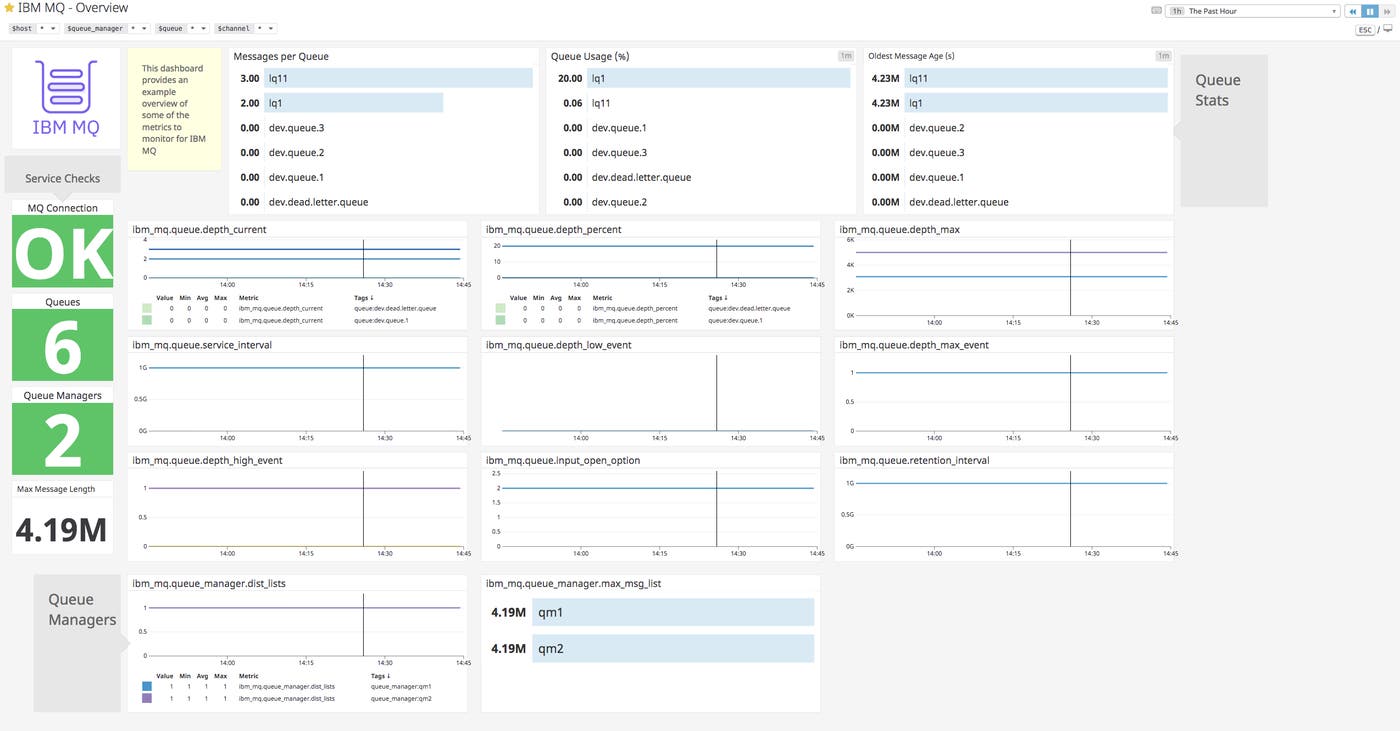
Datadog’s new IBM MQ integration enables users to collect key metrics and logs from their IBM MQ instances and visualize them with a customizable out-of-the-box dashboard. Combined with Datadog’s system-level checks and powerful monitoring and alerting capabilities, the new integration enables IBM MQ admins to get deeper visibility into the health and performance of their messaging infrastructure.

How IBM MQ works
At the heart of every IBM MQ instance is a queue manager, which is responsible for placing messages in the appropriate queues and transferring them to and from other queue managers via channels. Queues contain and store pre-processed messages, which can include text as well as binary data.
Data integrity is one of the core principles of IBM MQ, guaranteeing no loss of messages. If a message cannot be delivered, it is not dropped. Instead, it can be routed to a dead-letter queue for later retrieval. IBM MQ supports a variety of APIs and languages as well as a range of platforms and architectures, including mainframes (z/OS), UNIX (AIX, HP-UX, Solaris), Linux, and Windows.
Key MQ metrics to monitor
The Datadog IBM MQ integration tracks dozens of key metrics, providing insights into your queue managers, queues, and messages. In addition, the integration supports ingesting IBM MQ logs into Datadog so that you can easily parse for errors and set up alerts on keywords.
Queue managers, queues, and messages
A few key metrics for monitoring your IBM MQ instances include the depth of your queues, how much space your queues have for additional messages, and the age of a queue’s oldest message. Analyzing the queue depth (ibm_mq.queue.depth_current) over time allows you to scale your instances accordingly in order to prevent full queues, which can delay message delivery. The message age (ibm_mq.queue.oldest_message_age) helps you keep track of any stale messages within the queue that have not been processed yet. The integration also includes service checks that allow you to monitor the overall health of your queues and queue managers.
Dead letter queue alerting
Many types of queues should have messages continuously flowing through. The dead letter queue is an exception. Since it stores messages that cannot be routed to their correct destination, the presence of messages in the dead letter queue could indicate a larger issue (such as other queues filling up). With Datadog, you can create a monitor to alert you whenever a message falls inside the dead letter queue, so you can take action immediately.

Start monitoring IBM MQ with Datadog
Datadog’s IBM MQ integration lets you easily monitor and alert on important metrics and logs from your messaging infrastructure as well as more than 1,000 other technologies and services. If you’re already using Datadog, enable the integration to get immediate visibility into your message queue performance and throughput.
If you’re not already using Datadog, get started today with a free 14-day trial.


