Alexis Lê-Quôc
Docker is an emerging platform to build and deploy software using lightweight, pared-down virtual machines known as containers. By delivering easy-to-provision recipes for developers and bit-for-bit compatibility between environments, Docker is a popular solution to solve continuous delivery in modern infrastructure.
Like virtual machines before them, containers require a new monitoring approach. Luckily, if you are a Datadog user, you can now take advantage of our newest integration: Docker.
With our Docker integration you can monitor containers by running version 4.3.1 of the Datadog Agent. The integration configuration is, like all other agent-based integrations, a simple YAML file.
How Docker performance monitoring works
The simplest way to monitor Docker containers is to run the Datadog Agent on the host, where it can access container statistics. This is especially true if you are deploying Docker on existing, full-fledged Host OSes, along existing applications such as databases.
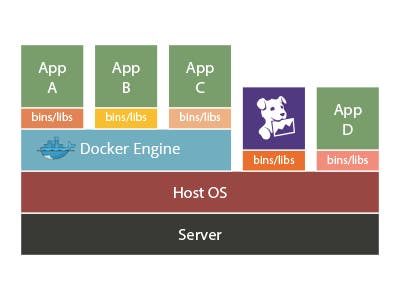
Since Docker uses existing kernel constructs (namespaces and cgroups) in order to run containers, the Datadog Agent uses the native cgroup accounting metrics to gather CPU, memory, network and I/O metrics of the containers every 15 seconds before they are forwarded to Datadog.
While this is the simplest way to monitor Docker, we also provide a “dockerized” version of the Agent if you want to run all of your software in containers. You can read more about it here.
Monitor many containers efficiently with tags
With easy-to-use, lightweight containers, you will likely dial up several times more running containers than the number of underlying physical or virtual hosts in your infrastructure. How do you then keep track and monitor them without spending time chasing after every single one of them? With tags.
Tags are the key to monitoring a lot of containers without additional effort. By default, the Agent will monitor your containers and turn the Docker “name”, “image” and “command” attributes into a “tag”.

Graph specific metrics with tags
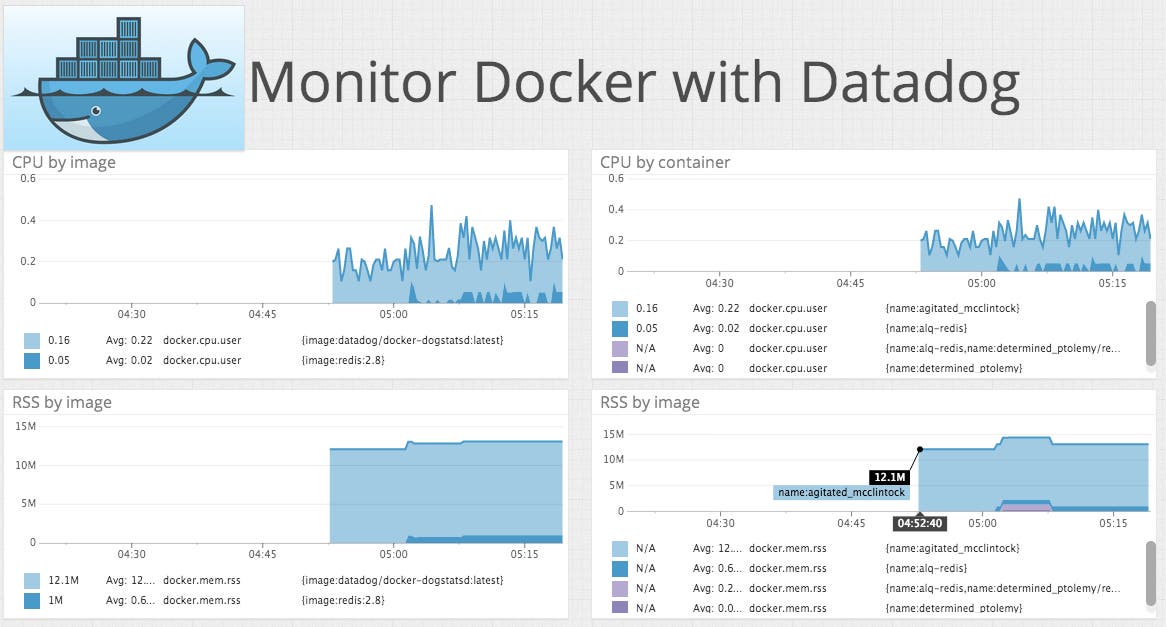
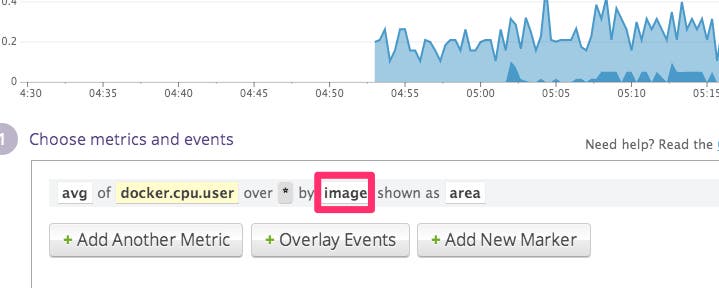
In Datadog, you define the metrics shown in dashboards and graphs based on one or many tags. This allows you to track specific metrics for many containers in aggregate. Using tags, you can easily create a graph for a metric drawn from all containers running a given image.
In the example below, we are showing the amount of CPU consumed, broken down by image.
Alerts
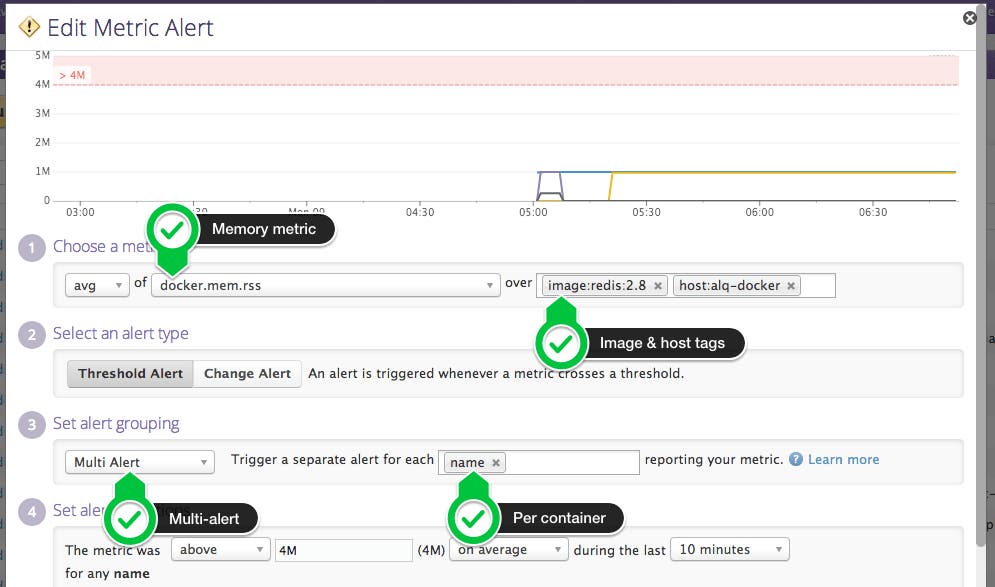
Tags are also very useful to define alerts that span clusters of containers. For instance, let us say that you are running a cluster of Redis containers and you want to be alerted when one of the containers is running out of memory.
Instead of defining one alert per container, you only have to create a multi-alert on the docker.mem.rss metric and Datadog will trigger an alert if any container misbehaves.
You can also mix and match tags to express more complex conditions. For instance, you can monitor all Redis containers running the redis2.8 image that run on host alq-docker with a simple tag selection:
Monitor your containers’ lifecycles
Since containers are designed to be as short-lived (or long-lived) as traditional OS processes, it can be very useful to track particular containers throughout their lifecycles.
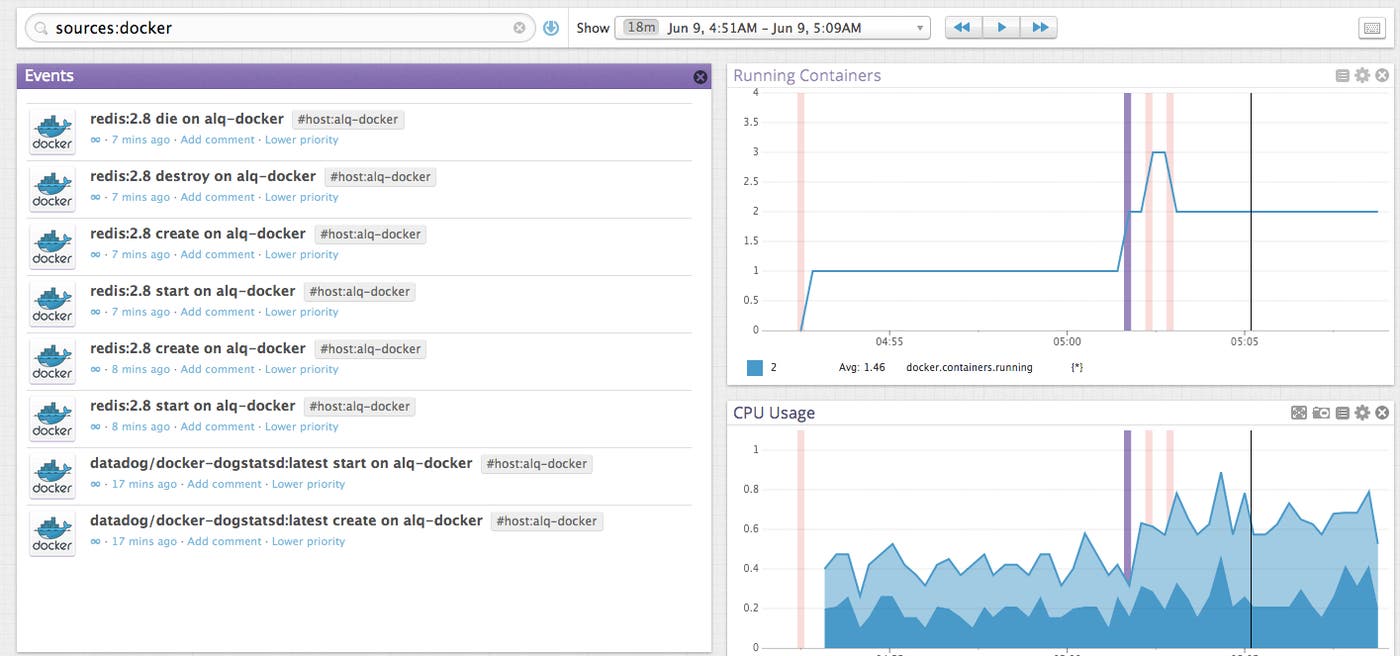
Much like any other meaningful event in your infrastructure, you can search for Docker container create/start/stop/destroy events using the Events Stream. Simply use “sources:docker” as the search filter.

You can also apply the same search to any TimeBoard to visualize Docker container events in the context of Docker and non-Docker metrics. In the following example, we overlay containers starting and stopping over memory and CPU metrics.
Explore Docker metrics
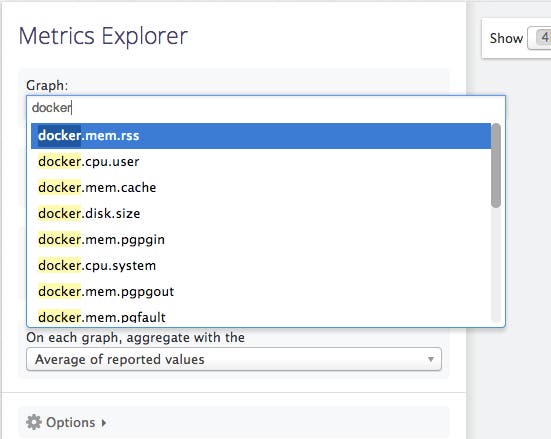
To explore the Docker metrics that are available, you can use the Metrics Explorer in Datadog and type “docker” in the first drop-down.
You can find detailed descriptions about all the metrics in Docker’s Runtime Metrics guide.
If you would like to easily visualize and alert on Docker metrics, try out Datadog for free with a 14-day trial. Metrics for the Docker engine, containers and underlying hosts will be immediately available after installing the Datadog Agent.
