
John Matson
Editor’s note: Redis uses the terms “master” and “slave” to describe its architecture. Datadog does not use these terms. Within this blog post, we will refer to these terms as “primary” and “replica,” except for the sake of clarity in instances where we must reference a specific resource name.
Since Kubernetes was open sourced by Google in 2014, it has steadily grown in popularity to become nearly synonymous with Docker orchestration. Kubernetes is being widely adopted by forward-thinking organizations such as Box and GitHub for a number of reasons: its active community, rapid development, and of course its ability to schedule, automate, and manage distributed applications on dynamic container infrastructure.
Kubernetes + Datadog
In this guide, we'll walk through setting up monitoring for a containerized application that is orchestrated by Kubernetes. We'll use the guestbook-go example application from the Kubernetes project. Using this one example, we'll step through several different layers of monitoring:
Collecting metrics with Autodiscovery: default check configurations
Collecting metrics with Autodiscovery: custom check configurations
Instrumenting applications to send custom metrics to Datadog
Collect Kubernetes and Docker metrics
First, you will need to deploy the Datadog Agent to collect key resource metrics and events from Kubernetes and Docker for monitoring in Datadog. In this section, we will show you one way to install the containerized Datadog Agent as a DaemonSet on every node in your Kubernetes cluster. Or, if you only want to install it on a specific subset of nodes, you can add a nodeSelector field to your pod configuration.
Analyze and aggregate Docker and Kubernetes metrics in context with Datadog.
If your Kubernetes cluster uses role-based access control (RBAC), you can deploy the Datadog Agent's RBAC manifest (rbac.yaml) to grant it the necessary permissions to operate in your cluster. Doing this creates a ClusterRole, ClusterRoleBinding, and ServiceAccount for the Agent.
kubectl create -f "https://raw.githubusercontent.com/DataDog/datadog-agent/master/Dockerfiles/manifests/cluster-agent/rbac.yaml"Next, copy the following manifest to a local file and save it as datadog-agent.yaml. For Kubernetes clusters that use RBAC, the serviceAccountName binds the datadog-agent pod to the ServiceAccount we created earlier.
apiVersion: apps/v1kind: DaemonSetmetadata: name: datadog-agent namespace: defaultspec: selector: matchLabels: app: datadog-agent template: metadata: labels: app: datadog-agent name: datadog-agent spec: serviceAccountName: datadog containers: - image: datadog/agent:latest imagePullPolicy: Always name: datadog-agent ports: - containerPort: 8125 name: dogstatsdport protocol: UDP - containerPort: 8126 name: traceport protocol: TCP env: - name: DD_API_KEY value: <YOUR_API_KEY> - name: DD_COLLECT_KUBERNETES_EVENTS value: "true" - name: DD_LEADER_ELECTION value: "true" - name: KUBERNETES value: "true" - name: DD_HEALTH_PORT value: "5555" - name: DD_KUBELET_TLS_VERIFY value: "false" - name: DD_KUBERNETES_KUBELET_HOST valueFrom: fieldRef: fieldPath: status.hostIP - name: DD_APM_ENABLED value: "true" resources: requests: memory: "256Mi" cpu: "200m" limits: memory: "256Mi" cpu: "200m" volumeMounts: - name: dockersocket mountPath: /var/run/docker.sock - name: procdir mountPath: /host/proc readOnly: true - name: cgroups mountPath: /host/sys/fs/cgroup readOnly: true livenessProbe: httpGet: path: /health port: 5555 initialDelaySeconds: 15 periodSeconds: 15 timeoutSeconds: 5 successThreshold: 1 failureThreshold: 3 volumes: - hostPath: path: /var/run/docker.sock name: dockersocket - hostPath: path: /proc name: procdir - hostPath: path: /sys/fs/cgroup name: cgroupsReplace <YOUR_API_KEY> with an API key from your Datadog account. Then run the following command to deploy the Agent as a DaemonSet:
kubectl create -f datadog-agent.yamlNow you can verify that the Agent is collecting Docker and Kubernetes metrics by running the Agent's status command. To do that, you first need to get the list of running pods so you can run the command on one of the Datadog Agent pods:
# Get the list of running pods$ kubectl get podsNAME READY STATUS RESTARTS AGEdatadog-agent-krrmd 1/1 Running 0 17d...
# Use the pod name returned above to run the Agent's 'status' command$ kubectl exec -it datadog-agent-krrmd agent statusIn the output you should see sections resembling the following, indicating that Kubernetes and Docker metrics are being collected:
kubelet (4.1.0)--------------- Instance ID: kubelet:d884b5186b651429 [OK] Configuration Source: file:/etc/datadog-agent/conf.d/kubelet.d/conf.yaml.default Total Runs: 35 Metric Samples: Last Run: 378, Total: 14,191 Events: Last Run: 0, Total: 0 Service Checks: Last Run: 4, Total: 140 Average Execution Time : 817ms Last Execution Date : 2020-06-22 15:20:37.000000 UTC Last Successful Execution Date : 2020-06-22 15:20:37.000000 UTC
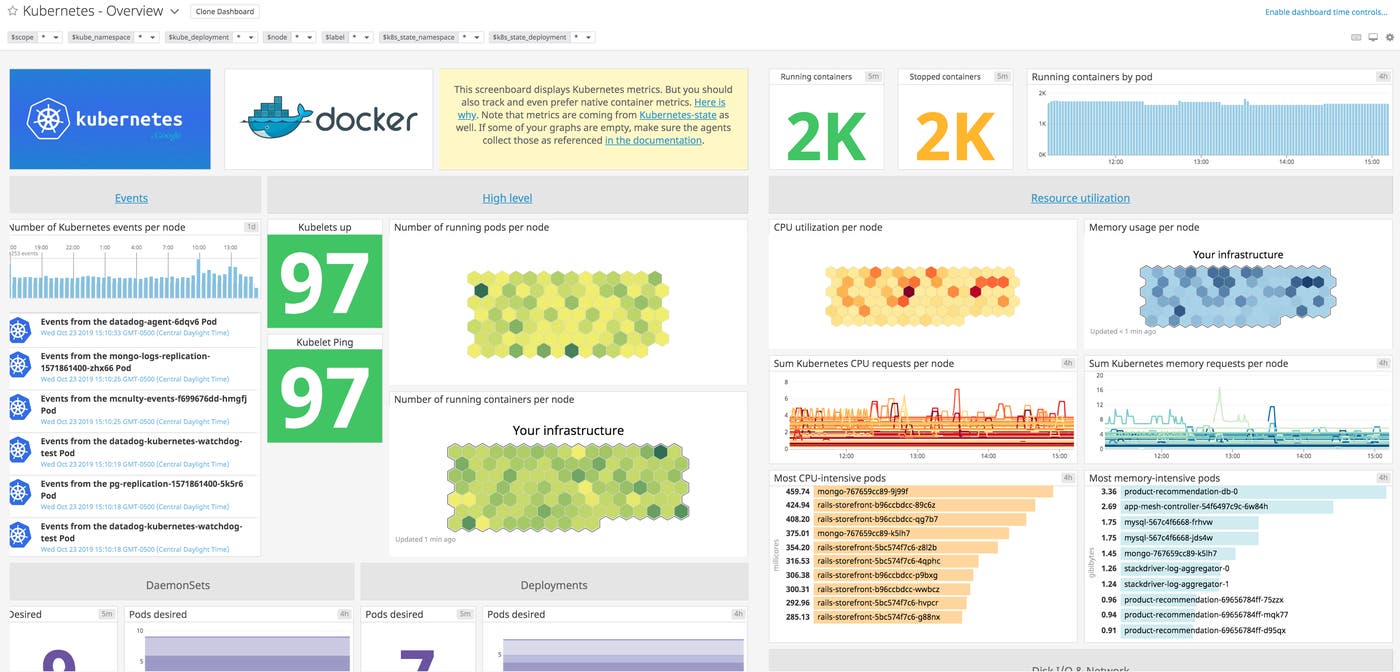
docker------ Instance ID: docker [OK] Configuration Source: file:/etc/datadog-agent/conf.d/docker.d/conf.yaml.default Total Runs: 35 Metric Samples: Last Run: 290, Total: 15,537 Events: Last Run: 1, Total: 4 Service Checks: Last Run: 1, Total: 35 Average Execution Time : 101ms Last Execution Date : 2020-06-22 15:20:30.000000 UTC Last Successful Execution Date : 2020-06-22 15:20:30.000000 UTCNow you can glance at your built-in Datadog dashboards for Kubernetes and Docker to see what those metrics look like.
Our documentation details several other ways you can deploy the Datadog Agent, including using the Helm package manager and Datadog Operator. And, if you're running a large-scale production deployment, you can also install the Datadog Cluster Agent—in addition to the node-based Agent—as a centralized and streamlined way to collect cluster-data for deep visibility into your infrastructure.
Add more Kubernetes metrics with kube-state-metrics
By default, the Kubernetes Agent check reports a handful of basic system metrics to Datadog, covering CPU, network, disk, and memory usage. You can easily expand on the data collected from Kubernetes by deploying the kube-state-metrics add-on to your cluster, which provides much more detailed metrics on the state of the cluster itself.
kube-state-metrics listens to the Kubernetes API and generates metrics about the state of Kubernetes logical objects: node status, node capacity (CPU and memory), number of desired/available/unavailable/updated replicas per deployment, pod status (e.g., waiting, running, ready), and so on. You can see the full list of metrics that Datadog collects from kube-state-metrics here.
To deploy kube-state-metrics as a Kubernetes service, copy the manifest here, paste it into a kube-state-metrics.yaml file, and deploy the service to your cluster:
kubectl create -f kube-state-metrics.yamlWithin minutes, you should see metrics with the prefix kubernetes_state. streaming into your Datadog account.
Collect metrics using Autodiscovery
The Datadog Agent can automatically track which services are running where, thanks to its [Autodiscovery] feature. Autodiscovery lets you define configuration templates for Agent checks and specify which containers each check should apply to. The Agent enables, disables, and regenerates static check configurations from the templates as containers come and go.
Out of the box, the Agent can use Autodiscovery to connect to a number of common containerized services, such as Redis and Apache (httpd), which have standardized configuration patterns. In this section, we'll show how Autodiscovery allows the Datadog Agent to connect to the Redis primary containers in our guestbook application stack, without any manual configuration.
The guestbook app
Deploying the [guestbook] application according to the step-by-step Kubernetes documentation is a great way to learn about the various pieces of a Kubernetes application. For this guide, we have modified the Go code for the guestbook app to add instrumentation (which we'll cover below) and condensed the various deployment manifests for the app into one, so you can deploy a fully functional guestbook app with one kubectl command.
Moving pieces
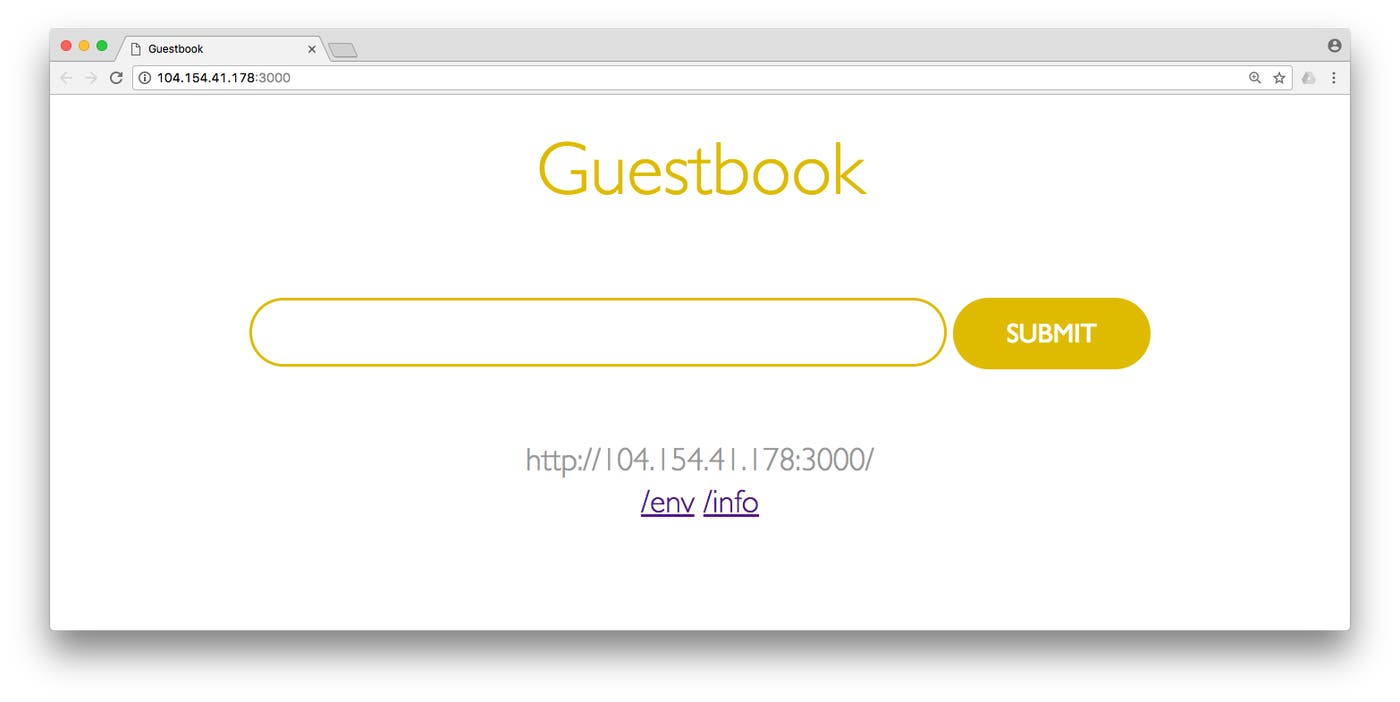
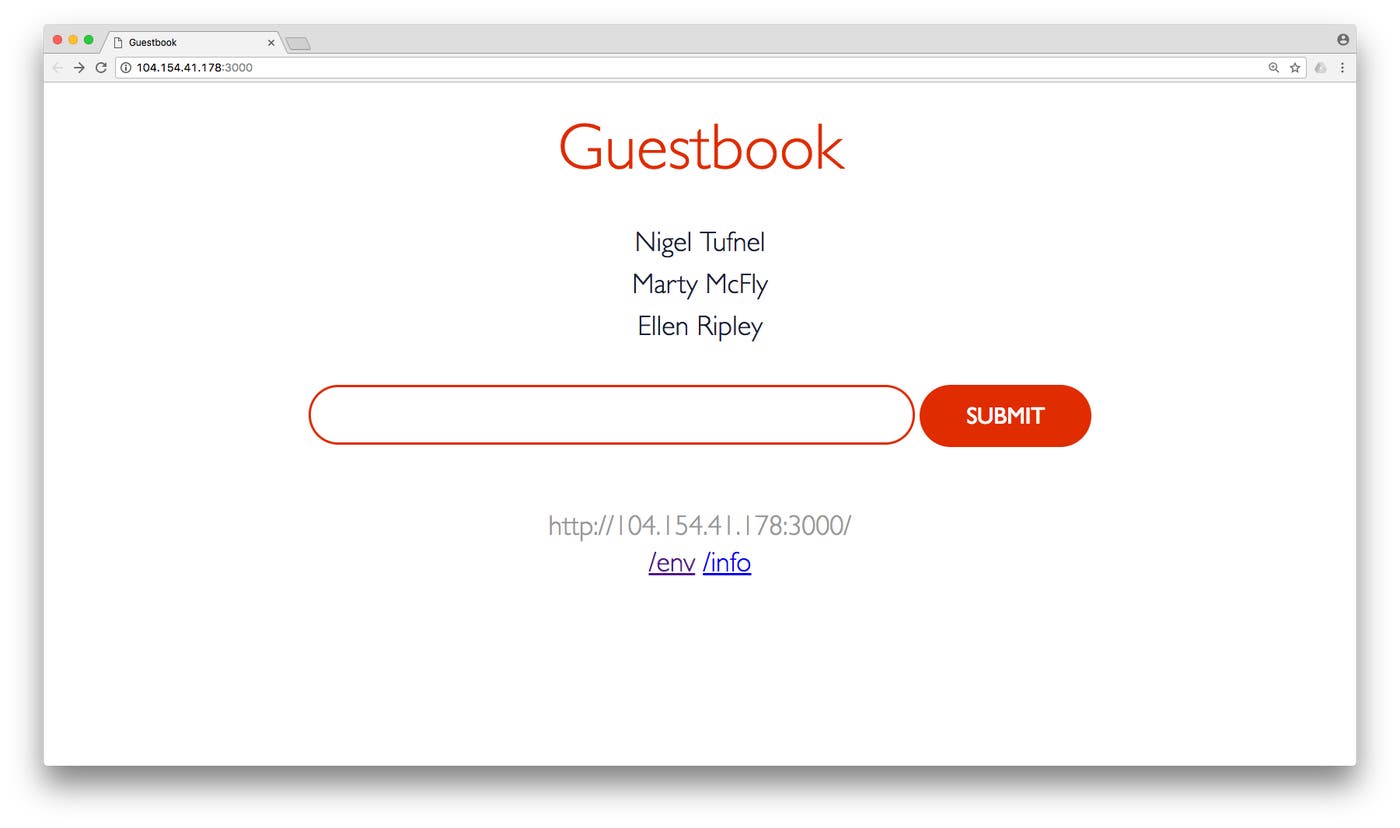
The guestbook app is a simple web application that allows you to enter names (or other strings) into a field in a web page. The app then stores those names in the Redis-backed "guestbook" and displays them on the page.
There are three main components to the guestbook application: the Redis primary pod, two Redis replica pods, and three "guestbook" pods running the Go web service. Each component has its own Kubernetes service for routing traffic to replicated pods. The guestbook service is of the type LoadBalancer, making the web application accessible via a public IP address.
Deploying the guestbook app
Copy the contents of the manifest to your Kubernetes control plane as guestbook-deployment-full.yaml and run:
kubectl apply -f guestbook-deployment-full.yamlVerify that Redis metrics are being collected
Autodiscovery is enabled by default on Kubernetes, allowing you to get continuous visibility into the services running in your cluster. This means that the Datadog Agent should already be pulling metrics from Redis containers in the backend of your guestbook app, regardless of which nodes those containers are running on. But for reasons we'll explain shortly, only the Redis primary node will be monitored by default.
To verify that Autodiscovery worked as expected, run the status command again:
# Get the list of running pods$ kubectl get podsNAME READY STATUS RESTARTS AGEdatadog-agent-krrmd 1/1 Running 0 17d...
# Use the pod name returned above to run the Agent's 'status' command$ kubectl exec -it datadog-agent-krrmd agent statusLook for a redis section in the output, like this:
redisdb (2.1.1)--------------- Instance ID: redisdb:716cd1d739111f7b [OK] Configuration Source: file:/etc/datadog-agent/conf.d/redisdb.d/auto_conf.yaml Total Runs: 2 Metric Samples: Last Run: 33, Total: 66 Events: Last Run: 0, Total: 0 Service Checks: Last Run: 1, Total: 2 Average Execution Time : 6ms Last Execution Date : 2020-06-22 15:04:48.000000 UTC Last Successful Execution Date : 2020-06-22 15:04:48.000000 UTC metadata: version.major: 2 version.minor: 8 version.patch: 23 version.raw: 2.8.23 version.scheme: semverNote that the guestbook application only has a single Redis primary instance, so if you're running this exercise on a multi-node cluster you may need to run the status command on each datadog-agent pod to find the particular Agent that's monitoring the Redis instance.
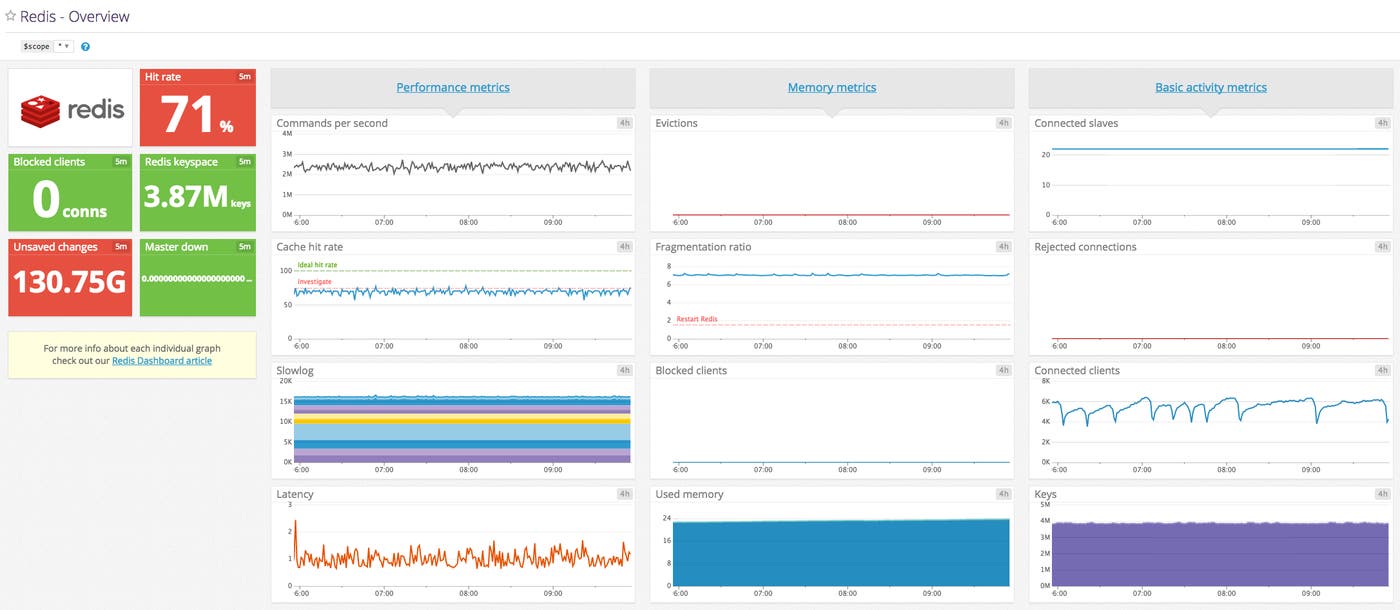
Now you can open up your out-of-the-box Redis dashboard in Datadog, which will immediately begin populating with metrics from your Redis primary instance.
Add custom config templates for Autodiscovery
Note: This section includes resources that use the term “slave.” Except when referring to specific resource names, this article replaces them with “replica."
Add custom monitoring configs with pod annotations
From the output in the previous step, we can see that Datadog is monitoring our Redis primary node, but not our replica nodes. That's because Autodiscovery uses container names to match monitoring configuration templates to individual containers. In the case of Redis, the Agent looks to apply its standard Redis check to all Docker images named redis. And while the Redis primary instance is indeed built from the redis image, the replicas are using a different image, named k8s.gcr.io/redis-slave.
Using Kubernetes pod annotations, we can attach configuration parameters to any container, so that the Datadog Agent can connect to those containers and collect monitoring data. In this case, we want to apply the standard Redis configuration template to our containers that are based on the image k8s.gcr.io/redis-slave.
In the guestbook manifest, we need to add a simple set of pod annotations that does three things:
Tells the Datadog Agent to apply the Redis Agent check (
redisdb) to containers running theredis-replicaimageSupplies an empty set of
init_configsfor the check (this is the default for Datadog's Redis Agent check)Supplies
instancesconfiguration for the Redis check, using template variables instead of a static host and port
To enable monitoring of all the Redis containers running in the guestbook app, you will need to add annotations to the spec for the redis-replica ReplicationController in your guestbook-deployment-full.yaml manifest, as shown here:
kind: ReplicationControllerapiVersion: v1metadata: name: redis-replica labels: app: redis role: replicaspec: replicas: 2 selector: app: redis role: replica template: metadata: labels: app: redis role: replica annotations: ad.datadoghq.com/redis-replica.check_names: '["redisdb"]' ad.datadoghq.com/redis-replica.init_configs: '[{}]' ad.datadoghq.com/redis-replica.instances: '[{"host": "%%host%%", "port": "%%port%%"}]' spec: containers: - name: redis-replica image: k8s.gcr.io/redis-slave:v2 ports: - name: redis-server containerPort: 6379To unpack those annotations a bit: ad.datadoghq.com is the string that the Agent looks for to identify configuration parameters for an Agent check, and redis-replica is the name of the containers to which the Agent will apply the check.
Now apply the change:
kubectl apply -f guestbook-deployment-full.yamlVerify that all Redis containers are being monitored
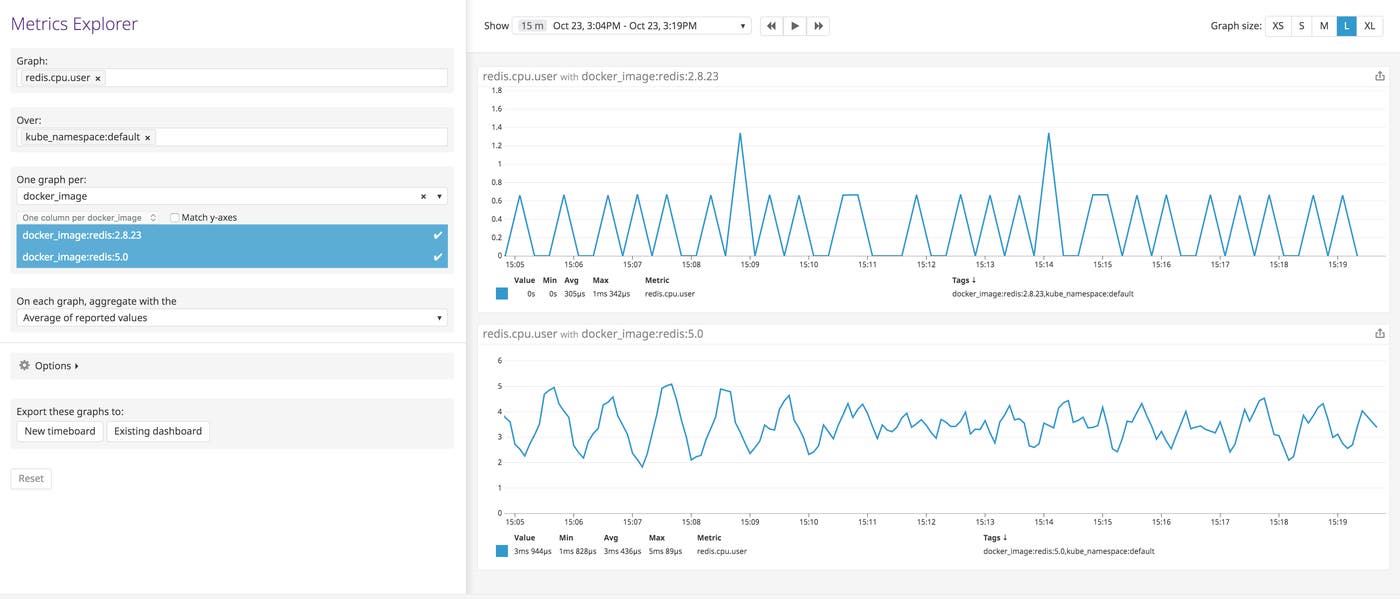
The configuration change should allow Datadog to pick up metrics from Redis containers, whether they run the redis image or k8s.gcr.io/redis-slave. To verify that you're collecting metrics from all your containers, you can view your Redis metrics in Datadog, broken down by image_name.
Monitor a container listening on multiple ports
The example above works well for relatively simple use cases where the Agent can connect to a container that's been assigned a single port, but what if the connection parameters are a bit more complex? In this section we'll show how you can use indexes on template variables to help the Datadog Agent choose one port from many.
Using an expvar interface to expose metrics
Since our guestbook app is written in Go, we can use the expvar library to collect extensive memory-usage metrics from our app, almost for free. In our application's main.go file, we import the expvar package using an underscore to indicate that we only need the "side effects" of the package—exposing basic memory stats over HTTP:
import _ "expvar"In the guestbook app's Kubernetes manifest, we have assigned port 2999 to the expvar server:
ports:- name: expvar-server containerPort: 2999 protocol: TCPDirect the Agent to use the correct port
The Datadog Agent has an expvar integration, so all you need to do is provide Kubernetes pod annotations to properly configure the Agent to gather expvar metrics. To do that, you can use the expvar monitoring template for the Agent check and convert the essential components from YAML to JSON to construct your pod annotations. Once again, our annotations will cause the Datadog Agent to:
Apply the
go_expvarAgent check to theguestbookcontainersSupply an empty set of
init_configsfor the check (this is the default for Datadog's expvar Agent check)Dynamically generate the correct URL for the expvar interface using template variables for the host and port
In this case, however, our app is using two ports (port 2999 for expvar and 3000 for the main HTTP service), so the challenge is making sure that Datadog selects the correct port to look for expvar metrics. To do that, we'll make use of template variable indexing, which enables you to direct Autodiscovery to select the correct host or port from a list of available options. When the Agent inspects a container, Autodiscovery sorts the IP addresses and ports in ascending order, allowing you to address them by index. In this case we want to select the first (smaller) value of the two ports exposed on the container, so we use %%port_0%%. Add the annotation lines below to the metadata section of the guestbook Deployment in the guestbook-deployment-full.yaml to set up the expvar Agent check:
spec: replicas: 3 template: metadata: labels: app: guestbook annotations: ad.datadoghq.com/guestbook.check_names: '["go_expvar"]' ad.datadoghq.com/guestbook.init_configs: '[{}]' ad.datadoghq.com/guestbook.instances: '[{"expvar_url": "http://%%host%%:%%port_0%%"}]'Now save the file and apply the change:
kubectl apply -f guestbook-deployment-full.yamlConfirm that expvar metrics are being collected
Run the Agent's status command to ensure that expvar metrics are being picked up by the Agent:
# Get the list of running pods$ kubectl get podsNAME READY STATUS RESTARTS AGEdatadog-agent-krrmd 1/1 Running 0 17d...
# Use the pod name returned above to run the Agent's 'status' command$ kubectl exec -it datadog-agent-krrmd agent statusIn the output, look for an expvar section in the list of checks:
go_expvar (1.9.0)----------------- Instance ID: go_expvar:38d672841b5ccf58 [OK] Configuration Source: kubelet:docker://a9bef76bcf041558332534000081d093d6bb422484cfb9254de72ebe7aa62546 Total Runs: 1 Metric Samples: Last Run: 15, Total: 15 Events: Last Run: 0, Total: 0 Service Checks: Last Run: 0, Total: 0 Average Execution Time : 9ms Last Execution Date : 2020-06-22 15:20:40.000000 UTC Last Successful Execution Date : 2020-06-22 15:20:40.000000 UTC...Send custom metrics to DogStatsD
All of the above steps involve using out-of-the-box monitoring functionality or modifying Datadog's natively supported integrations to meet your needs. Sometimes, though, you need to monitor metrics that are truly unique to your application.
Bind the DogStatsD port to a host port
To enable the collection of custom metrics, the Datadog Agent ships with a lightweight [DogStatsD] server for metric collection and aggregation. To send metrics to a containerized DogStatsD, you can bind the container's port to the host port and address DogStatsD using the node's IP address. To do that, add a hostPort to your datadog-agent.yaml file:
ports: - containerPort: 8125 hostPort: 8125 name: dogstatsdport protocol: UDPThis enables your applications to send metrics via DogStatsD on port 8125 on whichever node they happen to be running. (Note that the hostPort functionality requires a networking provider that adheres to the CNI specification, such as Calico, Canal, or Flannel. For more information, including a workaround for non-CNI network providers, consult the Kubernetes documentation.)
To deploy the service, apply your change:
kubectl apply -f datadog-agent.yamlPass the node's IP address to your app
Since we've made it possible to send metrics via a known port on the host, now we need a reliable way for the application to determine the IP address of its host. This is made much simpler in Kubernetes 1.7, which expands the set of attributes you can pass to your pods as environment variables. In versions 1.7 and above, you can pass the host IP to any pod by adding an environment variable to the PodSpec. For instance, in our guestbook manifest, we've added:
env:- name: DOGSTATSD_HOST_IP valueFrom: fieldRef: fieldPath: status.hostIPNow any pod running the guestbook will be able to send DogStatsD metrics via port 8125 on $DOGSTATSD_HOST_IP.
Instrument your code to send metrics to DogStatsD
Now that we have an easy way to send metrics via DogStatsD on each node, we can instrument our application code to submit custom metrics. Since the guestbook example app is written in Go, we'll import Datadog's Go library, which provides a DogStatsD client library:
import "github.com/DataDog/datadog-go/statsd"Before we can add custom counters, gauges, and more, we must initialize the StatsD client with the location of the DogStatsD service: $DOGSTATSD_HOST_IP.
func main() {
// other main() code omitted for brevity
var err error // use host IP and port to define endpoint dogstatsd, err = statsd.New(os.Getenv("DOGSTATSD_HOST_IP") + ":8125") if err != nil { log.Printf("Cannot get a DogStatsD client.") } else { // prefix every metric and event with the app name dogstatsd.Namespace = "guestbook."
// post an event to Datadog at app startup dogstatsd.Event(&statsd.Event{ # Title: "Guestbook application started.", Text: "Guestbook application started.", }) }We can also increment a custom metric for each of our handler functions. For example, every time the InfoHandler function is called, it will increment the guestbook.request_count metric by 1, while applying the tag endpoint:info to that datapoint:
func InfoHandler(rw http.ResponseWriter, req *http.Request) { dogstatsd.Incr("request_count", []string{"endpoint:info"}, 1) info := HandleError(masterPool.Get(0).Do("INFO")).([]byte) rw.Write(info)}Verify that custom metrics and events are being collected
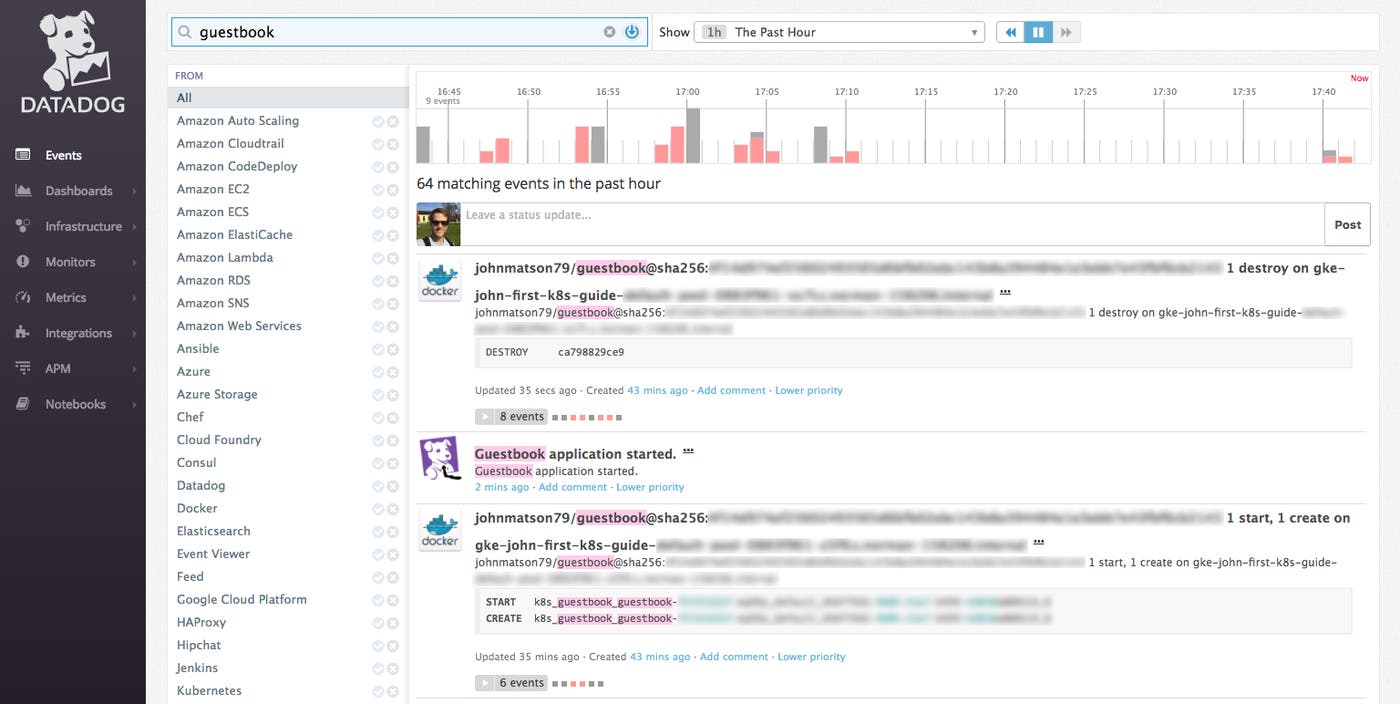
If you kill one of your guestbook pods, Kubernetes will create a new one right away. As the new pod's Go service starts, it will—if you've correctly configured its StatsD client—send a new "Guestbook application started" event to Datadog.
# Get the list of running pods$ kubectl get podsNAME READY STATUS RESTARTS AGEguestbook-231891302-2qw3m 1/1 Running 0 1dguestbook-231891302-d9hkr 1/1 Running 0 1dguestbook-231891302-wcmrj 1/1 Running 0 1d...
# Kill one of those pods$ kubectl delete pod guestbook-231891302-2qw3mpod "guestbook-231891302-2qw3m" deleted
# Confirm that the deleted pod has been replaced$ kubectl get podsNAME READY STATUS RESTARTS AGEguestbook-231891302-d9hkr 1/1 Running 0 1dguestbook-231891302-qhfgs 1/1 Running 0 48sguestbook-231891302-wcmrj 1/1 Running 0 1d...Now you can view the Datadog event stream to see your custom application event, in context with the Docker events from your cluster.
Generating metrics from your app
To cause your application to emit some metrics, visit its web interface and enter a few names into the guestbook. First you'll need the public IP of your app, which is the external IP assigned to the guestbook service. You can find that EXTERNAL-IP by running:
kubectl get servicesNow you can load the web app in a browser and add some names. Each request increments the request_count counter.
Now you should be able to view and graph the metrics from your guestbook app in Datadog. Open up a Datadog notebook and type in the custom metric name (guestbook.request_count) to start exploring. Success! You're now successfully monitoring custom metrics from a containerized application.
Watching the orchestrator
In this guide we have stepped through several common techniques for setting up monitoring in a Kubernetes cluster:
Monitoring resource metrics and cluster status from Docker and Kubernetes
Using Autodiscovery to collect metrics from services with simple configs
Creating pod annotations to configure Autodiscovery for more complex use cases
Collecting custom metrics from containerized applications via DogStatsD
Stay tuned for forthcoming posts on container monitoring using other orchestration techniques and technologies.
If you're ready to start monitoring your own Kubernetes cluster, you can sign up for a free Datadog trial and get started today.
Acknowledgments
Many thanks to Kent Shultz for his technical contributions and advice throughout the development of this article.

