Mallory Mooney
In Part 1, we looked at some key metrics for monitoring the health and performance of your Cilium-managed Kubernetes clusters and network. In this post, we’ll look at how Hubble enables you to visualize network traffic via a CLI and user interface. But first, we’ll briefly look at Hubble’s underlying infrastructure and how it provides visibility into your environment.
Hubble’s underlying infrastructure
There are several Linux-based and Kubernetes command-line tools that enable you to review network data for individual pods , such as their IP addresses and hostnames. But in order to efficiently troubleshoot any performance degradation, such as service latency, you need a better understanding of pod-to-pod and client-to-pod communication. Hubble collects and aggregates network data from every pod in your environment to give you a better view into request throughput, status, errors, and more. Hubble also integrates with OpenTelemetry, enabling you to export log and trace data from Cilium-managed networks to a third-party monitoring platform.
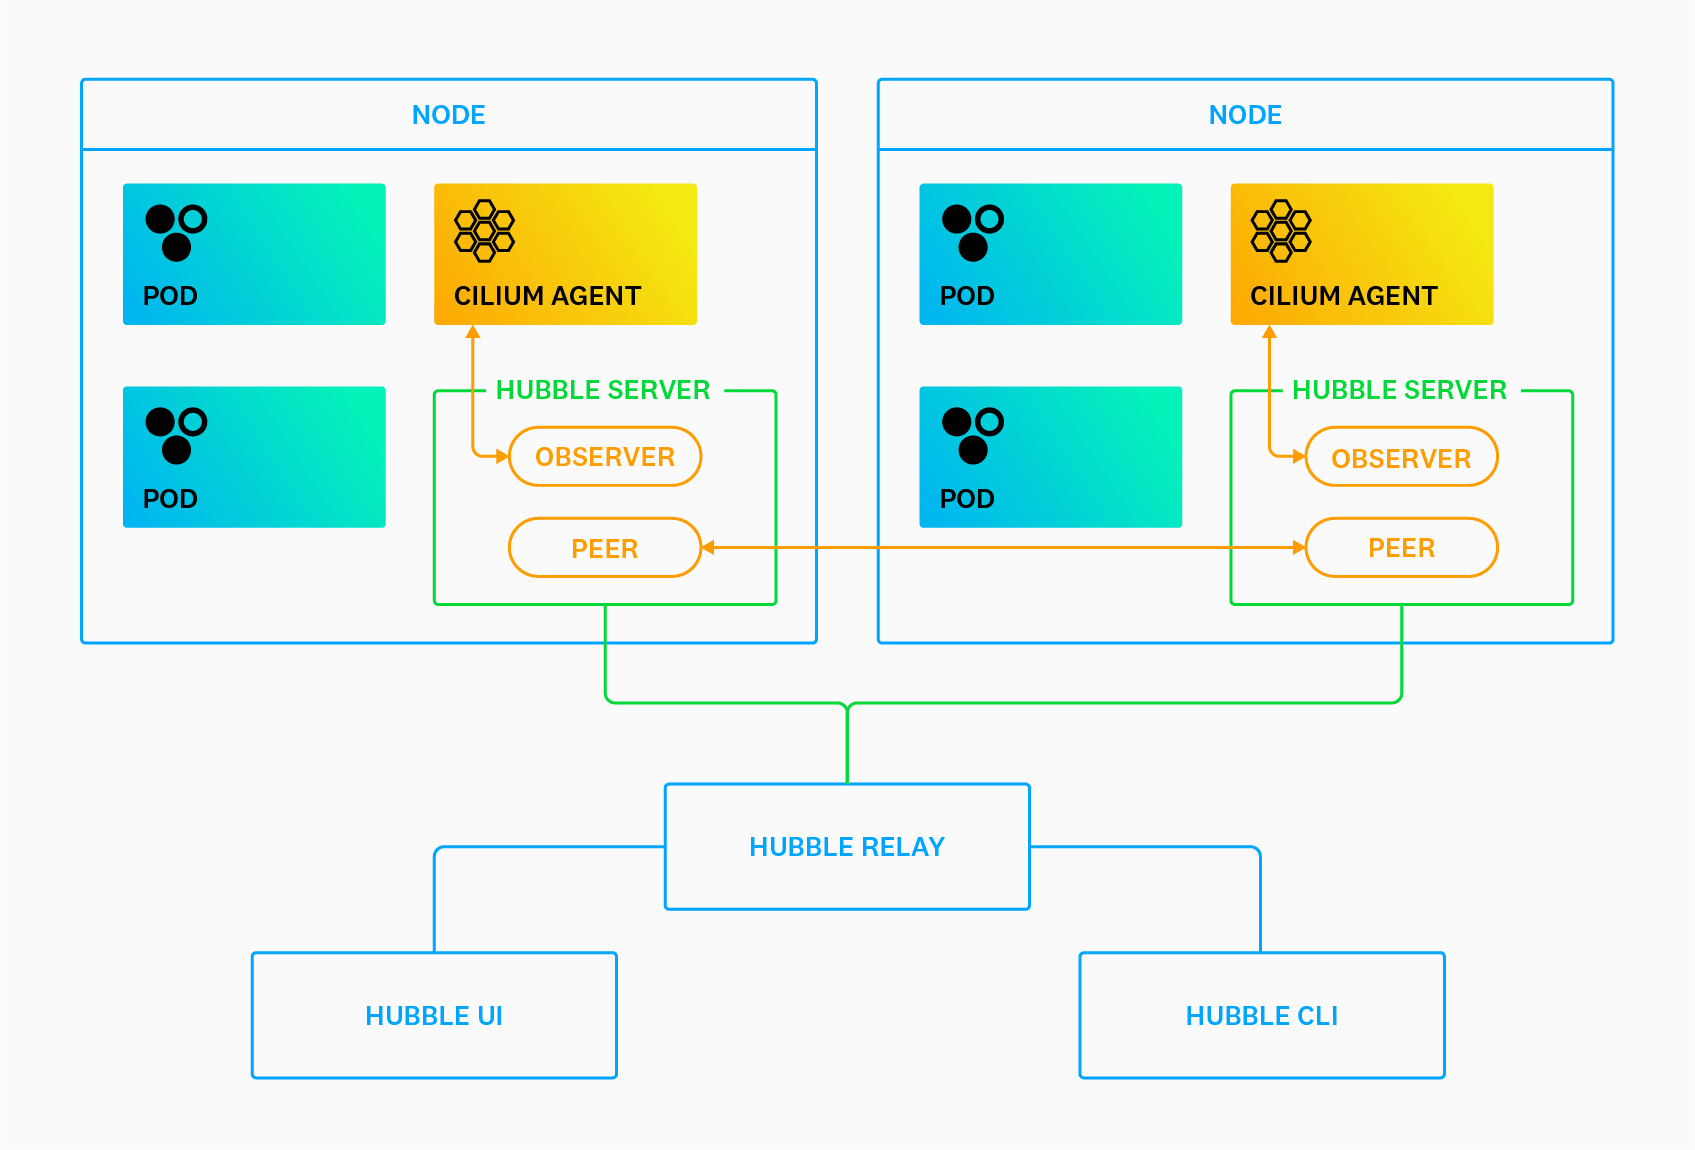
Because Cilium can control traffic at layers 3, 4, and 7 of the OSI model, Hubble enables you to monitor multiple levels of network traffic, such as TCP connections, DNS queries, and HTTP requests across clusters or cluster meshes. To accomplish this, Hubble leverages two primary components: servers and the Hubble Relay.

Hubble servers run alongside the Cilium agent on each cluster node. Each server implements an Observer service to monitor pod traffic and a Peer service to keep track of Hubble instances on other nodes. The Hubble Relay is a stand-alone component that collects network flow data from each server instance and makes it available to the Hubble UI and CLI via a set of APIs.
Though the Hubble platform is deployed automatically with Cilium, it is not enabled by default. You can enable it by running the following command on your host:
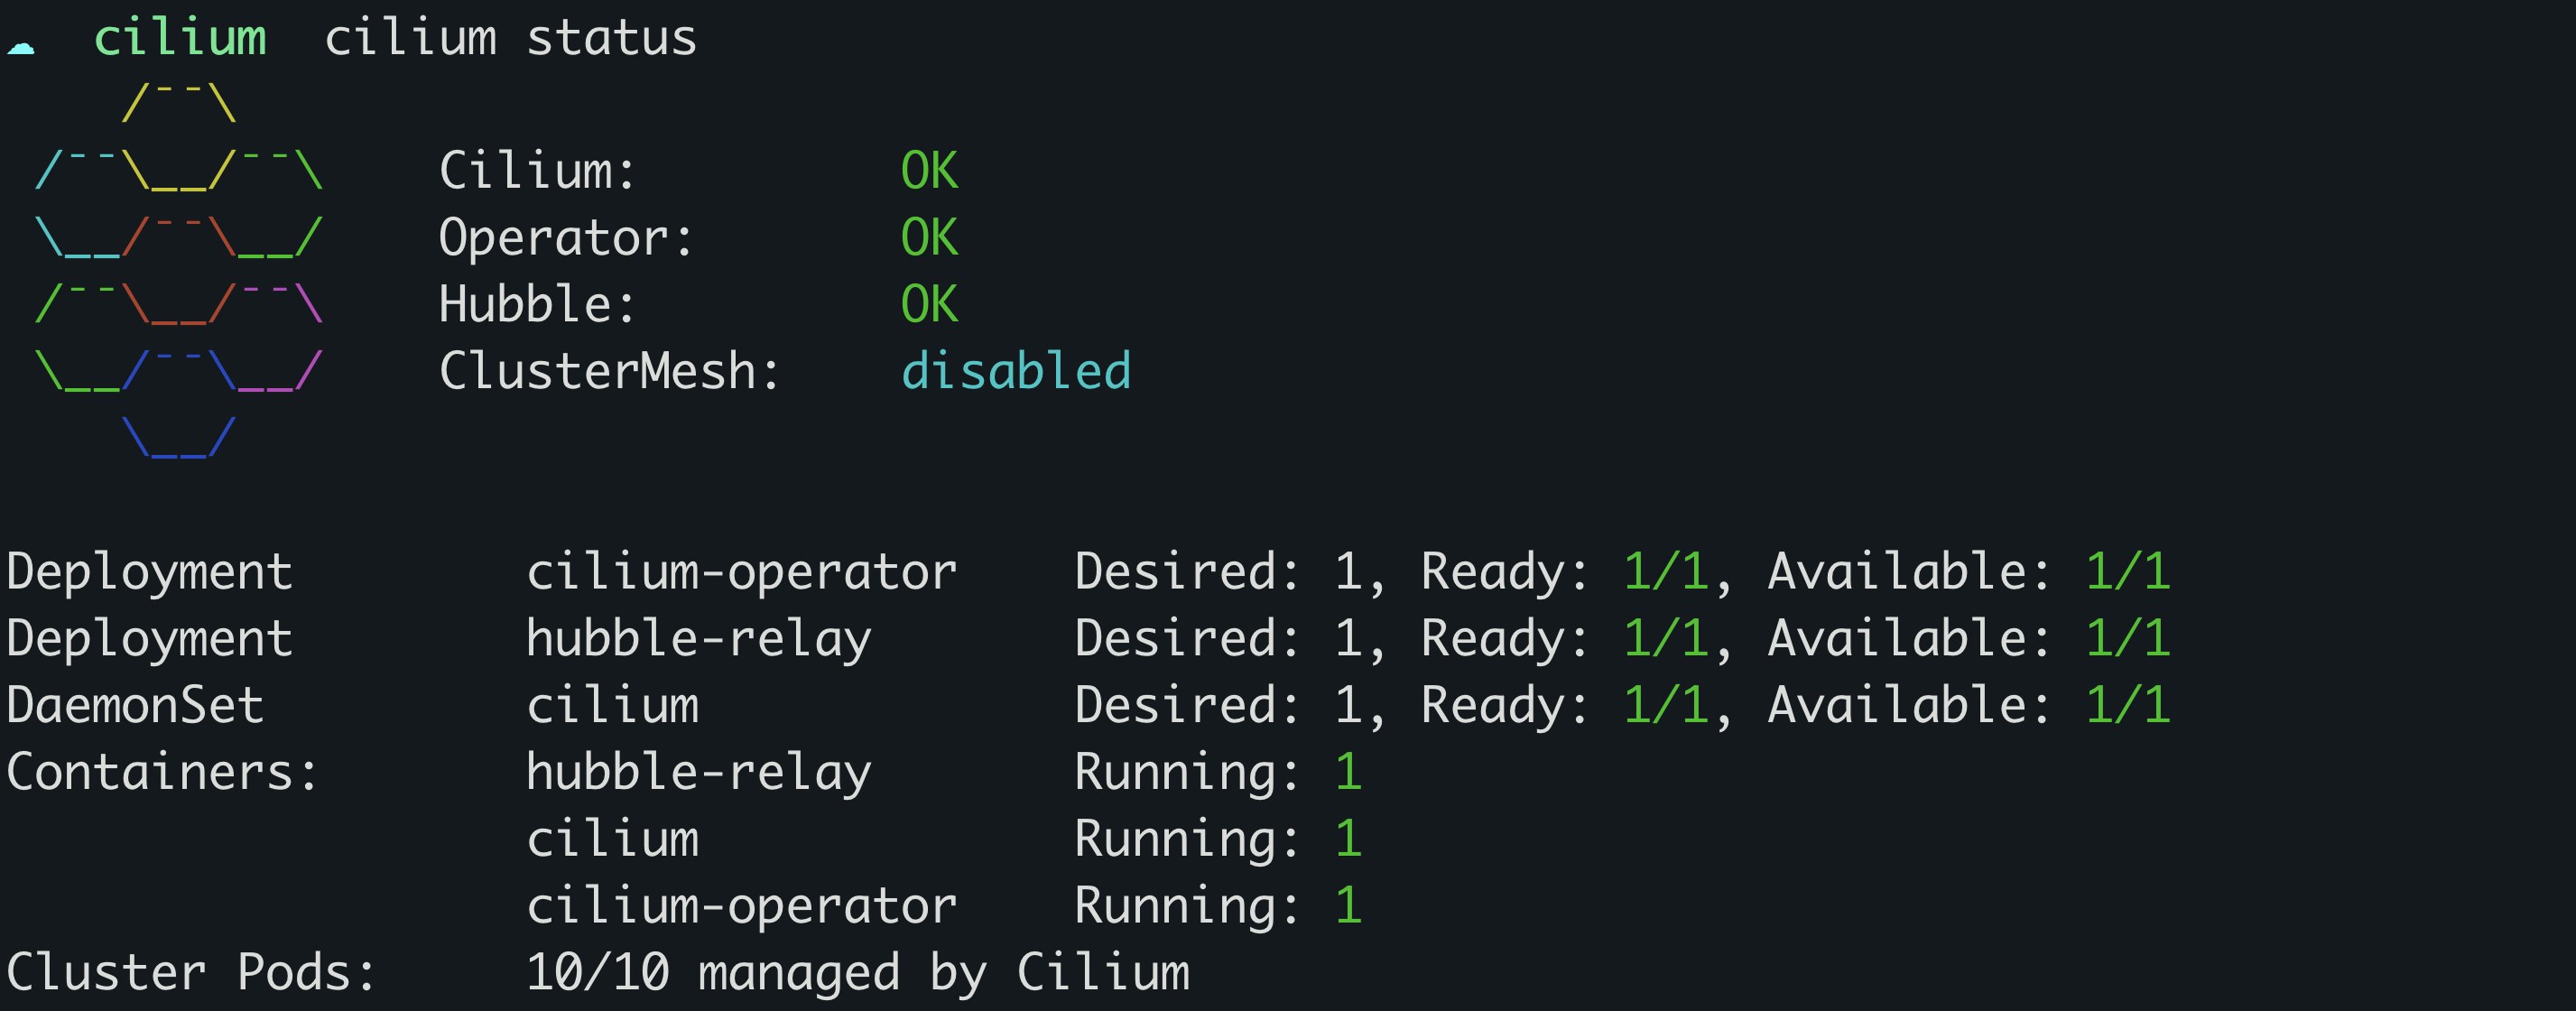
cilium hubble enableYou can also check the status of both Hubble and Cilium by running the cilium status command, which should give you output similar to the following:

You will see an error status in the command’s output if either service failed to launch. This issue can sometimes happen if underlying nodes are running out of memory. Allocating more memory and relaunching Cilium can help resolve the problem.
The Hubble CLI
Hubble’s CLI extends the visibility that is provided by standard kubectl commands like kubectl get pods to give you more network-level details about a request, such as its status and the security identities associated with its source and destination. You can view this information via the hubble observe command and monitor traffic to, from, and between pods in order to determine if your policies are working as expected. For example, you can view all dropped requests between services by using the following command:
hubble observe --verdict DROPPED
May 12 13:35:35.923: default/service-a:58578 (ID:1469) -> default/service-c:80 (ID:851) http-request DROPPED (HTTP/1.1 PUT http://service-c.default.svc.cluster.local/v1/endpoint-1)The sample output above shows that the destination pod (service-c) dropped requests from the source pod (service-a). You can investigate further by adding the -o json option to the hubble observe command. The JSON output provides more context for an event, including:
- the request event’s verdict and relevant error message (e.g.,
drop_reason_desc) - the direction of the request (e.g.,
traffic_direction) - the type of policy that manages the pods associated with the request (e.g.,
"Type") - the IP addresses and ports for the source and destination endpoints
Using our previous example, you can review the command’s JSON output to determine why the service-b pod is dropping requests:
{ "time": "2022-05-12T14:16:09.475485361Z", "verdict": "DROPPED", "drop_reason": 133, "ethernet": {...},
"IP": { "source": "10.0.0.87", "destination": "10.0.0.154", "ipVersion": "IPv4" }, "l4": {...},
"source": { "ID": 3173, "identity": 12878, "namespace": "default", "labels": [ "k8s:app.kubernetes.io/name=service-b", "k8s:class=service-b", "k8s:io.cilium.k8s.policy.cluster=minikube", "k8s:io.cilium.k8s.policy.serviceaccount=default", "k8s:io.kubernetes.pod.namespace=default", "k8s:org=gobs-1" ], "pod_name": "service-b" }, "destination": { "ID": 939, "identity": 4418, "namespace": "default", "labels": [ "k8s:app.kubernetes.io/name=service-c", "k8s:class=service-c", "k8s:io.cilium.k8s.policy.cluster=minikube", "k8s:io.cilium.k8s.policy.serviceaccount=default", "k8s:io.kubernetes.pod.namespace=default", "k8s:org=gobs-2" ], "pod_name": "service-c", "workloads": [...]
}, "Type": "L3_L4", "node_name": "minikube/minikube", "event_type": { "type": 1, "sub_type": 133 }, "traffic_direction": "INGRESS", "drop_reason_desc": "POLICY_DENIED", "Summary": "TCP Flags: SYN"}In the sample snippet above, you can see that requests were dropped ("drop_reason_desc": "POLICY_DENIED") due to an L3/L4 policy ("Type": "L3_L4"), which indicates that Cilium was managing traffic appropriately in this case. You can modify your policy if you need to enable communication between these two pods.
The Hubble UI
While the CLI provides insight into networking issues for individual pods, you still need visibility into how these problems affect the entire cluster. The Hubble UI offers a high-level service map for monitoring network activity and policy behavior, enabling you to get a better understanding of how each of your pods interact with one another. Service maps can automatically capture interdependencies between Kubernetes services, making them especially useful for monitoring large-scale environments. This level of visibility enables you to confirm that your network is routing traffic to the appropriate endpoints.
To get started, you can enable and access the Hubble UI by running the following commands:
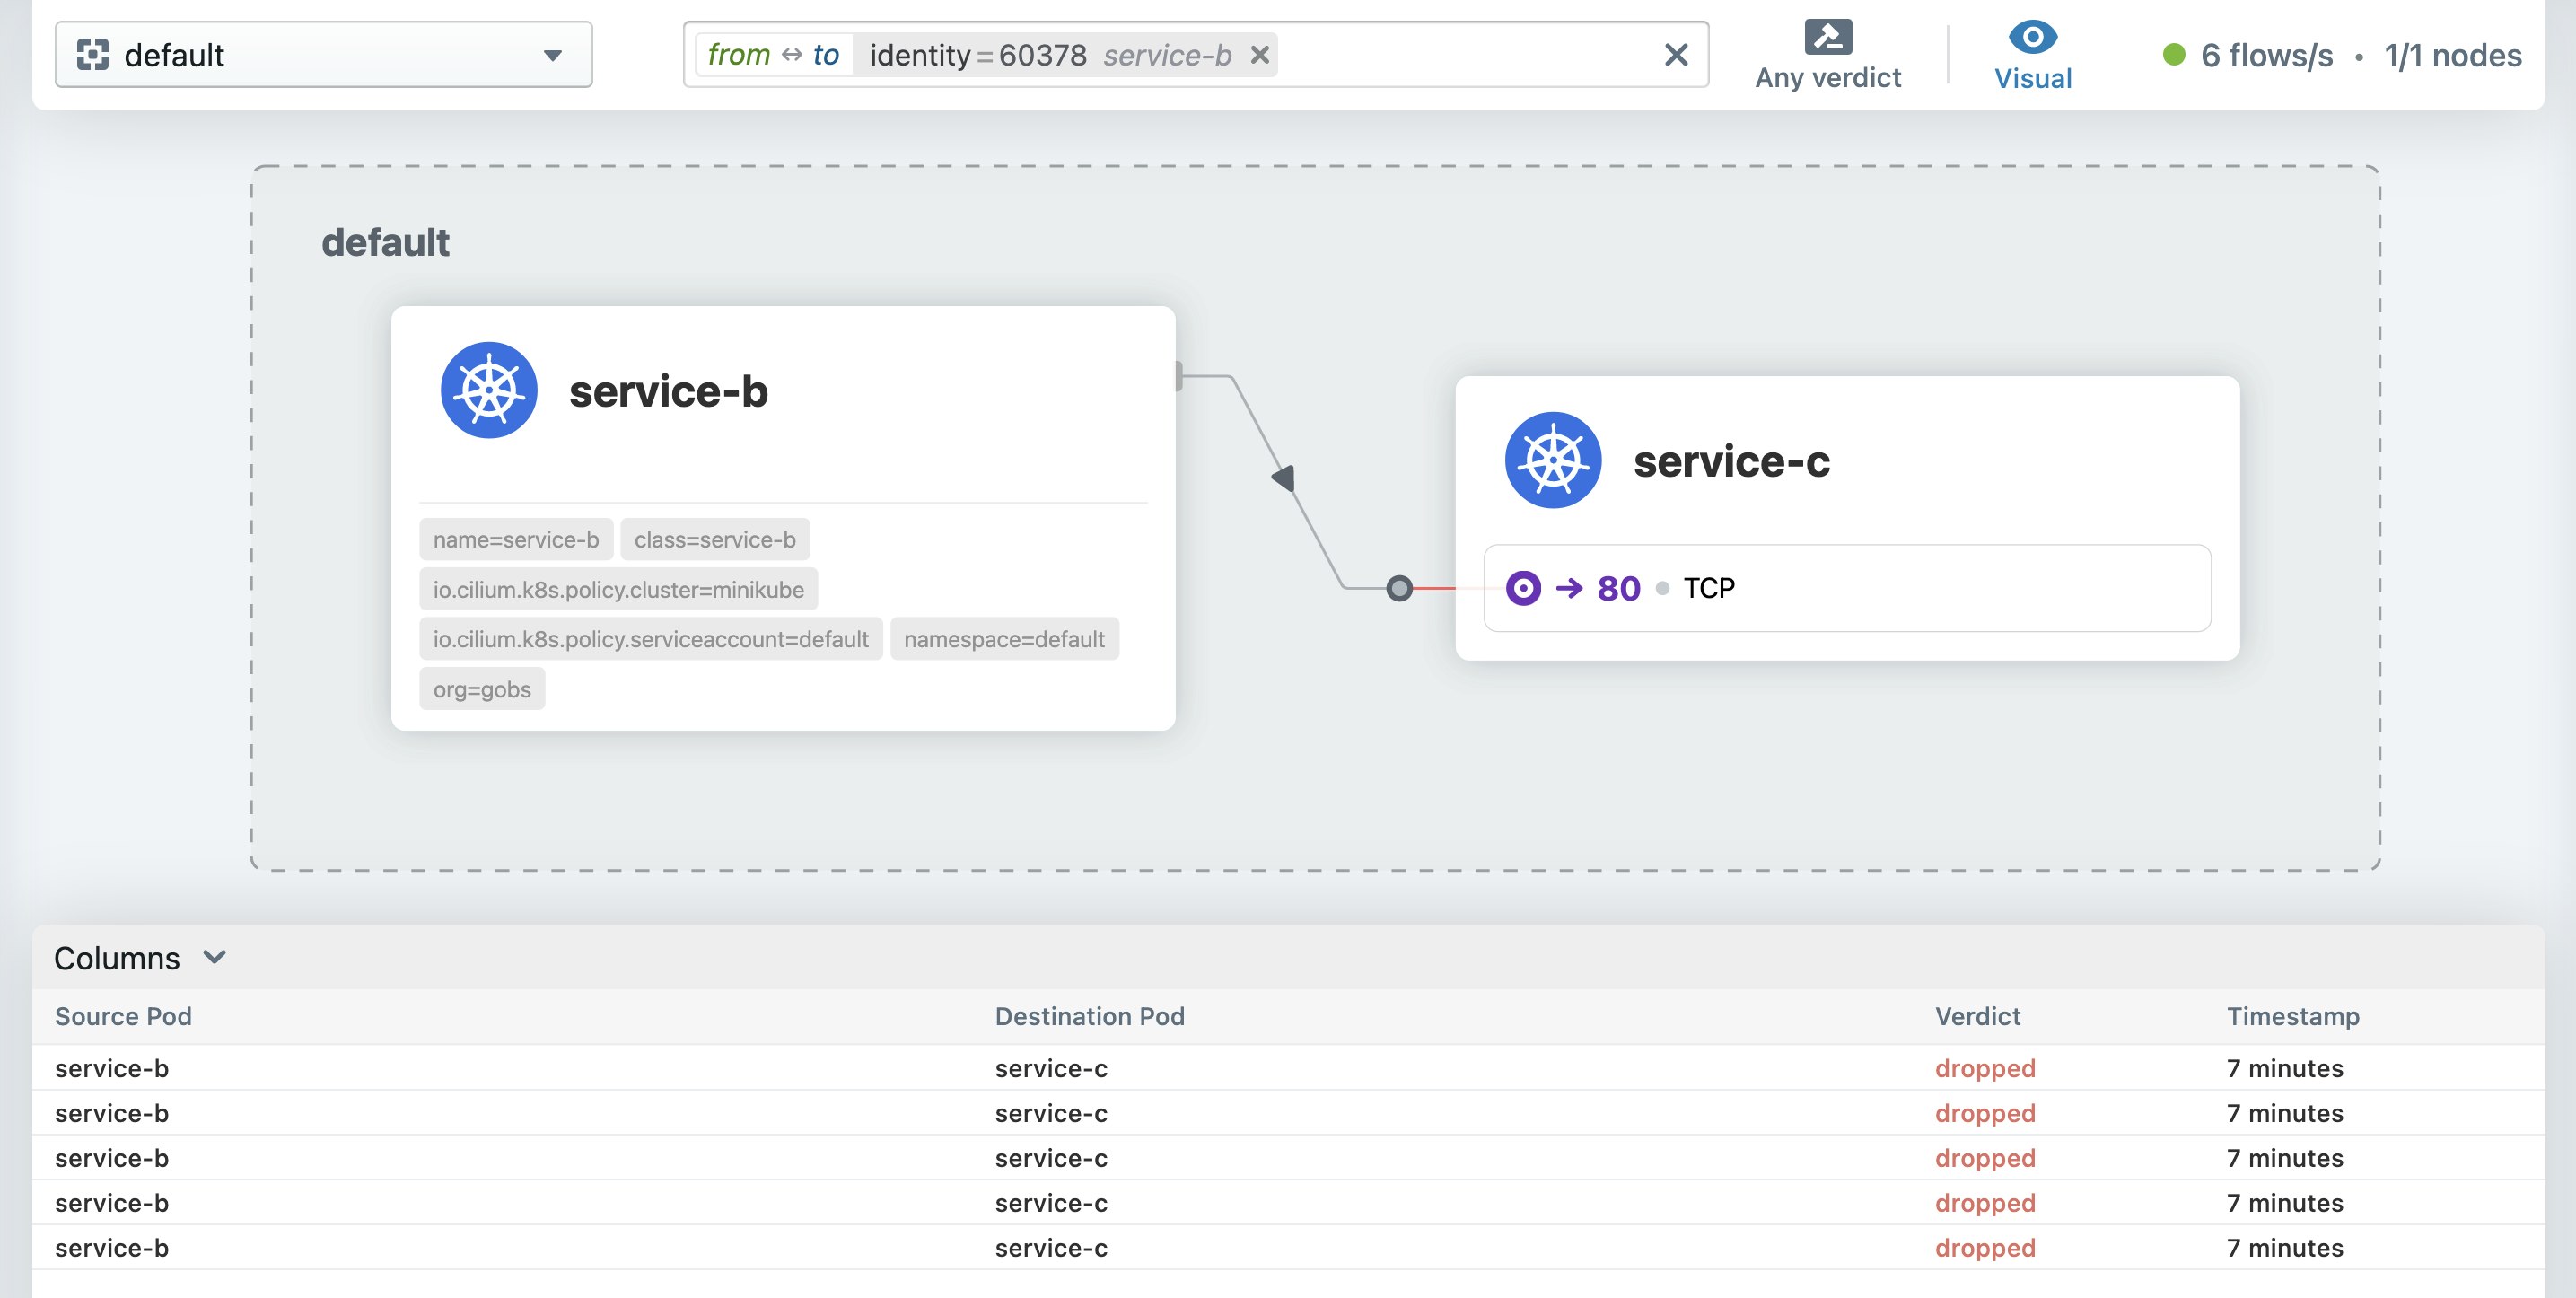
cilium hubble enable --uicilium hubble uiThe Cilium CLI will automatically navigate to your Hubble UI instance at http://localhost:12000/, where you can select a Kubernetes namespace to view the service map for a particular set of pods. In the example service map below, the service-b pod is attempting to communicate with the service-c pod, but its requests are failing.

In the request list below the service map, you can see that Cilium is dropping requests between the service-b and service-c pods. You can troubleshoot further by selecting an individual request to view more details and determine if the drop is the result of a network policy or another issue. Hubble’s UI leverages the same data points as its CLI, so you have complete context for mitigating the problem.
Monitor network traffic with Hubble
In this post, we looked at how Hubble enables you to monitor network traffic across your Cilium-managed infrastructure. Check out Cilium’s documentation to learn more about leveraging the Hubble platform for monitoring the health and performance of your Kubernetes network. In the next part of this series, we’ll show you how Datadog provides complete visibility into Cilium metrics, logs, and network data.


