
Mallory Mooney
In Part 2 of this series, we showed how Hubble, Cilium’s observability platform, enables you to view network-level details about service dependencies and traffic flows. Cilium also integrates with various standalone monitoring tools, so you can track the other key metrics discussed in Part 1. But since the platform is an integral part of your infrastructure, you need the ability to easily correlate Cilium network and resource metrics with data from your Kubernetes resources. Otherwise, you may potentially miss issues that could lead to an outage.
Datadog brings together all of Cilium’s observability data under a single platform, providing end-to-end visibility into your Cilium network and Kubernetes environment. In this post, we’ll show how to use Datadog to:
- visualize Cilium metrics via Datadog’s out-of-the-box integration
- analyze Cilium logs for better insight into performance anomalies
- monitor the state of your pods with Datadog’s Live Container view
- observe network traffic with Datadog Cloud Network Monitoring and DNS monitoring
Enable Datadog’s Cilium integration
You can forward Cilium’s metrics and logs to Datadog using the Datadog Agent, which can either be deployed directly onto the physical or virtual hosts supporting your Cilium-managed clusters, or as part of the Kubernetes manifests that manage your containerized environment. In this section, we’ll look at enabling the Agent’s Cilium integration via Kubernetes manifests.
Datadog provides Autodiscovery templates that you can incorporate into your manifests, allowing the Agent to automatically identify Cilium services running in each of your clusters . These templates simplify the process for enabling the Cilium integration across your containerized environment so you do not have to individually configure hosts.
The manifest snippet below configures the Datadog Agent to leverage its built-in OpenMetrics check in order to scrape metrics from Prometheus endpoints for Cilium’s operator and agent:
apiVersion: v1kind: Pod# (...)metadata: name: 'cilium-pod' annotations: ad.datadoghq.com/cilium_agent.check_names: '["cilium"]' ad.datadoghq.com/cilium_agent.init_configs: '[{...}]' ad.datadoghq.com/cilium_agent.logs: |[ { "source": "cilium-agent", "service": "cilium-agent" } ] ad.datadoghq.com/cilium_agent.instances: | [ { "agent_endpoint": "http://%%host%%:9090/metrics", "use_openmetrics": "true" } ]
# (...) ad.datadoghq.com/cilium_operator.check_names: '["cilium"]' ad.datadoghq.com/cilium_operator.init_configs: '[{...}]' ad.datadoghq.com/cilium_operator.logs: |[ { "source": "cilium-operator", "service": "cilium-operator" } ] ad.datadoghq.com/cilium_operator.instances: | [ { "operator_endpoint": "http://%%host%%:6942/metrics", "use_openmetrics": "true" } ]spec: containers: - name: 'cilium_agent' # (...) - name: 'cilium_operator'# (...)In addition to enabling metric and log collection, this YAML file configures source and service tags for Cilium data. Tags create a link between metrics and logs and enable you to pivot between dashboards, log analytics, and network maps for easier troubleshooting. Once you deploy the manifest for your clusters, the Datadog Agent will automatically collect Cilium data and forward it to the Datadog platform.
Visualize Cilium metrics and clusters
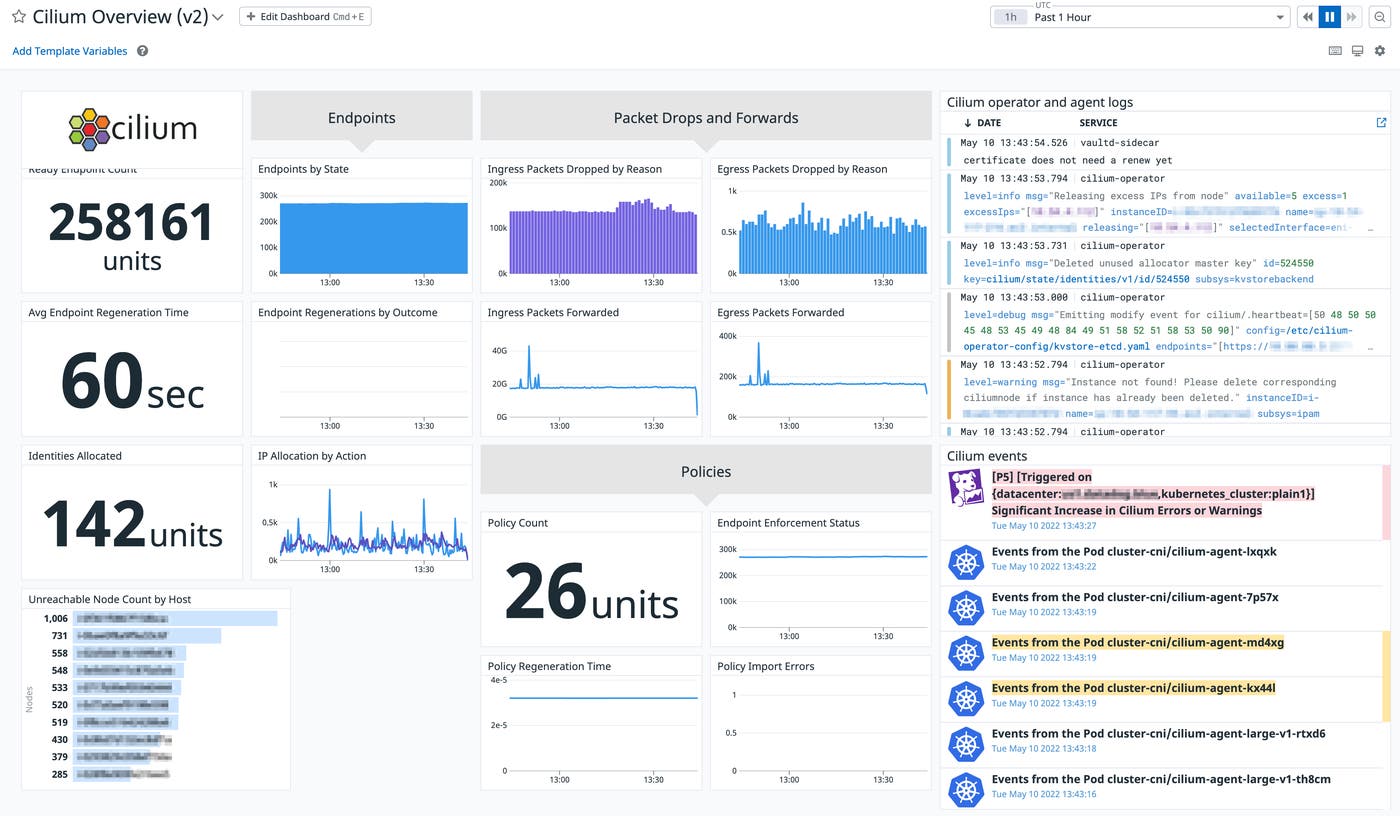
You can view all of the Cilium metrics collected by the Agent in the integration’s dashboard, which provides a high-level overview of the state of your network, policies, and Cilium resources. For example, you can review the total number of deployed endpoints and unreachable nodes in your environment. You can also clone the integration dashboard and customize it to fit your needs. The example dashboard below includes log and event streams for Cilium’s operator and agent, enabling you to compare Cilium-generated events, such as a sudden increase in errors, with relevant metrics.
The dashboard also enables you to monitor agent, operator, and Hubble metrics for historical trends in performance, enhancing Cilium’s built-in monitoring capabilities. Metric trends can surface anomalies in both your network and Cilium resources so you can resolve any issues before they become more serious. For example, the screenshot below shows a sudden spike in the number of inbound packets that were dropped (i.e., drop_count_total) due to a stale destination IP address.
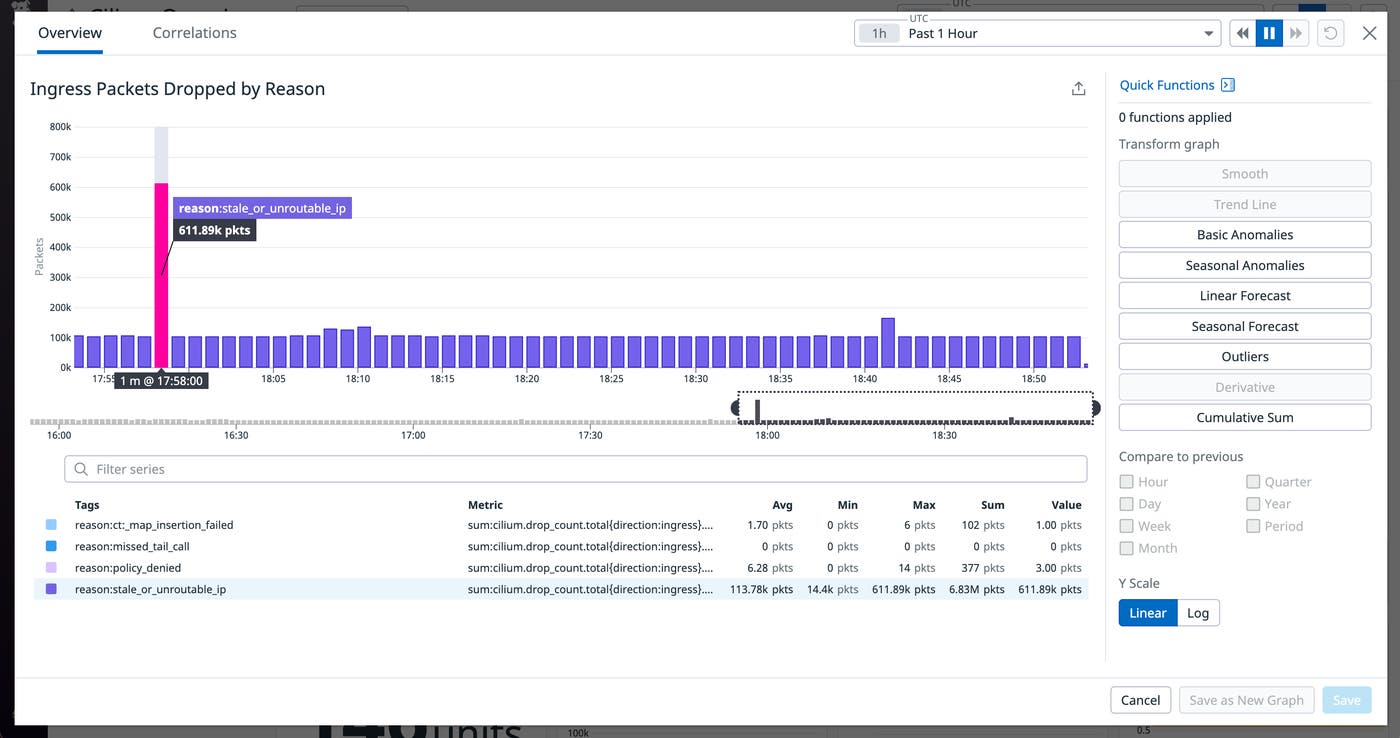
An uptick in dropped packets can occur when the Cilium operator fails to release an IP address from a deleted pod , causing the Cilium agent to route traffic to an endpoint that no longer exists. You can troubleshoot further by reviewing your logs, which provide more details about the state of your Kubernetes clusters and network.
It’s important to note that Cilium provides the option to replace the IP address of a deleted pod with an unreachable route. This capability ensures that services that communicate with the affected pod are notified that its IP address is no longer available, giving you more visibility into the state of your network.
Analyze Cilium logs for network and performance issues
Datadog’s Log Explorer enables you to view, filter, and search through all of your infrastructure logs, including those generated by Cilium’s operator and agent. But large Kubernetes environments can generate a significant volume of logs at any given time, so it can be difficult to sift through that data in order to identify the root cause of an issue. Datadog gives you the ability to quickly identify trends in Cilium log activity and surface error outliers via custom alerts. In the example setup below, Datadog’s anomaly alert will notify you of any unusual spikes in the number of unreachable nodes across Kubernetes services.
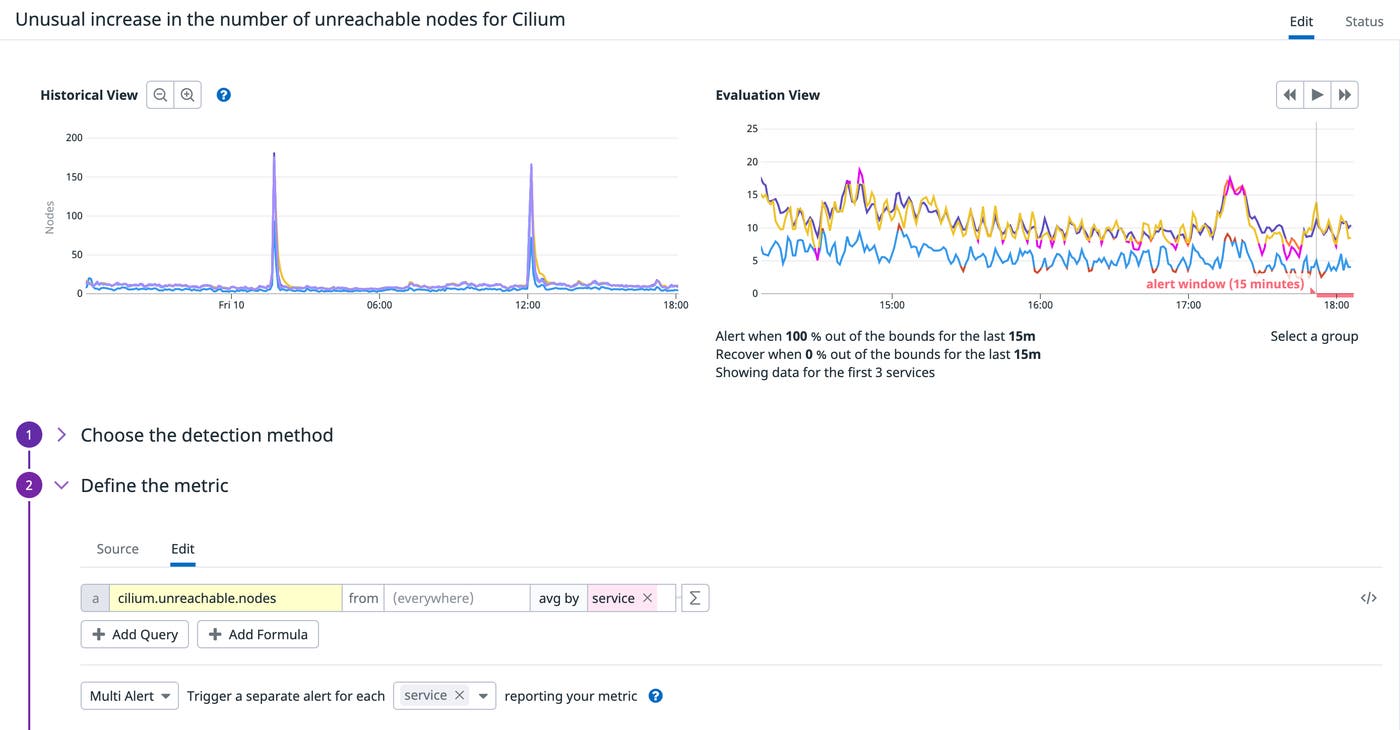
This kind of issue can indicate that a particular node does not have a sufficient amount of disk space or memory to manage the running pods. Without adequate resources, a node will transition into the NotReady status, and it will start evicting running pods if it remains in this state for more than five minutes. As a next step for troubleshooting, you may need to review the status of your pods within an affected node to determine if any were terminated or failed to spin up.
Review pods in the Live Containers view
The overall health of your network is largely dependent upon the state of your Kubernetes resources, and poorly performing clusters can limit Cilium’s ability to manage their traffic. You can visualize all your Cilium-managed clusters in the Live Containers view and drill down to specific pods in order to get a better understanding of their performance and status. For example, you can view all pods within a particular service or application to determine if they are still running. The example screenshot below shows more details about an application pod in the terminating status, which indicates that its containers are not running as expected. The status for each of the pod’s containers show that they were either intentionally deleted (terminated) or failed to spin up properly (exited), which would affect Cilium’s ability to route traffic to them.
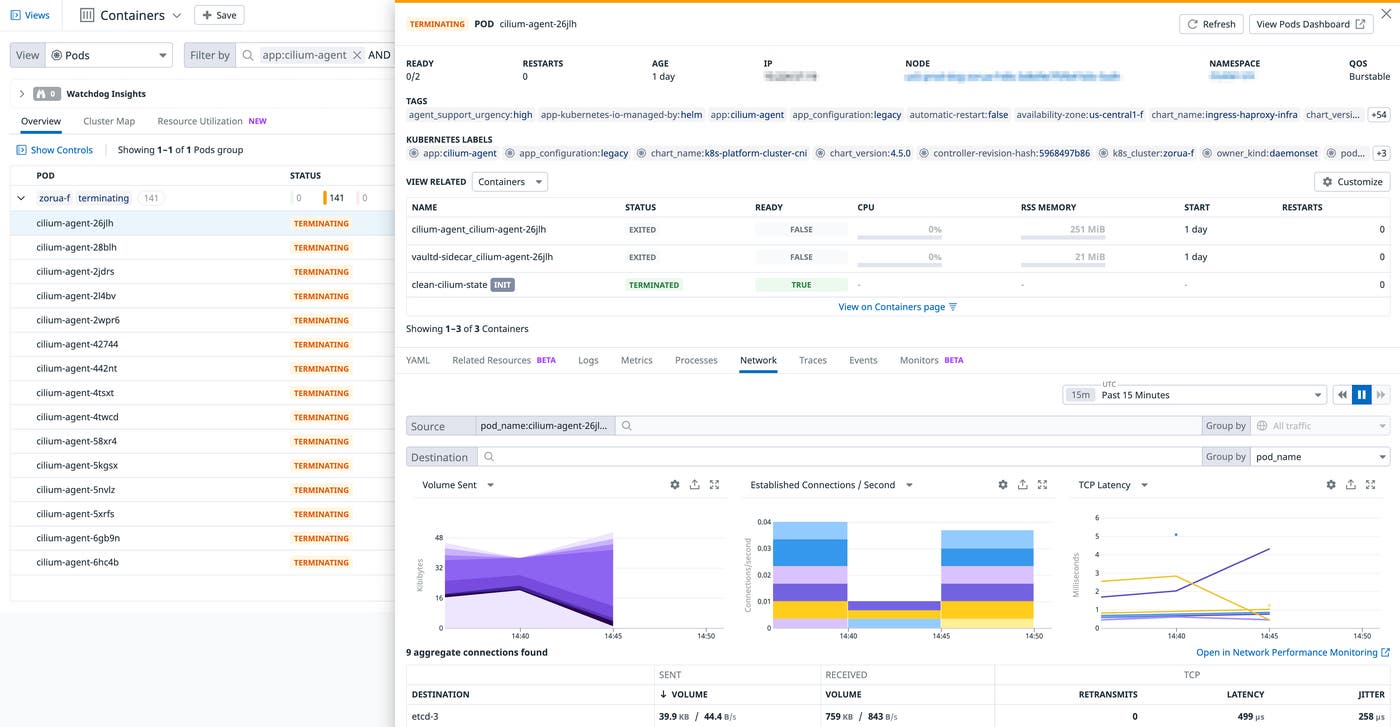
This view also includes the pod’s YAML configuration to help you determine if the problem is the result of a misconfiguration in your cluster (i.e., insufficient resource allocation for the Cilium agent to run alongside your pod’s containerized workloads).
Monitor network traffic across Cilium-managed infrastructure
In addition to monitoring the performance of your Cilium-managed clusters, you can also view network traffic as it flows through your Kubernetes environment with Datadog Cloud Network Monitoring and DNS monitoring. These tools are available as soon as you deploy the Datadog Agent to your Kubernetes clusters and enable the option in your Helm chart or manifest. CNM and DNS monitoring extend Hubble’s capabilities by giving you more visibility into the performance of your network and its underlying infrastructure. You can not only ensure that your policies are working as expected but also easily trace the cause of any connectivity issues back to their source.
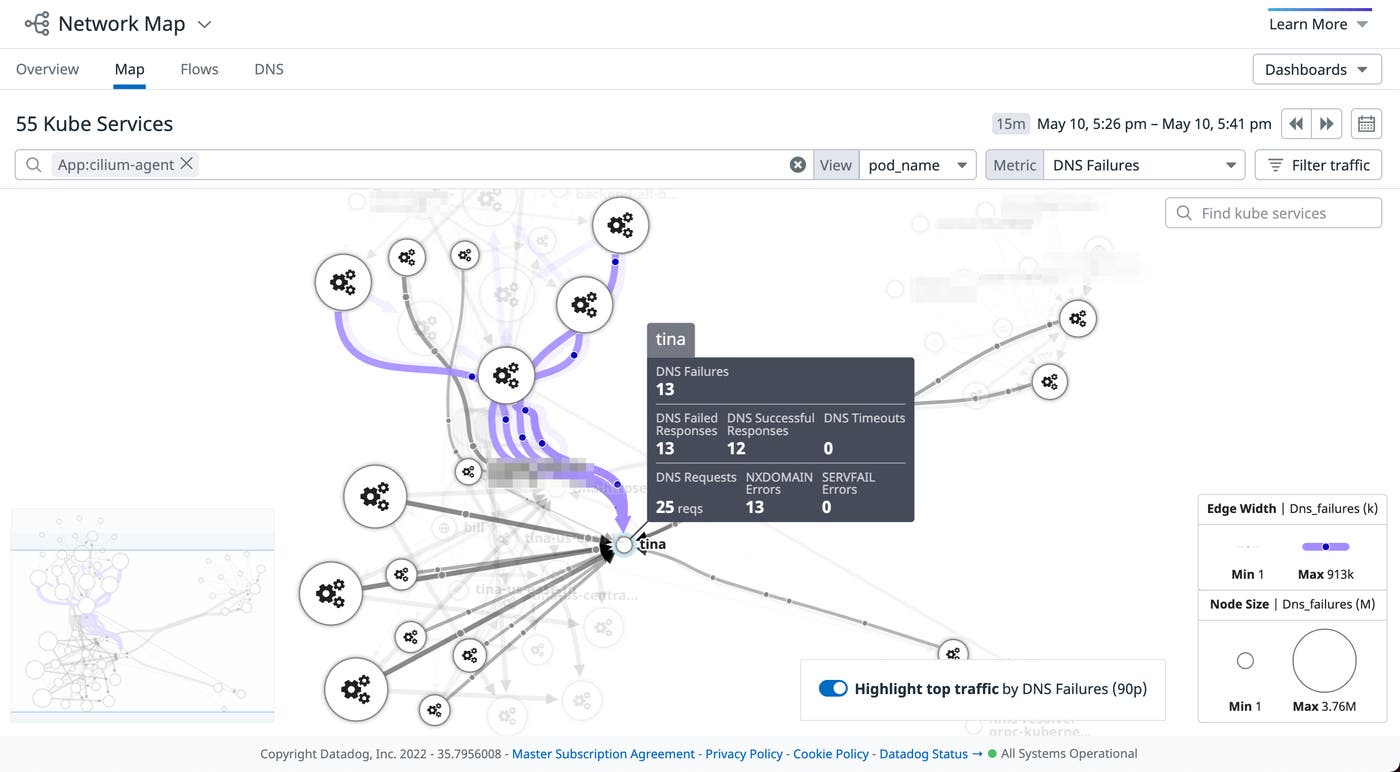
For example, you can use the network map to confirm that endpoints are able to communicate with each other after updating a DNS domain in one of your L7 policies. Datadog can automatically highlight which endpoints managed by a particular policy have the highest volume of DNS-related issues, as seen below.
DNS monitoring can help you troubleshoot further by providing more details about the different types of DNS errors affecting a particular pod. The example screenshot below shows an increase in the number of NXDOMAIN errors across several DNS queries, indicating that the affected pod (tina) is attempting to communicate with domains that may not exist.
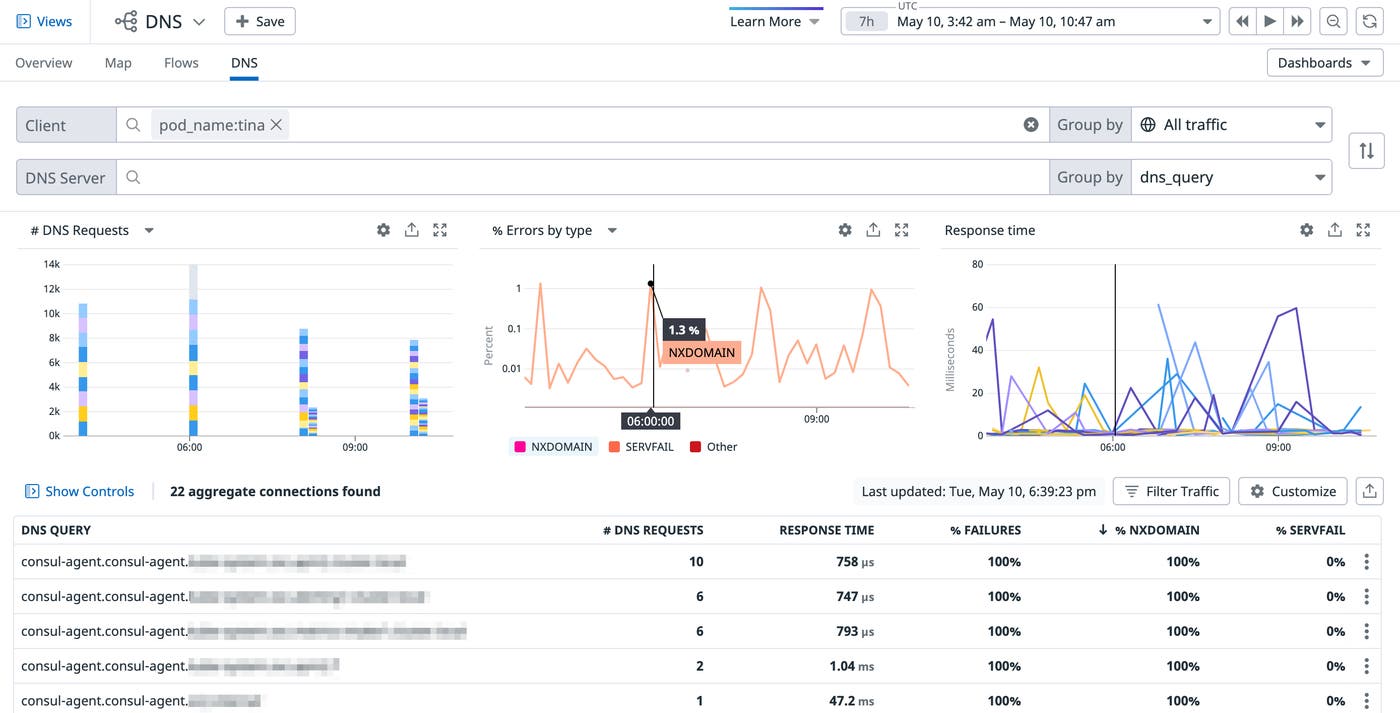
NXDOMAIN errors are often the result of simple misconfigurations in your network policies. If your policies are correct, however, caching could be the culprit. Cilium can leverage Kubernetes’ NodeLocal DNSCache feature to enable caching for certain responses, such as NXDOMAIN errors. Caching attempts to decrease latency by limiting the number of times a Kubernetes resource (e.g., pods) queries a DNS service for a domain. But in some cases, pods can cache outdated responses, triggering a DNS error for legitimate domains. Restarting the affected pod can help mitigate these kinds of issues.
Start monitoring Cilium with Datadog
In this post, we looked at how Datadog provides deep visibility into your Cilium environment. You can review key Cilium metrics in Datadog’s integration dashboard and pivot to logs or the Live Container view for more insights into cluster performance. You can also leverage CNM and DNS monitoring to view traffic to and from pods in order to troubleshoot issues in your network. Check out our documentation to learn more about our Cilium integration and start monitoring your Kubernetes applications today. If you don’t already have a Datadog account, you can sign up for a free 14-day trial.
