Mallory Mooney
Cilium is a Container Network Interface (CNI) for securing and load-balancing network traffic in your Kubernetes environment. As a CNI provider, Cilium extends the orchestrator's existing network capabilities by giving teams more control over how they build their applications and monitor traffic. For example, vanilla Kubernetes installations typically rely on traditional firewalls and Linux-based network utilities like iptables to filter pod-to-pod traffic by an IP address or port. But managing network communication with standard firewall rules is more difficult when these environments experience high rates of churn among pods—and consequently IP addresses.
Cilium alleviates these pain points by allowing you to build advanced identity and application-aware network policies. For example, you can leverage container, pod, or service metadata in your policies in addition to typical protocols, such as DNS, HTTP, TCP, and UDP. These measures replace traditional firewalls and enable cross-cluster communication, allowing teams to build more advanced design patterns like multi-region database architectures.
The platform is able to offer these enhanced security and networking capabilities by leveraging Extended Berkeley Packet Filter (eBPF) to apply network and security logic in the Linux kernel, without modifying application code or container configurations. eBPF enables Cilium to manage your network while decreasing any CPU overhead on worker nodes in a cluster. These enhancements free up resources so that the cluster can scale and manage workloads more efficiently.
Monitoring Cilium ensures that your Kubernetes applications are processing requests as expected, making it a critical part of securing your overall environment and supporting your distributed applications. In this post, we'll walk you through Cilium's architecture as well as some of the key metrics you should be monitoring for the following areas:
We'll also reference terminology from our Monitoring 101 series, which provides a framework for metric collection.
Cilium's architecture and performance data
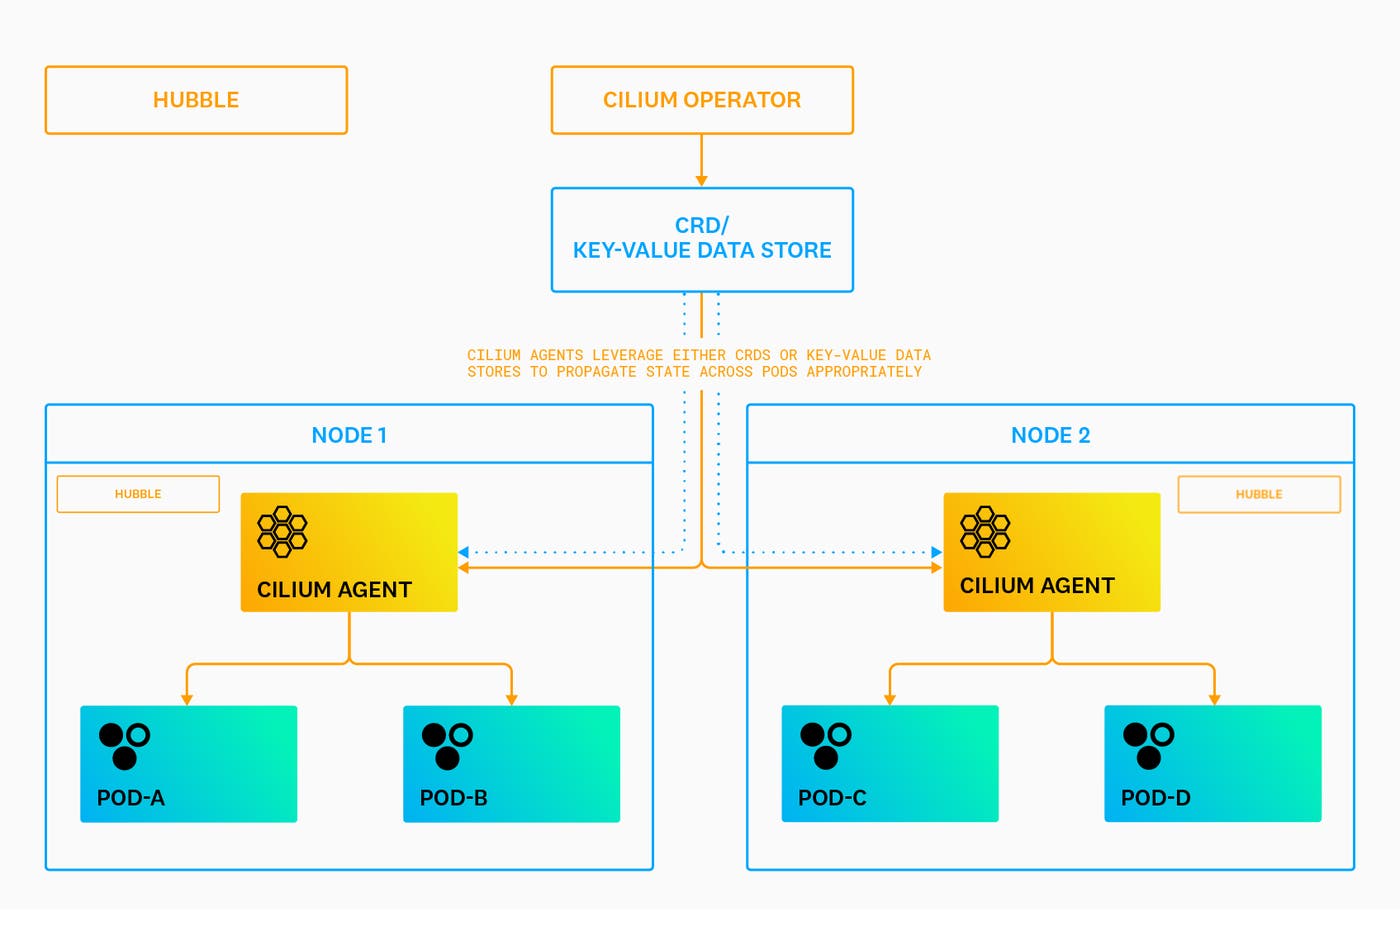
Cilium deployments include several key, container-based components for overseeing Kubernetes configurations, IP address management (IPAM), and network observability. In this post, we'll focus on the Cilium Operator, the Cilium agent, and Hubble.

The Cilium Operator handles cluster-wide operations, such as garbage collection for pods (i.e., endpoints) and IP address allocation for nodes—we'll talk about IPAM in more detail later. Cilium's agents run on every node in order to assign the available IP addresses to each pod and manage network throughput. This information, along with other network policies and cluster configurations, are housed in either custom resource definitions (CRDs) or key-value data stores. Agents use these resources in order to propagate state across pods appropriately. Finally, Hubble provides visibility into pod-to-pod network traffic and is built on top of the Cilium platform. We'll look at how you can use Hubble to monitor network flows, the state of your policies, DNS traffic, and more in Part 2 of this series.
Each of these components expose metrics via Prometheus, an extensible toolkit for generating timeseries data. Metrics are also tagged with metadata that provides more context for what is being measured, enabling you to easily aggregate data in order to surface specific performance trends. Together, this information gives you better visibility into the health and state of your network and infrastructure. We'll discuss some of these key metrics in more detail next.
Endpoint health metrics
As previously mentioned, Cilium's agents are responsible for managing traffic between endpoints, so monitoring their health can help you troubleshoot cluster-level network issues. But before we dive into the metrics, we'll briefly look at how agents control traffic across endpoints.
Each endpoint has a security identity that is made up of the pod's existing Kubernetes labels. These identities are used as part of your network policies for greater control over which pods can send and receive requests. When you configure and apply a policy, Cilium's agents encode that information in BPF maps. Maps are the per-endpoint, kernel-level data structures that list which identities from your policies are allowed for the particular pod. In addition to your pods, agents also manage dedicated health endpoints that expose Cilium's health status API on each node. Health endpoints enable agents to test connectivity between nodes and can provide valuable insights into network throughput.
| Metric | Labels | Description | Metric Type |
|---|---|---|---|
| ipam_available | N/A | The total number of interfaces with addresses available | Resource: Other |
| ipamnodesat_capacity | N/A | The total number of nodes in which the Operator is unable to allocate IP addresses | Resource: Other |
| endpoint_state | state | The total number of endpoints on a node at a given point in time | Resource: Other |
| bpfmapops_total | map_name, operation, outcome | The total number of eBPF map operations performed | Resource: Other |
| endpointregenerationstotal | outcome | The total number of completed endpoint regenerations | Resource: Other |
| endpointregenerationtimestatsseconds | scope | The amount of time taken to regenerate an endpoint | Resource: Utilization |
| unreachable_nodes | N/A | The total number of nodes that cannot be reached by Cilium | Resource: Error |
| unreachablehealthendpoints | N/A | The total number of health endpoints that cannot be reached by Cilium | Resource: Error |
Metric to watch: ipam_available
Vanilla Kubernetes assigns a pool of IP addresses to each node, allowing all of its pods to have a unique address. The Cilium platform extends Kubernetes' capabilities by offering several different IPAM modes for allocating IP addresses to pods. In general, the Cilium Operator replaces Kubernetes to manage IP pools and identify which IPs are available or no longer in use on a node's network interface (i.e., eth0). Cilium can leverage your underlying network, such as Google Cloud's network layer or AWS Elastic Network Interfaces, to natively assign IP addresses to pods.
The ipam_available and ipam_nodes_at_capacity metrics capture how many interfaces with IP addresses are available for allocation across nodes and the total number of nodes unable to receive IPs, respectively. The number of interfaces (e.g., the value for the ipam_available metric) should equal the number of nodes in your cluster, indicating that each one has assignable IP addresses for new pods. Any discrepancy could mean that the Cilium Operator could not allocate more IP addresses. This scenario can prevent pod-to-pod communication for critical application services and limit your ability to scale clusters.
You can investigate further by comparing the ipam_available metric to the ipam_nodes_at_capacity metric to determine if the issue is related to your nodes.
Metric to alert on: ipam_nodes_at_capacity
This metric captures the total number of nodes in which the Cilium Operator is not able to allocate more IP addresses. A high value could indicate that your nodes have reached Kubernetes limits for pods. Scaling down unnecessary pods can help the Operator release IP addresses and make them available for new endpoints. You can also reduce the maximum number of pods running per node to ensure that the Operator does not attempt to allocate more IP addresses than necessary.
Metric to watch: endpoint_state
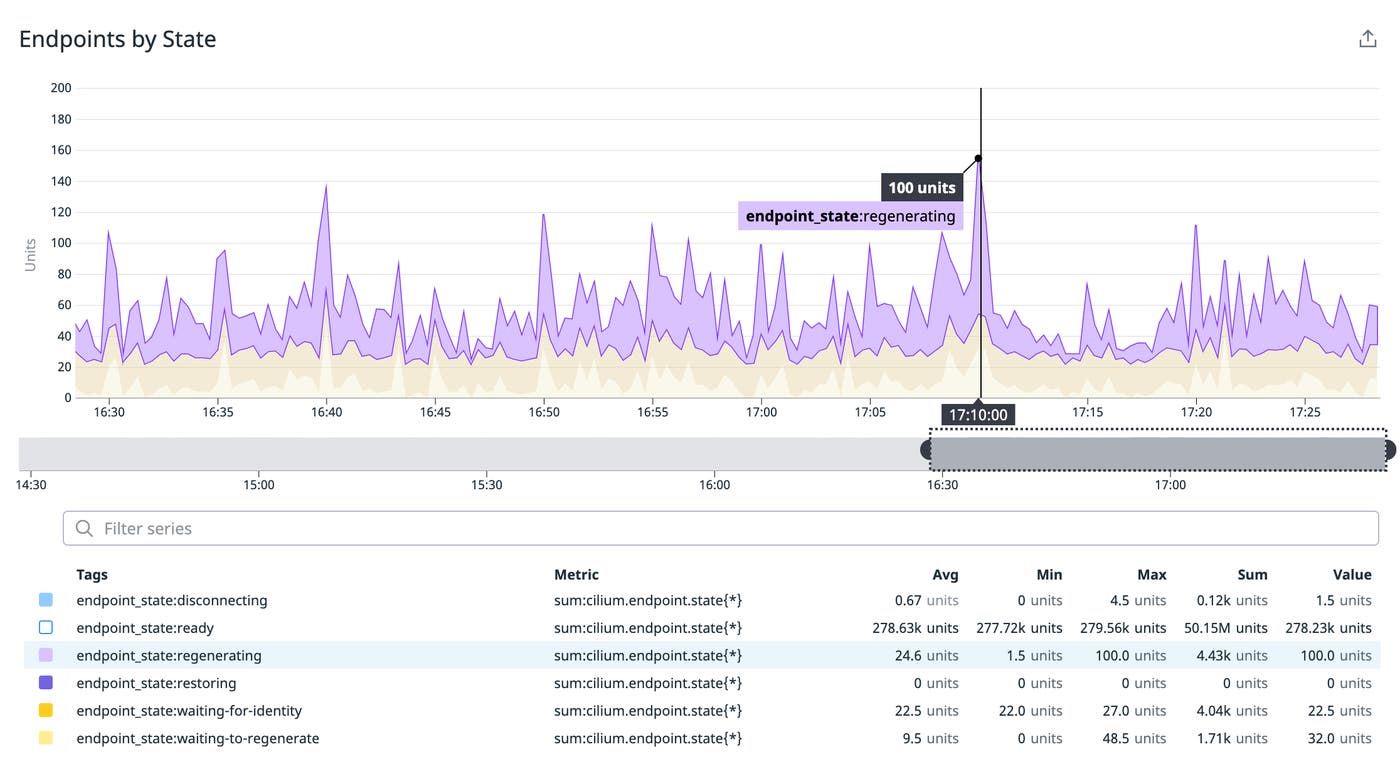
Cilium agents can only enforce policies on pods that are a part of their network. Unmanaged pods are typically the result of deploying workloads to a cluster before installing or running Cilium, which can cause the platform to miss any newly created pods in your environment. You can compare the number of Cilium-managed pods on a node (endpoint_state) with its total pod count in order to determine which ones are not managed by the platform.
The metric's state tag provides additional information about which stage a group of endpoints are in, based on Cilium's endpoint lifecycle. With this, you can monitor the status of all your pods as Cilium applies and updates network policies. For example, a group of endpoints with the regenerating status indicates that the agent is updating its networking configuration. It's critical to monitor pods in this state to ensure that they receive new policy updates as expected.

Metrics to watch: endpoint_regenerations_total, bpf_map_ops_total
The endpoint_regenerations_total metric captures the total number of regenerations in your environment, as well as their outcome via either a success or failure tag. A sudden increase in the number of failed regenerations means that one or more endpoints did not receive the appropriate policy updates, which could affect their ability to process requests from other sources.
This problem can sometimes occur when the Operator is not deployed in long-running environments and is therefore unable to remove any stale identities. Without garbage collection, the Cilium agent will attempt to apply network policies to BPF maps for every active and stale identity as new endpoints spin up. BPF maps have pre-configured limits for the number of allowed identities, so the regeneration process can fail if they are reached.
You can compare the endpoint_regenerations_total metric with the bpf_map_ops_total metric to determine if the cause is related to BPF map operations. This metric includes tags that provide more insight into the affected map, its operation, and outcome. A high number of failed operations could indicate that you have reached identity thresholds.
Metric to watch: endpoint_regeneration_time_stats_seconds
This metric measures how long it takes for an endpoint to regenerate. Cilium utilizes a portion of a cluster's available resources to operate, and a high value could indicate that a cluster is churning more pods than Cilium can process. You can troubleshoot further by reviewing the amount of memory or CPU allocated to a cluster to determine if Cilium has enough processing power to regenerate endpoints.
Metrics to alert on: unreachable_nodes and unreachable_health_endpoints
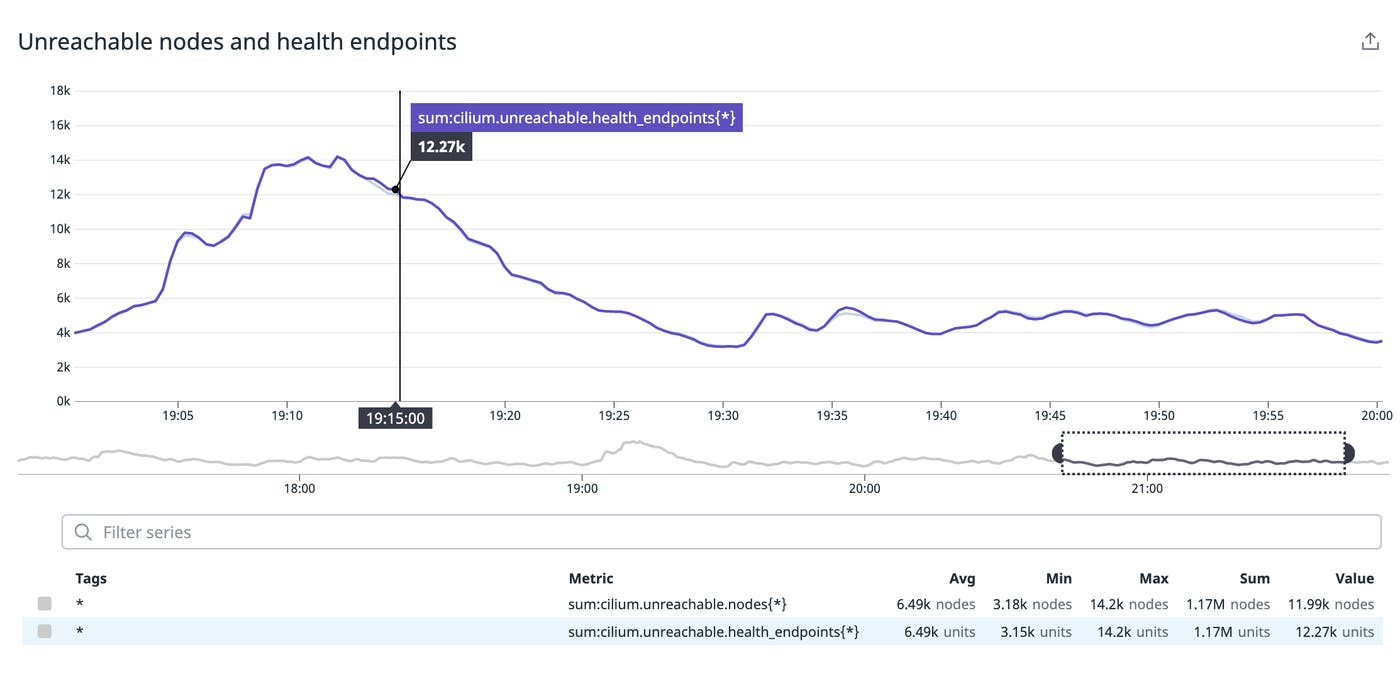
These metrics ensure that Cilium is running on all cluster nodes and that they are configured appropriately. For example, the unreachable_nodes metric indicates that Cilium is not able to connect to endpoints on another node. You can troubleshoot by determining if Cilium is also not able to connect to health endpoints on the same node (i.e., unreachable_health_endpoints). If the number is the same for both metrics, it could mean that a policy rule is interrupting the flow of traffic.

It's important to note that health checks are useful for monitoring traffic on small clusters, but Cilium recommends disabling them for clusters with more than 200 nodes.
Network performance metrics
Both Cilium and Hubble generate metrics that provide better insight into how Kubernetes processes requests. The Hubble platform is made up of a stand-alone relay service and server instances that generate network-level metrics per pod. You can view this data via Hubble's available UI or CLI, which we'll look at in more detail in Part 2 of this series.
Monitoring the following metrics gives you better insight into network performance.
| Metric | Labels | Description | Metric Type |
|---|---|---|---|
| httprequeststotal | method, protocol | The total number of HTTP requests | Work: Throughput |
| dnsqueriestotal | rcode, qtypes, ips_returned | The total number of DNS queries | Work: Throughput |
| dropcounttotal | reason, direction | The total number of dropped packets | Work: Throughput |
| httpresponsestotal | method, status | The total number of HTTP responses | Work: Throughput |
| dnsresponsestotal | rcode, qtypes, ips_returned | The total number of of DNS responses | Work: Throughput |
| httprequestduration_seconds | method, protocol | The duration of an HTTP request in seconds | Work: Performance |
Metrics to watch: http_requests_total, dns_queries_total
These metrics enable you to watch HTTP and DNS traffic in your network at a high level. Their values may fluctuate depending on application usage, such as throughput spikes during business hours, but a sudden drop in either metric indicates connectivity issues. You can leverage Hubble to troubleshoot each layer of a request, such as TCP connections and DNS queries, in order to pinpoint the source of an issue.
Metrics to alert on: drop_count_total, http_responses_total, dns_responses_total
You can detect the initial signs of connectivity issues at various network layers by alerting on the drop_count_total and http_responses_total metrics. For example, a sudden spike in the total number of dropped packets (drop_count_total) could indicate an issue with your layer 3 (L3) policies. Layer 3 establishes the primary networking rules for endpoint-to-endpoint communication. An increase in the number of 5xx (http_responses_total, grouped by status) or SERVFAIL (dns_responses_total, grouped by rcode) response codes, on the other hand, could be a sign that your layer 7 (L7) policies are not configured to allow traffic from a specific Kubernetes service.
Metric to alert on: http_request_duration_seconds
The http_request_duration_seconds metric can alert you to a sudden influx of API calls to your endpoints. This activity will cause the duration of requests to steadily increase until the Cilium agent throttles them, returning a 429 response code to the initial requester. You can compare this value with the cilium_api_limiter_processing_duration_seconds metric to confirm that Cilium is attempting to control the rate of API calls to a particular endpoint.
In most cases, the rate-limiter, which protects against starving your resources or triggering a service outage, is correctly mitigating traffic. But you may need to take further action if requests from a particular source are frequently throttled. Optimizing a particular service to reduce the frequency of API calls, for example, can help ensure that it does not hit Cilium's configured rate limits.
Network policies
Pod identities enable Cilium to build enhanced network policies for multiple layers of the OSI model. This model provides standard protocols for system-to-system communication. Kubernetes only supports the network (L3) and transport (L4) layers of the OSI model, but Cilium expands support to the application (L7) layer. This capability enables you to enforce networking rules on a particular endpoint based on several different protocols, such as a group of IP addresses, ports, and DNS entries.
Monitoring policy activity ensures that they appropriately manage traffic across your network, including traffic from potentially malicious sources.
| Metric | Labels | Description | Metric Type |
|---|---|---|---|
| policyl7total | type | The total number of requests and responses at L7 | Resource: Utilization |
| policyimporterrors_total | N/A | The total number of times a policy import has failed | Resource: Error |
| policyl7parseerrorstotal | N/A | The total count of parsing errors prior to any L7 policy enforcement | Resource: Error |
| policyl7denied_total | N/A | The total count of requests that were denied by an L7 security policy | Resource: Error |
Metric to watch: policy_l7_total
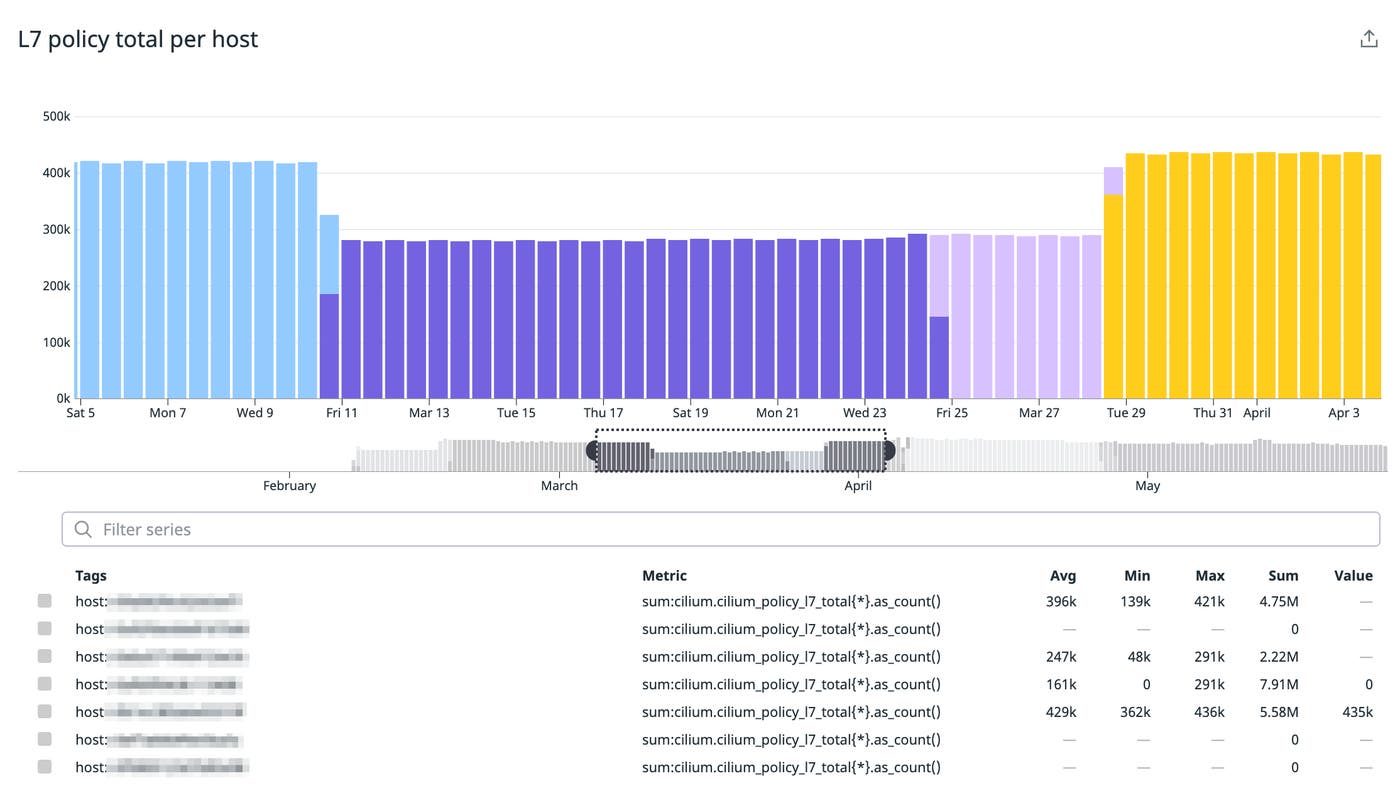
Your L7 policies are a critical part of managing traffic at the application layer, which is responsible for handling HTTP requests from end users. The policy_l7_total metric measures the total number of HTTP requests and responses to and from your services, providing a high-level overview of current network activity. Sudden drops in this metric could mean that a service or end user is unable to communicate with another resource in your application.

Metrics to alert on: policy_import_errors_total, policy_l7_parse_errors_total, policy_l7_denied_total
Connectivity issues are typically a result of misconfigured policies, so Cilium provides specific metrics per policy type to help you monitor their status. For example, Cilium will automatically deny traffic to a pod if an associated L7 policy includes a syntax error. Cilium may also fail to import an L3 or L4 policy if either one contains a typo. As such, alerting on the number of policy import and parsing errors can help you quickly flag any issues in policy syntax.
Your L7 policies can also protect against targeted threats on your network. For example, an increase in the policy_l7_denied_total metric could indicate a denial-of-service attack, a technique that attempts to flood services with requests in order to trigger an outage. Alerting on the number of denied requests at this layer can help mitigate any threats before they become more serious.
API processing and rate-limiting
The Cilium agent is event driven; when a newly scheduled workload, network policy, or other configuration is deployed onto a node, the agent will create or modify endpoints as needed. Cilium will rate-limit an agent's API calls to endpoints in order to ensure that it does not consume too many resources or affect the performance of downstream services. Monitoring rate-limit activity can ensure that the agent is mitigating bursts of activity on a node as expected.
| Metric | Labels | Description | Metric Type |
|---|---|---|---|
| ciliumapilimiterprocessedrequests_total | api_call, outcome | The total number of API requests processed by the agent | Work: Throughput |
| ciliumapilimiterrequestsin_flight | api_call, value | The current number of requests in flight | Work: Throughput |
| ciliumapiprocesstimeseconds | api_path, api_method,http_response_code | The total processing time of all API calls made to the Cilium agent | Work: Throughput |
Metric to watch: cilium_api_limiter_processed_requests_total
These metrics provide an overview of current activity in your network. A sudden drop in the cilium_api_limiter_processed_requests_total metric means that the agent is no longer actively processing API calls or is processing fewer calls than normal for a particular pod. This issue could be the result of an endpoint failing to regenerate after a policy update, or it could signal that the agent is no longer able to communicate with another node. You can either review the state of your policies or the number of unreachable nodes to determine the root cause.
Metric to watch: cilium_api_limiter_requests_in_flight
The cilium_api_limiter_requests_in_flight metric captures the number of active API calls to and from a pod. The agent's rate-limiter will only allow a certain number of calls to run in parallel, based on its parallel-requests parameter. When the number of in-flight calls reaches its maximum allowed value, new calls will sit in a queue to be processed for a period of time before the agent returns a 429 HTTP response to the client. Monitoring this metric ensures that each agent deployed to your pods can appropriately scale with your Kubernetes application.
Metric to alert on: cilium_api_process_time_seconds
Cilium will monitor the processing time for each API call and automatically adjust rate limits to maintain a steady duration based on your configured parameters. Processing time is reflected in the cilium_api_process_time_seconds metric and should typically stay below the rate-limiter's estimated-processing-duration parameter. However, if this metric consistently hits that duration limit, you may need to adjust your parameters or determine if Cilium has enough resources to process requests.
Monitor Cilium-managed Kubernetes clusters
In this post, we looked at some key metrics for monitoring the health of your Cilium-managed Kubernetes clusters and network. In the next post, we'll walk through how to use Hubble to visualize network traffic, and in Part 3, we'll show how to monitor Cilium data and your Kubernetes network in one place with Datadog.
Acknowledgments
We'd like to thank the Cilium team for their technical reviews of Part 1 of this series.

