Jean-Mathieu Saponaro
Amazon Kinesis is a managed service for ingesting, processing, and managing data streams in the AWS cloud. It is used for large, distributed streams such as clickstreams, event logs, and social media feeds. After processing the data, Kinesis can distribute it to multiple consumers simultaneously. (If you are familiar with Kafka, Kinesis’s functionality is very similar to Kafka’s.)
If you are using Kinesis in production, you probably want to know right away if there are any slowdowns or other issues that might affect your users. And we have good news—we just added Amazon Kinesis performance monitoring to Datadog.
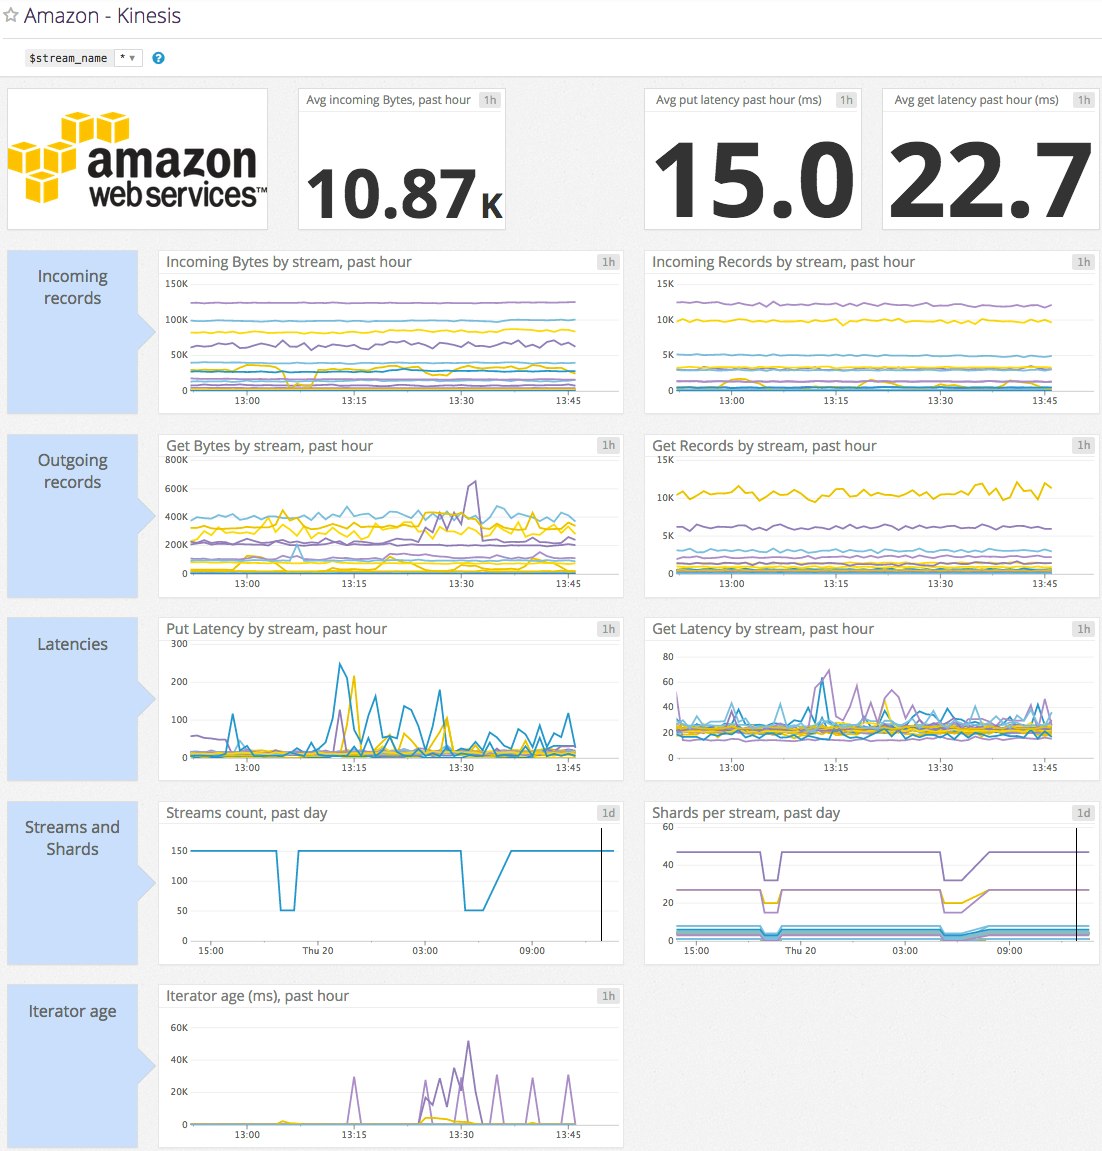
Key Amazon Kinesis performance metrics
Monitoring the following key metrics can help ensure that Kinesis is performing at its best:
- Number of incoming (put) requests: Sudden changes in the number of put requests can indicate important upstream changes. For example, a precipitous drop could be caused by network issues or problematic application change, while a significant increase may require you to provision additional resources.
Note: For incoming records, you should usually monitor IncomingBytes and IncomingRecords instead of PutRecord.Bytes and PutRecord.Success. The former tracks all puts, while the latter only tracks single-record puts.
-
Number of outgoing (get) requests: When investigating problems, this metric can provide useful context, e.g. “are gets at ordinary levels?”
-
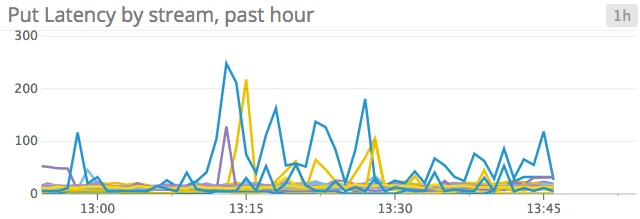
Latency, if you are using Kinesis, your application probably demands low latency real time data, both for reads (gets) and writes (puts). Not only can you track these metrics with Datadog, but you can also correlate them with what’s happening in the rest of your infrastructure to better understand causes of problems, and their rippling effects.
-
Iterator age represents the age of the newest record read from Kinesis. This metric shows how far behind your readers are in comparison to the incoming data. Depending on your usage, you can set up your own alert thresholds for iterator age to minimize lag.
-
The evolution of the number of shards per stream can now be visualized; shards represent a unit of read/write processing capacity. This metric allows you to see how Kinesis scaled up and down over time, and correlate its capacity with other metrics. By monitoring this metric, you can ensure that there are enough shards per stream to maintain performance while minimizing unnecessary resource costs.
Custom tags
AWS recently launched custom tags that you can apply to Kinesis streams. You can now use these tags within Datadog to split, aggregate, or filter your metrics, just as you can with your EC2 instance metrics.
Set up alerts
You can, of course, use all the alerting features Datadog offers to be notified whenever something seems to be abnormal with one of your Kinesis metrics.
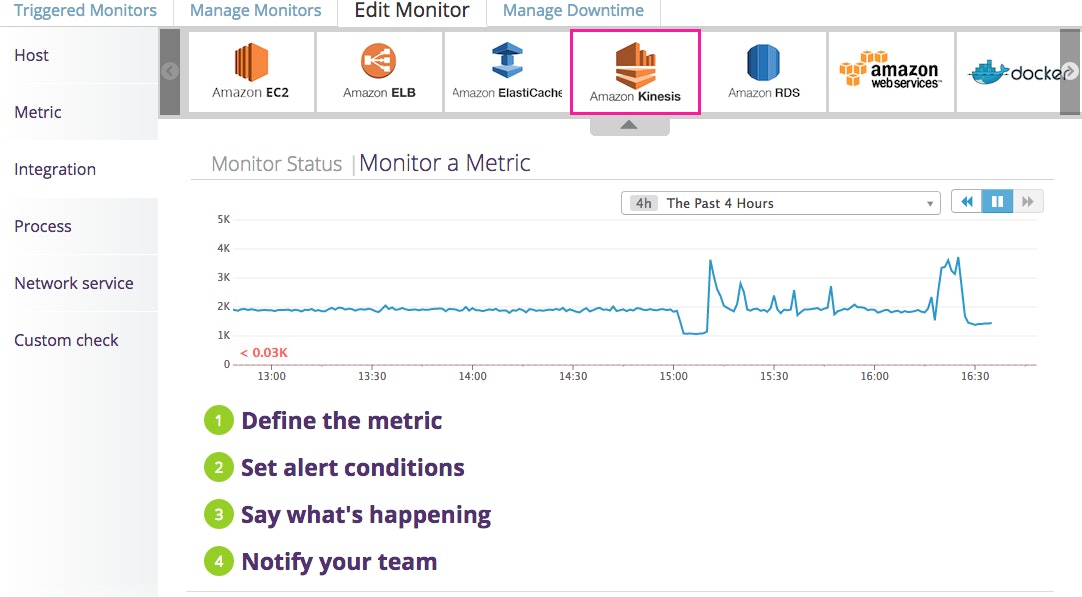
Already a Datadog customer? Try the Kinesis integration here. Otherwise, to it try out in your own environment, you can sign up for a free trial of Datadog!
