Thomas Sobolik
Embrace is a mobile application monitoring solution that helps you track and troubleshoot mobile app performance by combining data analytics, real user monitoring, network performance monitoring, and hardware monitoring in a single platform. We’re pleased to partner with Embrace to offer an out-of-the-box Embrace Datadog app and software license in the Datadog Marketplace. By collecting KPIs for crashes and HTTP errors from your mobile applications alongside key debugging context—such as stack traces and the availability of specific endpoints—the Embrace Datadog app enables you to spot ongoing regressions and quickly kick off root cause analysis. The app is integrated seamlessly with Datadog’s full-stack observability platform, so you can easily view this data side-by-side with network telemetry and performance metrics from the backend infrastructure that your mobile apps rely on. In this post, we’ll discuss how you can use the app to:
- Track and investigate the root cause of crashes
- View network telemetry from your apps side-by-side with backend network metrics from Datadog NPM
Track and investigate mobile app crashes
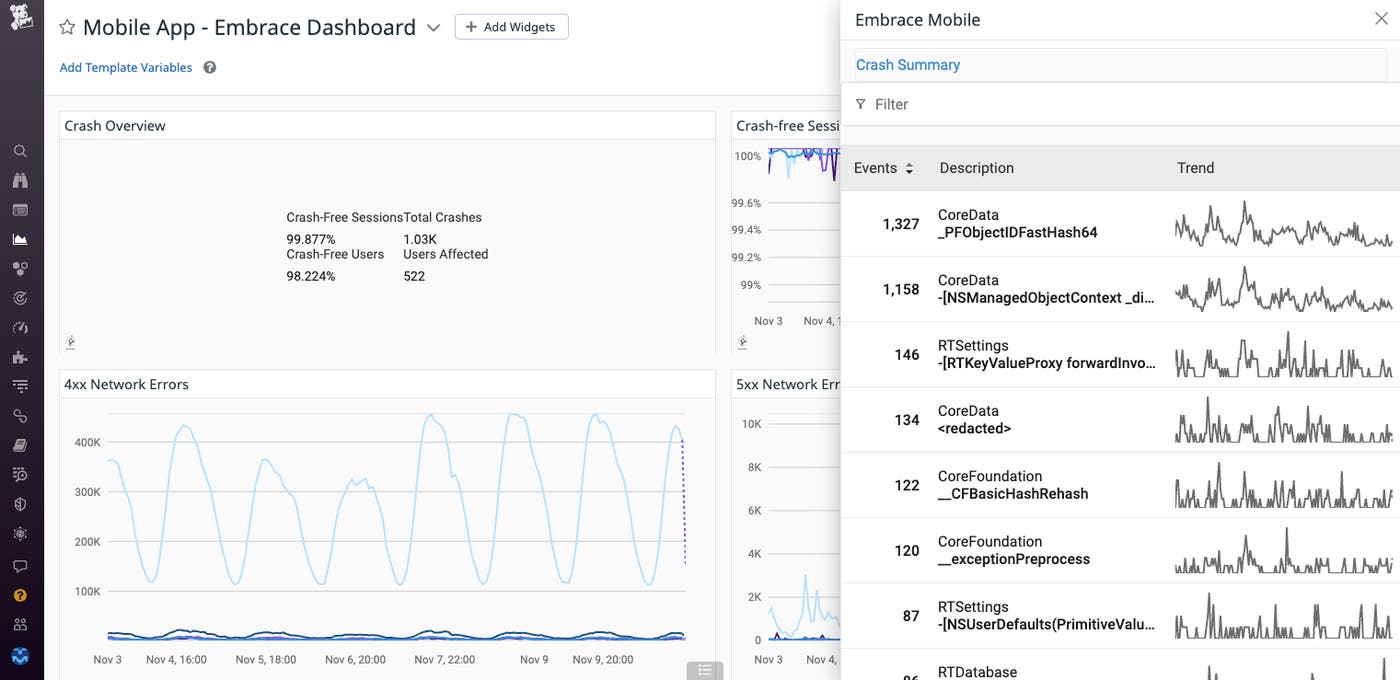
The Embrace Datadog app includes a suite of crash reporting dashboard widgets that visualize key crash metrics and KPIs for a given time span. These metrics include:
- Percentage of crash-free sessions
- Total number of crashes reported
- Percentage of users experiencing crashes
- Total number of users experiencing crashes
By providing the widgets in an out-of-the-box dashboard, the app enables you to routinely monitor for data anomalies that could indicate a regression in your mobile application’s code. You can also add the widgets to your existing Datadog full-stack dashboards to compare mobile app crash metrics with relevant logs, infrastructure health metrics, and other telemetry from your app’s dependencies—and quickly scan for evidence of related issues downstream. Once you’ve spotted a performance regression, such as a spike in the percentage of users experiencing crashes, you can leverage the included crash analysis side panel to kick off root cause analysis. In the Summary tab, you can view the count, error type, and time trend for each ongoing crash issue, and then filter the crashes by app version or device OS version to determine if the regression can be linked to a recent app version release or OS update.
To kick off debugging, click a crash and open the Crash Details tab. Here, you can inspect a stack trace for the crash to determine exactly where the app’s code is failing. You can then pivot directly from the crash stack trace to the Embrace User Timeline, shown below, which provides a detailed view of the user’s entire app experience. This helps you put the crash in context with the user’s device state and identify events—such as slow or failing network calls, previous UI actions, and breadcrumbs being added—that may have contributed to the crash.
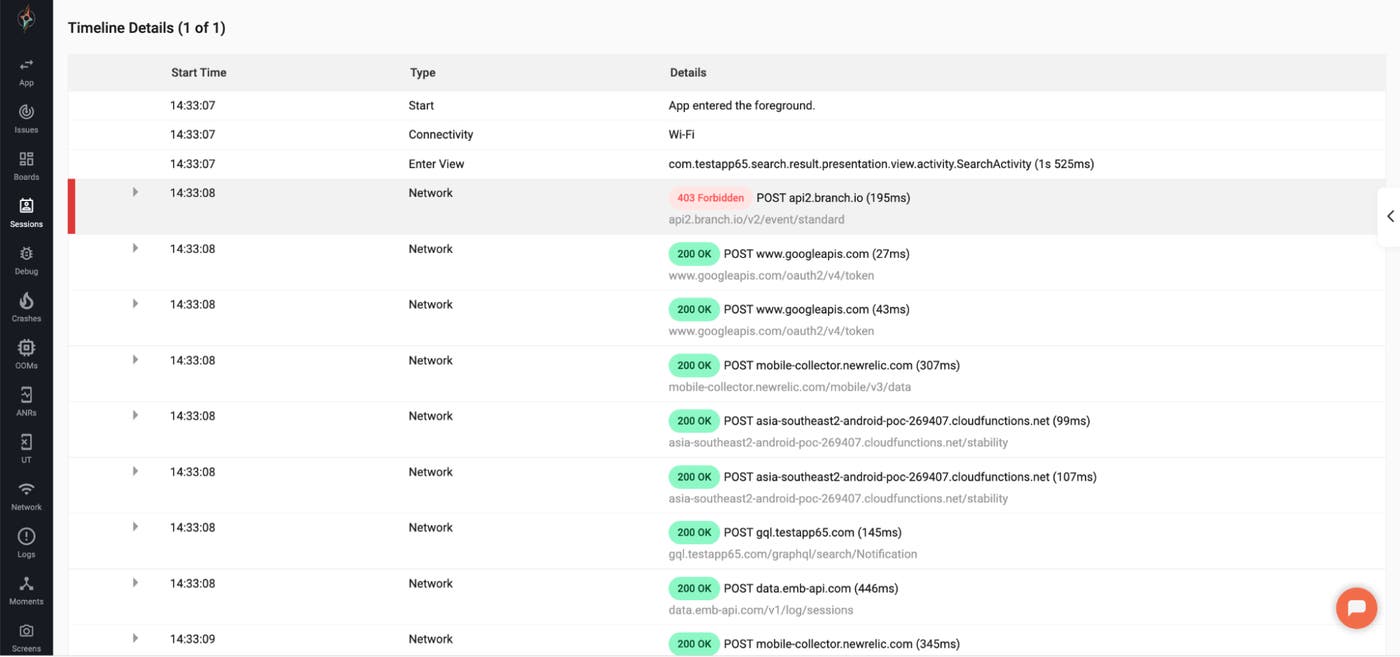
With all of these insights in place, your teams can more quickly understand what’s causing crashes and decrease their MTTR, leading to improved app stability and UX performance.
Understand your apps’ network performance
In addition to providing context for debugging crashes and app errors, the Embrace app also collects network telemetry, enabling you to monitor network traffic between your app and its backend to spot spikes in HTTP errors, timeouts, and other connectivity issues. The app includes network widgets that visualize network traffic metrics from Embrace, including the rate of 4xx and 5xx errors. If you spot a spike in HTTP errors from your mobile application, you can click the Embrace logo on a widget to open a side panel that provides more context for troubleshooting. The side panel lists each endpoint experiencing network errors, in descending order of the percentage of errorful requests. From this view, you can easily triage the worst-affected endpoints and directly pivot to Embrace to surface key details for root cause analysis.
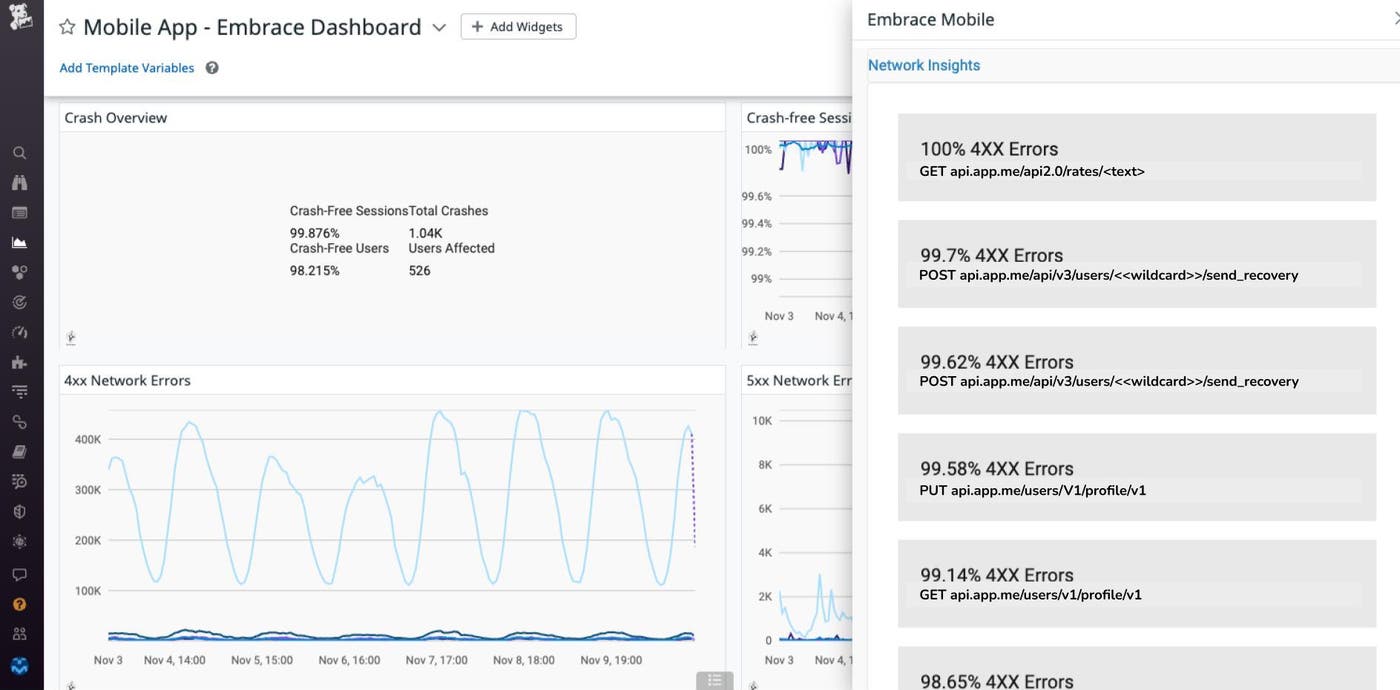
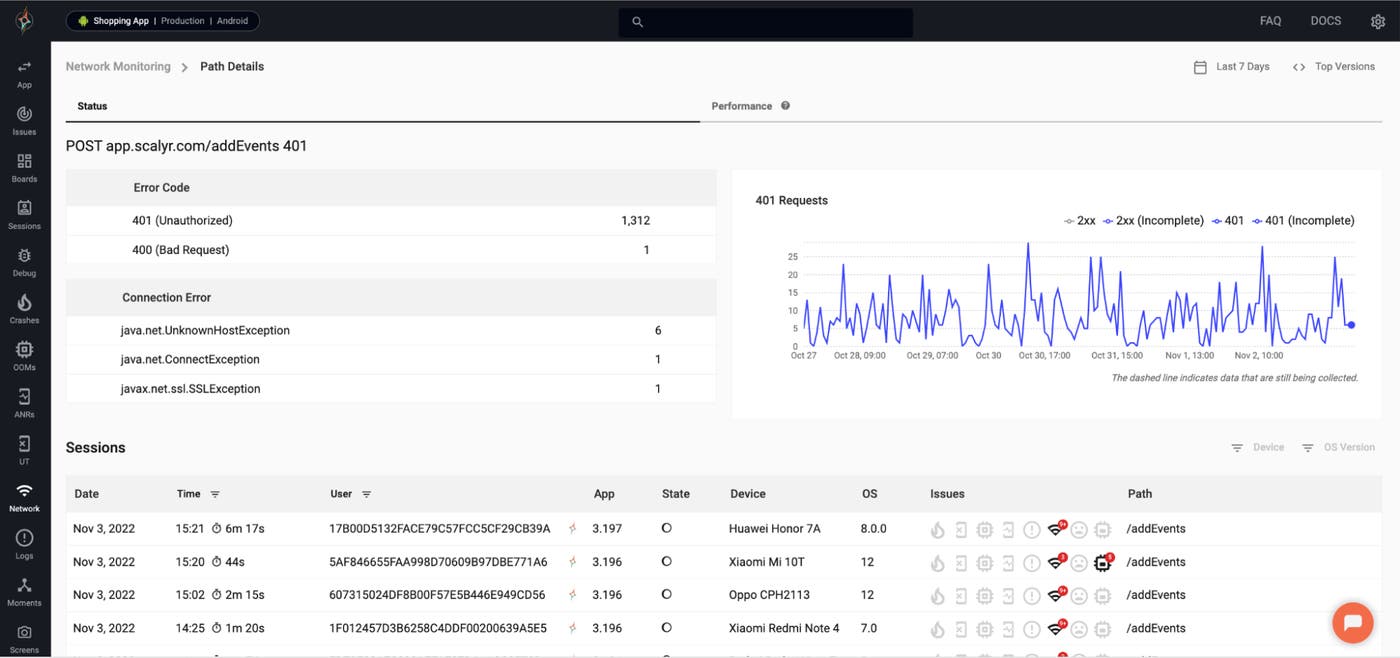
From the Embrace Network Monitoring dashboard, which is shown below, you can view a breakdown of all the errors on the selected endpoint. The dashboard shows the number of failed requests for each 4xx, 5xx, and connection error type alongside a timeline of user sessions where errors occurred. You can drill down into these sessions to view context about the user’s hardware and software configuration as well as other relevant events that affected the device state at the time of the failed network calls. This can help you spot application-level hardware issues (such as WiFi/cellular network switching, network hardware failures, or spotty cell reception) and runtime code errors that may be causing network requests to fail.
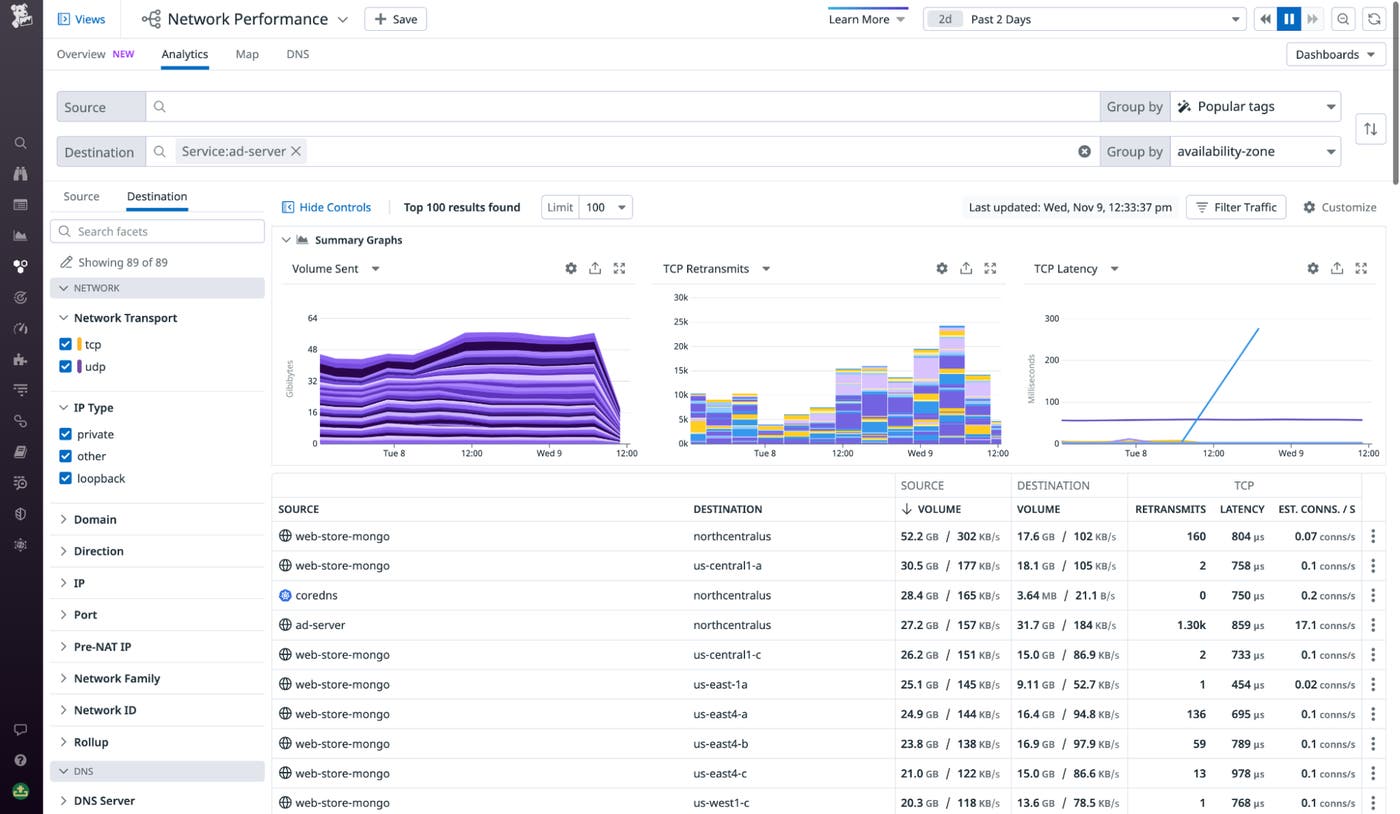
Of course, it’s equally possible that the network traffic errors are occurring due to a backend misconfiguration. By using the Embrace app with Datadog NPM, you can gather network telemetry from your backend services in the same unified UI you’ve used to investigate application issues. NPM automatically discovers your services, maps their interrelationships, and collects metrics from their network communication—including request volume, throughput, round-trip time, and retransmits. Using NPM, you can spot issues in the network communication among your backend services, and pivot directly to related logs and traces to spot the underlying misconfigurations and code errors.
Full-stack mobile app observability
By using Embrace with Datadog, mobile engineers, site reliability engineers, platform engineers, and other DevOps staff can easily get full-stack observability into the health and performance of their mobile apps—tracking crashes, networking issues, and more from Datadog’s unified slate of visualizations and monitoring tools. The Embrace Datadog Marketplace offering is now available for all Datadog and Embrace customers. You can install the app via the integration tile and sign up for an Embrace software license from the Marketplace page. For more information about Embrace, visit the Embrace website.
The ability to promote branded monitoring tools in the Datadog Marketplace is one of the benefits of membership in the Datadog Partner Network. You can learn more about the Datadog Marketplace in our blog post, and you can contact us at marketplace@datadog.com if you’re interested in developing an integration or application. And if you’re brand new to Datadog, get started with a free trial.
