Jordan Obey
AWS Lambda decouples the need to provision and maintain a runtime environment from running code, allowing developers to focus on applications rather than infrastructure. But, by abstracting away the underlying infrastructure of an application, serverless architectures introduce new challenges into monitoring and observability. Datadog addressed that problem with our AWS Lambda integration, which gives developers deep insight into their serverless functions by tracking key metrics like execution times, number of invocations, and errors.
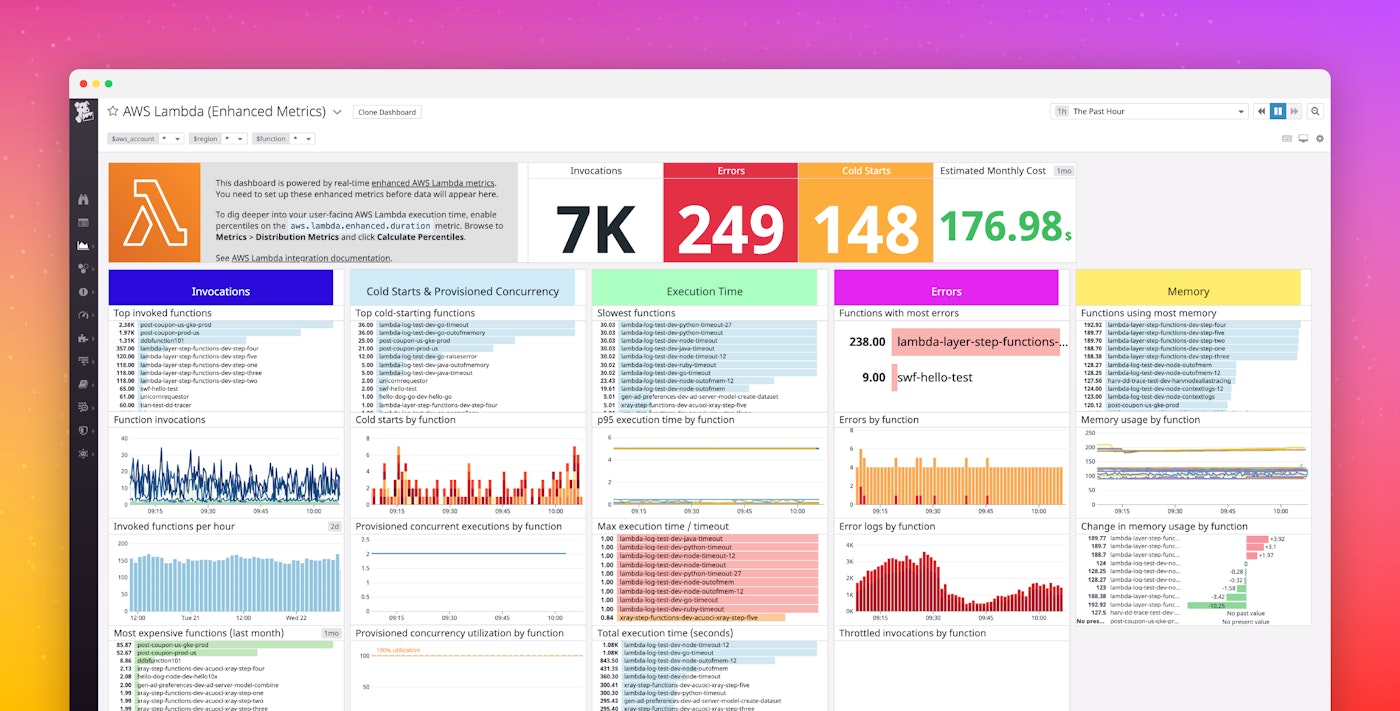
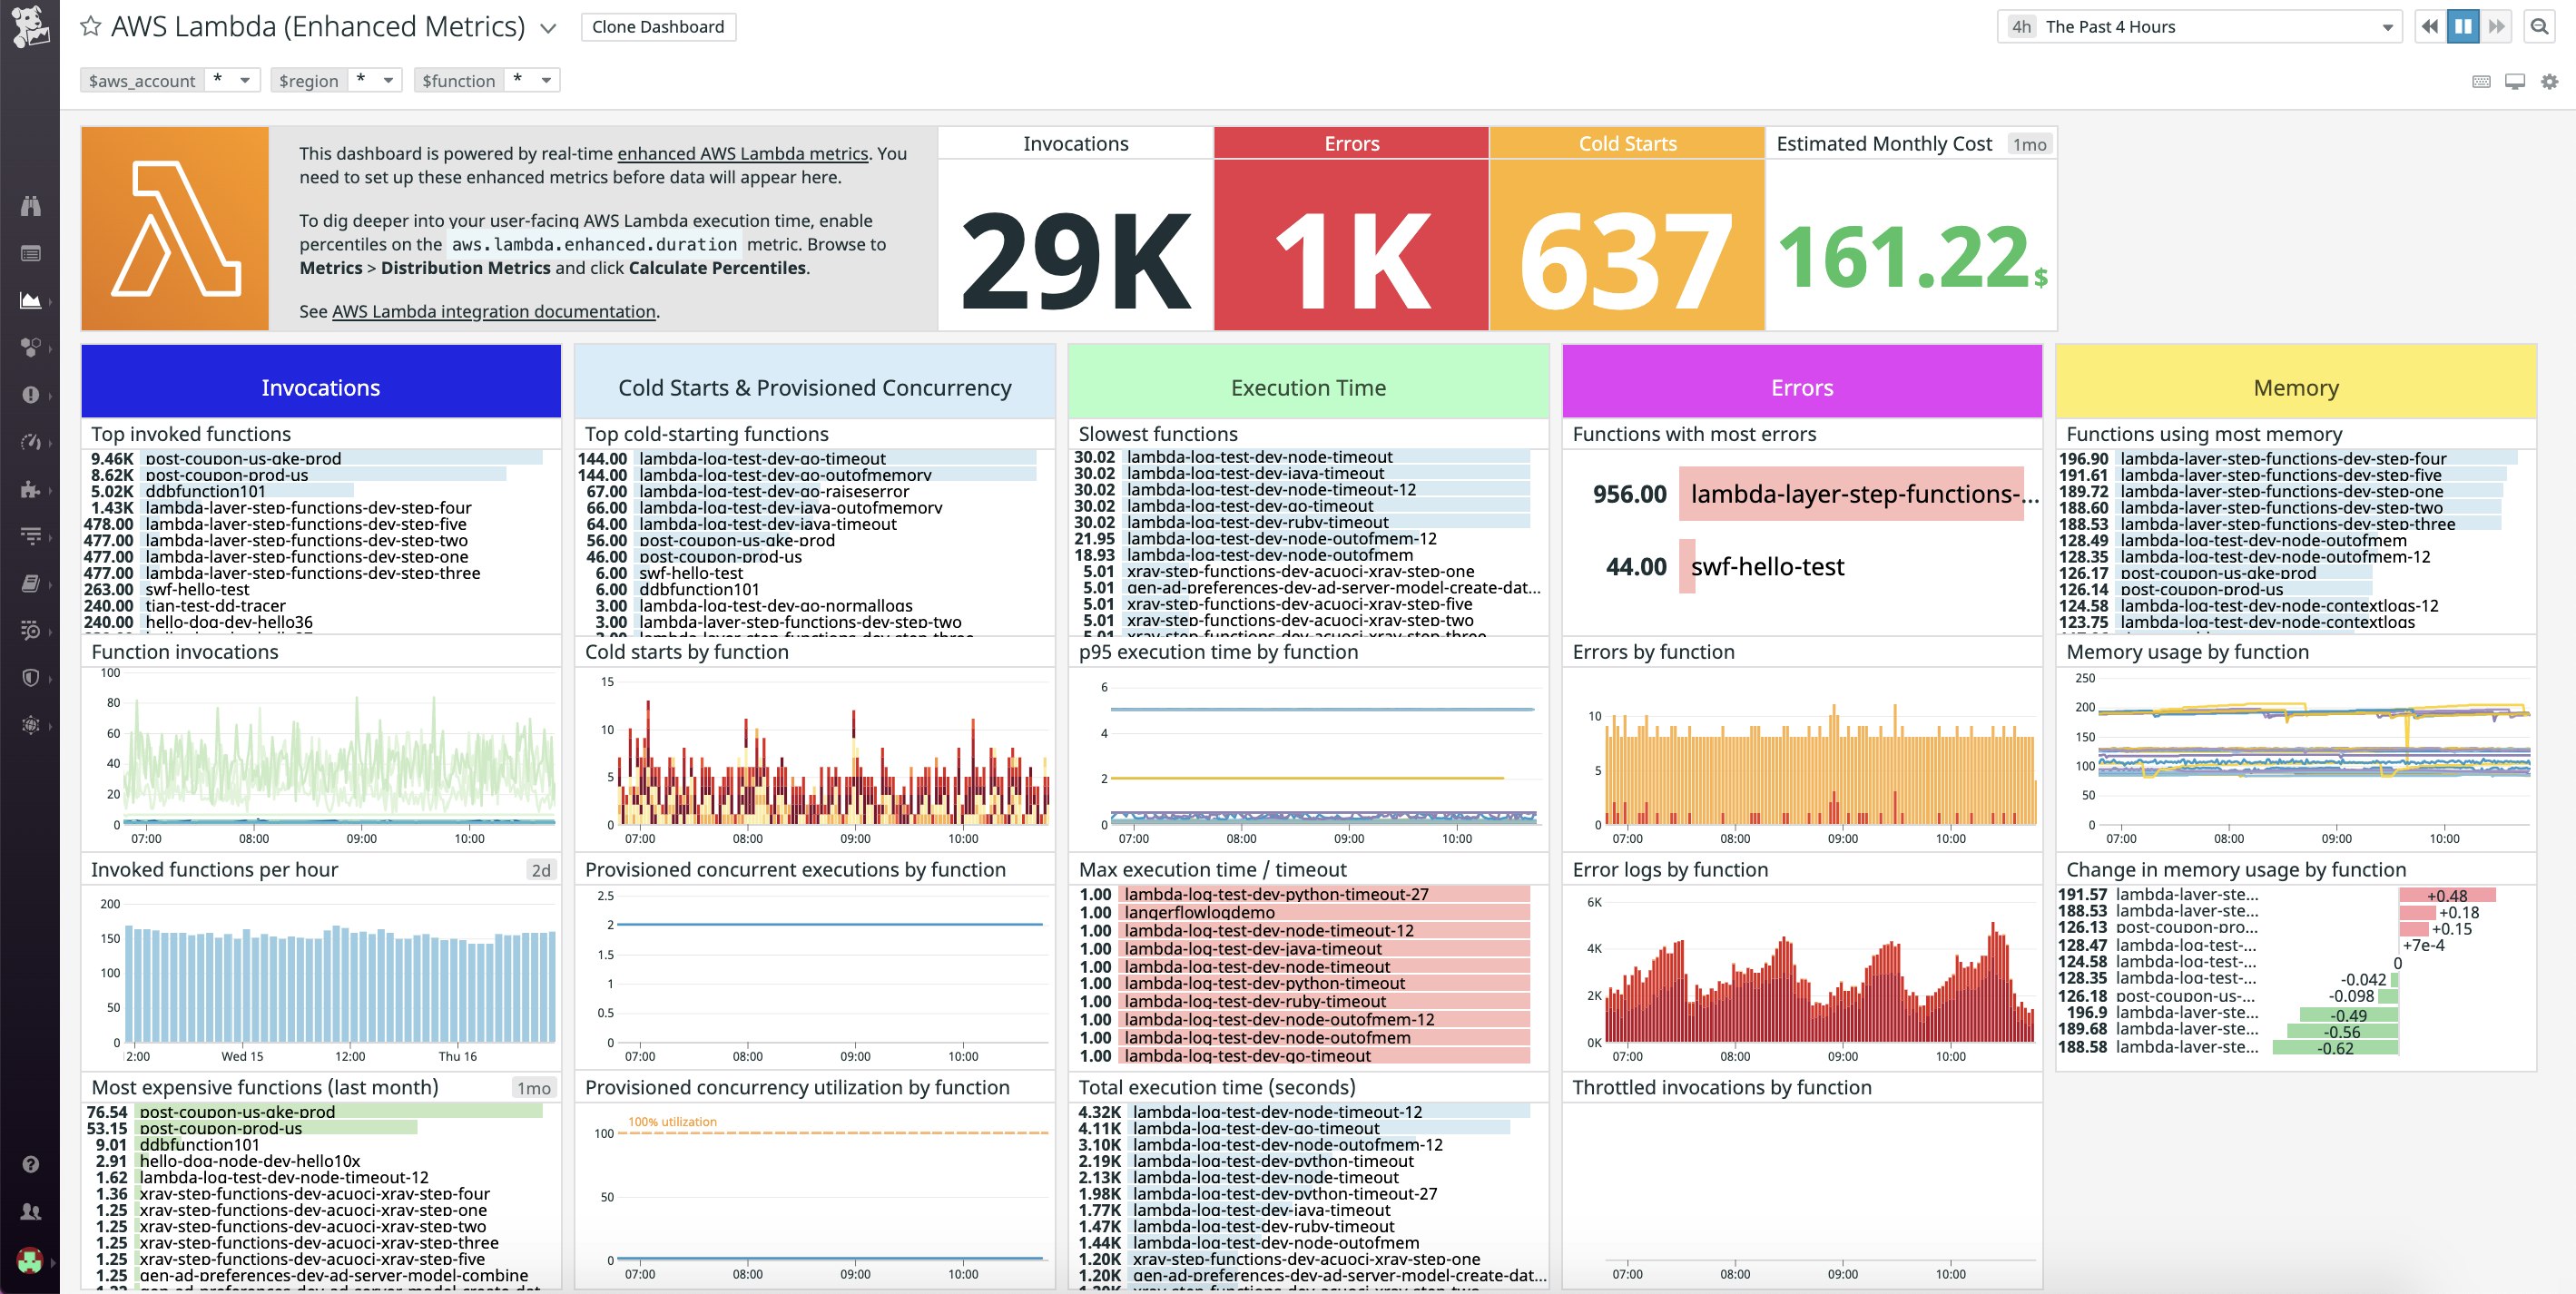
Now, we’ve expanded our AWS Lambda integration to provide customers with even further visibility into their functions with additional enhanced metrics and metadata collected in real time and with higher granularity than standard CloudWatch metrics. Once enabled, our enhanced AWS Lambda integration populates an out-of-the-box dashboard, pictured below. With Datadog, you can visualize and alert on cold starts, estimated AWS costs, and memory usage across all of your Lambda functions.
Alert on errors in real time
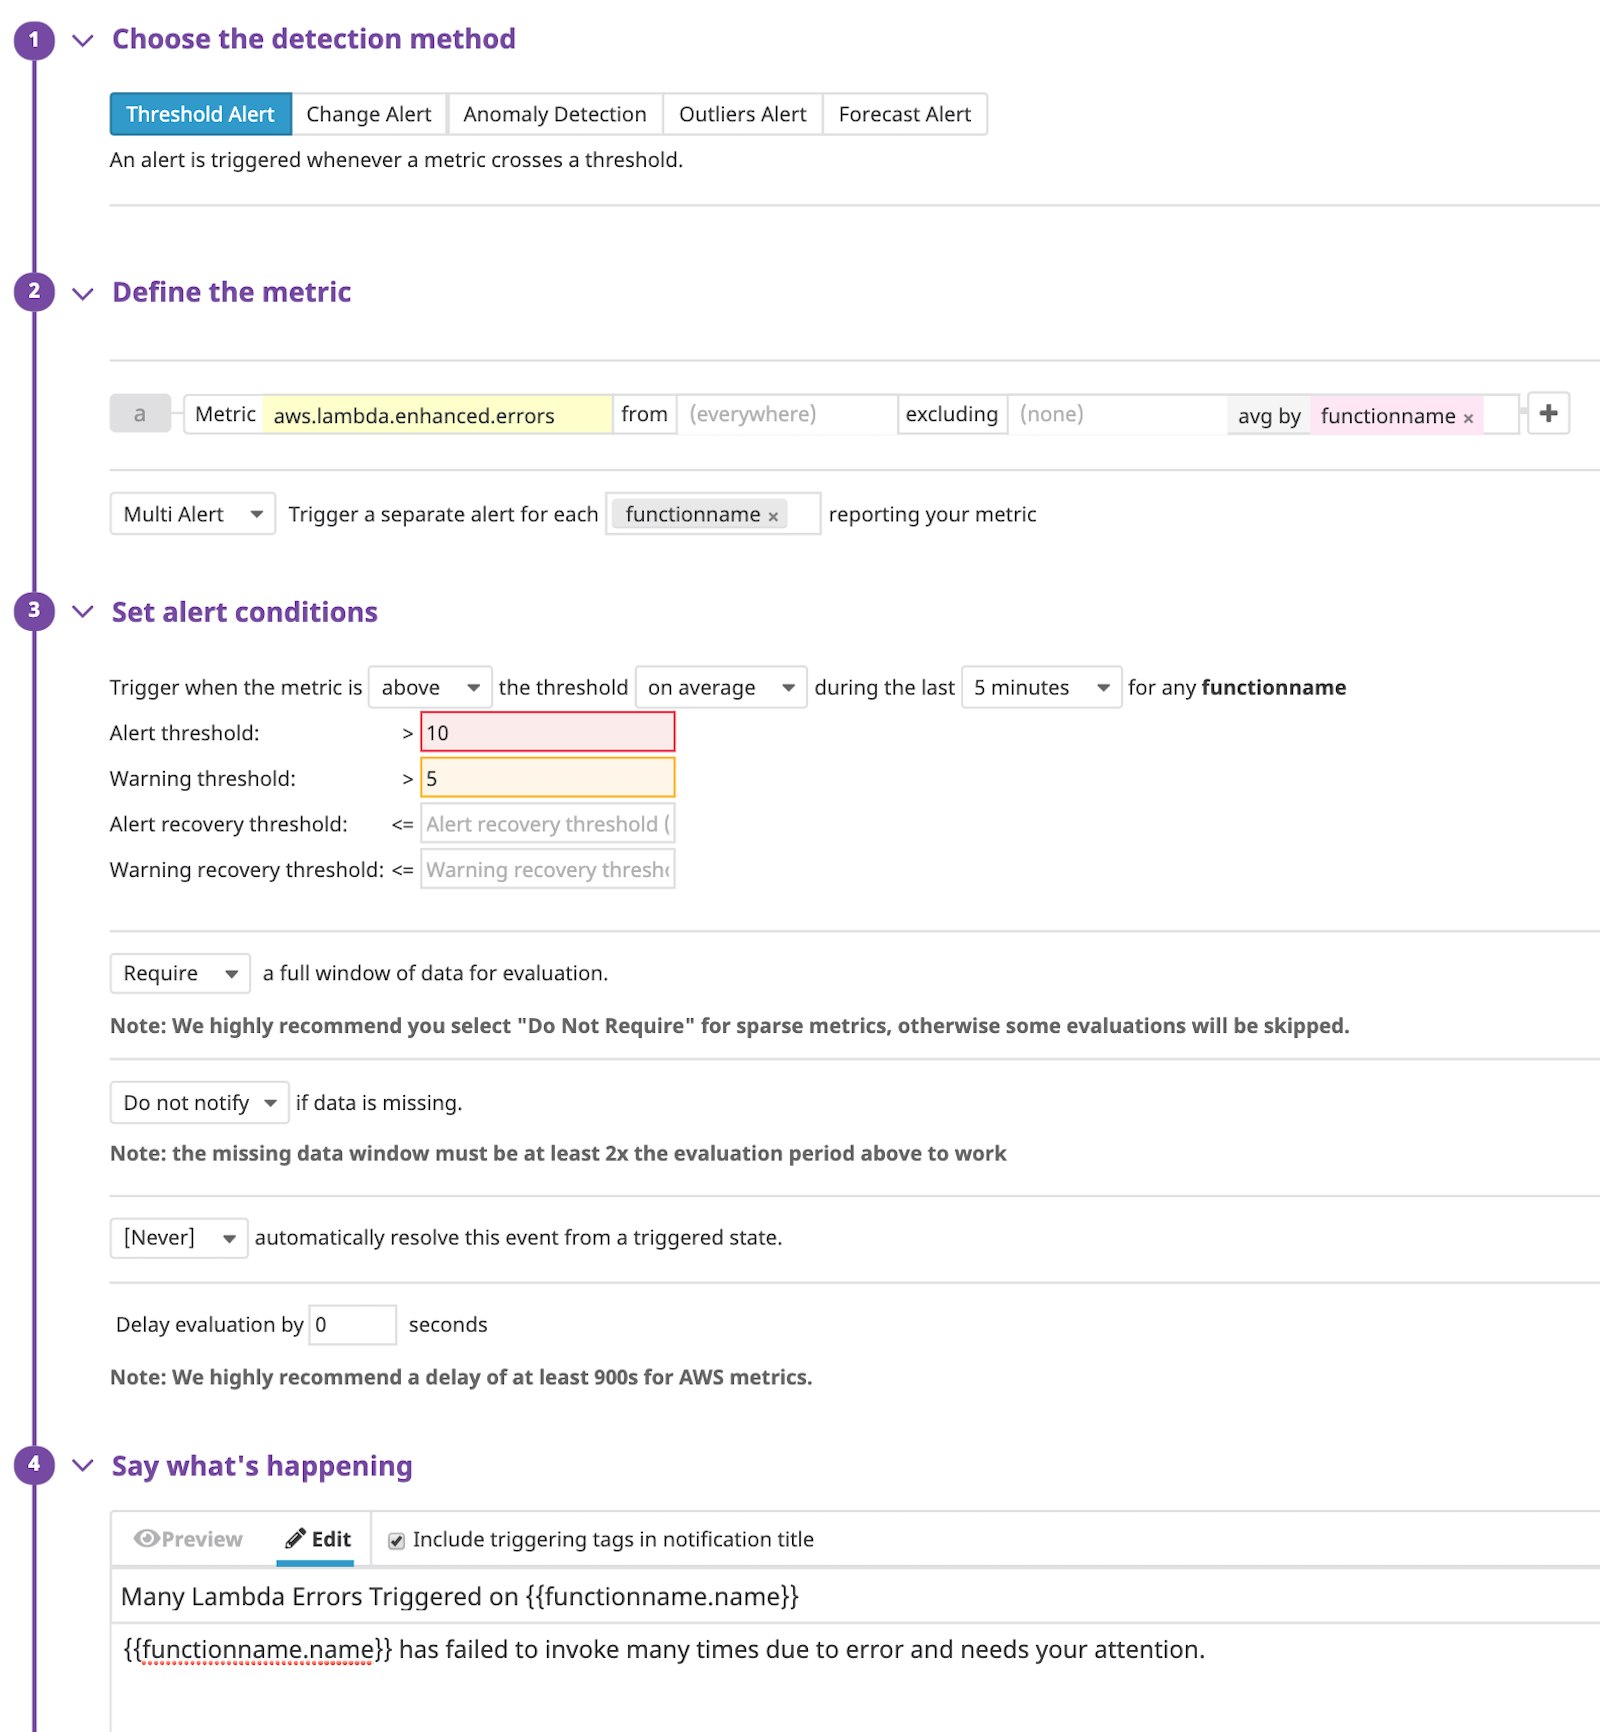
Our enhanced Lambda metrics, which appear in Datadog with the prefix aws.lambda.enhanced, are available at down-to-the-second granularity and in near real time. This enables you to view performance issues in your serverless environments right as they occur and troubleshoot without delay. For example, you can set up a multi-alert monitor on the aws.lambda.enhanced.errors metric. Using the functionname tag ensures that you only need to set up a single monitor to automatically notify you as soon as Lambda errors pass a set threshold on any one of your serverless functions.
Avoid the chill of cold starts
If you’ve worked with serverless functions, you have likely encountered cold starts. Cold starts refer to the latency increase that occurs when invoking a serverless function after it has been idle for a significant length of time. Because cold starts can add several seconds of latency to code execution, they are a challenging pain point that, if not monitored closely, may affect application performance and degrade end-user experience.
Datadog already tags your aws.lambda.invocations metrics with the functionname, and region, letting you track which of your functions saw the most use in which regions. Our enhanced integration now automatically tags function invocations that result in cold starts. Using this cold_start tag along with other function metadata enables you to keep track of the frequency of cold starts, the functions that trigger them, and the regions where they occur most often.
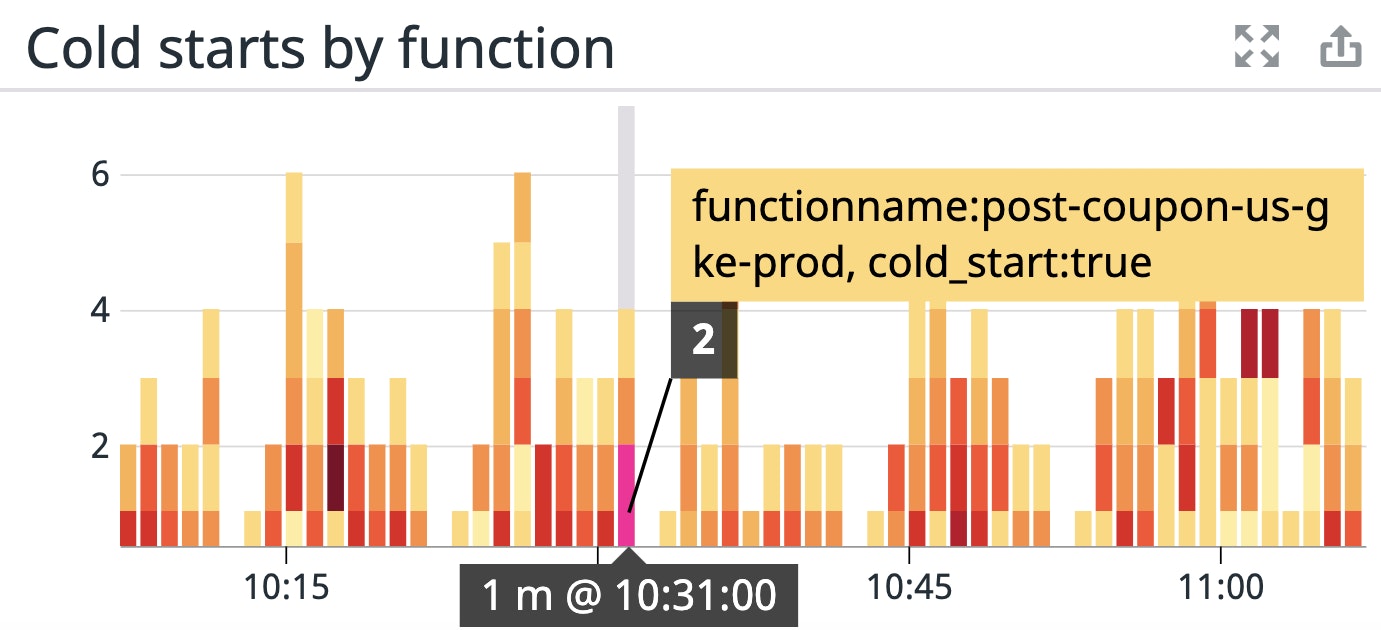
Once you’ve identified functions experiencing cold starts, you can start troubleshooting. For example, some common measures taken to avoid cold starts include enabling provisioned concurrency, allocating more memory to your functions so they can initialize faster, or creating scheduled events that trigger functions at specified intervals to keep them “warm.”
Keep track of costs
One of the appeals of serverless architectures is the ability to pay for what you use based on each function’s invocation count and duration, instead of paying for provisioned resources (e.g., memory, storage, CPU) around the clock. To help optimize cost efficiency and provide you with visibility into how your serverless functions and applications affect spending, we’ve added several metrics to our AWS Lambda integration, including billed function duration (aws.lambda.enhanced.billed_duration) and estimated cost (aws.lambda.enhanced.estimated_cost).
A function’s billed duration tells you how long it takes a function to execute per every hundred milliseconds. This reflects how AWS Lambda calculates and bills for function duration. Together with tags, tracking billed duration can help optimize costs as you develop your serverless architectures. For example, monitor the estimated cost of your functions using the functionname tag to surface the most expensive ones. Then, view those functions’ billed duration to identify which ones take the longest to execute and drive up costs as a result. You can also create a custom team tag to monitor estimated costs across teams to identify the parts of your organization with expensive invocations. Once you’ve identified teams with costly functions, you’ll know where to start refactoring to improve efficiency and reduce costs.
Dive deep into memory usage
As you fine-tune your serverless applications for performance and cost efficiency, it’s important that you keep track of your functions’ memory usage. AWS limits how much memory you can allocate to individual functions (128 to 3,008 MB). If a function exceeds that limit, Lambda will stop its execution. To help ensure your Lambda functions continue to perform as expected, Datadog collects the amount of memory (in MBs) that your functions use during execution. Monitoring memory usage can help you determine if a function is close to exceeding Lambda’s memory limitation.
Tracking function memory usage can also help you reduce spending. While AWS bills each function based on its duration of execution, the base rate for running the function is determined by the amount of memory you’ve allocated to it (e.g., a function with 128 MB allocated to it will cost less per 100 ms than one that’s been allocated 512 MB). Both over- and under-allocating memory to your functions can be costly, so monitoring their actual memory usage, and comparing that to what you have allocated to them, is critical. To spot functions with potential memory allocation inefficiencies, you can visualize memory usage with top lists, illustrating functions with the greatest and least amount of memory usage.

Get greater visibility into your AWS Lambda functions
With Datadog’s enhanced Lambda metrics, you can get further real-time visibility into the performance, resource usage, and cost efficiency of your AWS Lambda functions so you can spot issues as soon as they arise. Our enhanced Lambda metrics and metadata are currently available for Ruby, Node.js, and Python runtimes. To enable enhanced metrics, follow these set-up instructions.
Datadog provides you with deep visibility into your AWS Lambda functions and, with our 1,000+ integrations, anything else you’re running in your environment. If you’d like to start using Datadog, you can sign up today for a 14-day free trial.
