Andrew Southard
Whether you're investigating memory leaks or debugging errors, Java Virtual Machine (JVM) runtime metrics provide detailed context for troubleshooting application performance issues. For example, if you see a spike in application latency, correlating request traces with Java runtime metrics can help you determine if the bottleneck is the JVM (e.g., inefficient garbage collection) or a code-level issue. JVM runtime metrics are integrated into Datadog APM so you can get critical visibility across your Java stack in one platform—from code-level performance to the health of the JVM—and use that data to monitor and optimize your applications.

Troubleshoot performance issues with Java runtime metrics and traces
As Datadog's Java APM client traces the flow of requests across your distributed system, it also collects runtime metrics locally from each JVM so you can get unified insights into your applications and their underlying infrastructure. Runtime metrics provide rich context around all the metrics, traces, and logs you're collecting with Datadog, and help you determine how infrastructure health affects application performance.
Datadog APM's detailed service-level overviews display key performance indicators—request throughput, latency, and errors—that you can correlate with JVM runtime metrics. In the screenshot below, you can see Java runtime metrics collected from the coffee-house service, including JVM heap memory usage and garbage collection statistics, which provide more context around performance issues and potential bottlenecks.

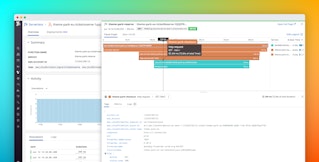
As Datadog traces requests across your Java applications, it breaks down the requests into spans, or individual units of work (e.g., an API call or a SQL query). If you click on a span within a flame graph, you can navigate to the "JVM Metrics" tab to see your Java runtime metrics, with the time of the trace overlaid on each graph for easy correlation. Other elements of the trace view provide additional context around your traces—including unique span metadata and automatically correlated logs that are associated with that same request.
By correlating JVM metrics with spans, you can determine if any resource constraints or excess load in your runtime environment impacted application performance (e.g., inefficient garbage collection contributed to a spike in service latency). With all this information available in one place, you can investigate whether a particular error was related to an issue with your JVM or your application, and respond accordingly—whether that means refactoring your code, revising your JVM heap configuration, or provisioning more resources for your application servers.
You can also view JVM metrics in more detail (and track their historical trends) by clicking on "View integration dashboard," which will bring you to an out-of-the-box dashboard specifically for the JVM.
Explore your JVM metrics in context
Datadog's new integration dashboard provides real-time visibility into the health and activity of your JVM runtime environment, including garbage collection, heap and non-heap memory usage, and thread count. You can use the template variable selectors to filter for runtime metrics collected from a specific host, environment, service, or any combination thereof.

If you'd like to get more context around a particular change in a JVM metric, you can click on that graph to navigate to logs collected from that subset of your Java environment, to get deeper insights into the JVM environments that are running your applications.
Monitor JVM runtime + the rest of your Java stack
As of version 0.29.0, Datadog's Java client will automatically collect JVM runtime metrics so you can get deeper context around your Java traces and application performance data. This release also includes Datadog's JMXFetch integration, which enables JMX metric collection locally in the JVM—without opening a JMX remote connection. These JMX metrics can include any MBeans that are generated, such as metrics from Kafka, Tomcat, or ActiveMQ; see the documentation to learn more.
In containerized environments, make sure that you've configured the Datadog Agent to receive data over port 8125, as outlined in the documentation. Runtime metric collection is also available for other languages like Python and Ruby; see the documentation for details.
If you're new to Datadog and you'd like to get unified insights into your Java applications and JVM runtime metrics in one platform, sign up for a free trial.


