Renaud Boutet

Brad Menezes
When your users are encountering errors or high latency in your application, drilling down to view the logs from a problematic request can reveal exactly what went wrong. By pulling together all the logs pertaining to a given request, you can see in rich detail how it was handled from beginning to end so you can quickly diagnose the issue.
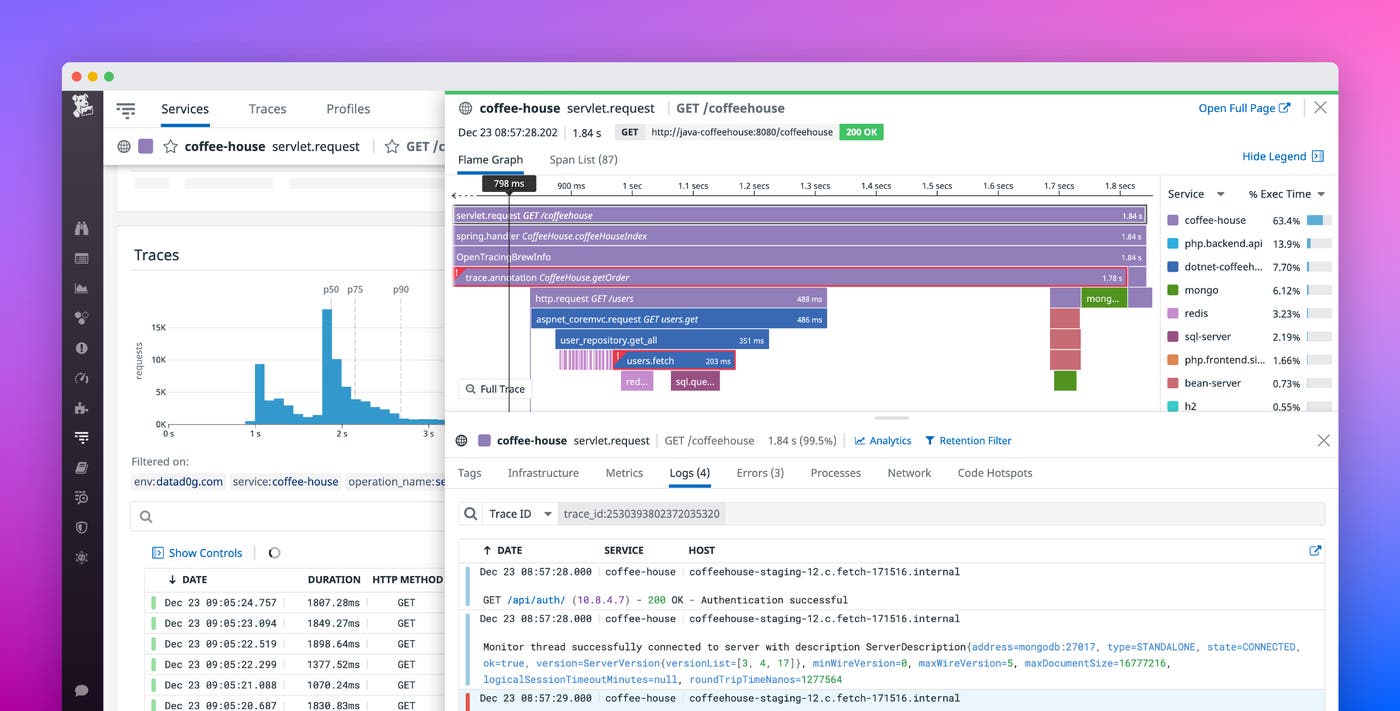
Datadog automatically brings together all the logs for a given request and links them seamlessly to tracing data from that same request. With auto-instrumentation for Java, Python, Ruby, Go, Node.js, .NET, PHP, and many associated frameworks, you can start correlating logs and request traces without touching your application code.
The challenge: Unifying all telemetry data for a single request
To see all your telemetry for a request in one place, you need to link together logs from disparate functions, processes, hosts, containers, and cloud services. Tying together all that data traditionally has required a complex, manual process:
assigning a unique identifier to each request
making sure that contextual identifier accompanies the request as it traverses a distributed environment
manually instrumenting every service in the request pathway to ensure that the identifier is recorded in each log line generated while serving a request
Even for companies that have added this custom glue code to tie their request logs together, the instrumentation requires a significant amount of developer time to implement. Maintaining and expanding that instrumentation is an ever-evolving challenge, as new services are built and teams adopt new languages, frameworks, and libraries. As a result, teams usually have visibility into only a subset of logs for any particular request.
The solution: Automatic context propagation
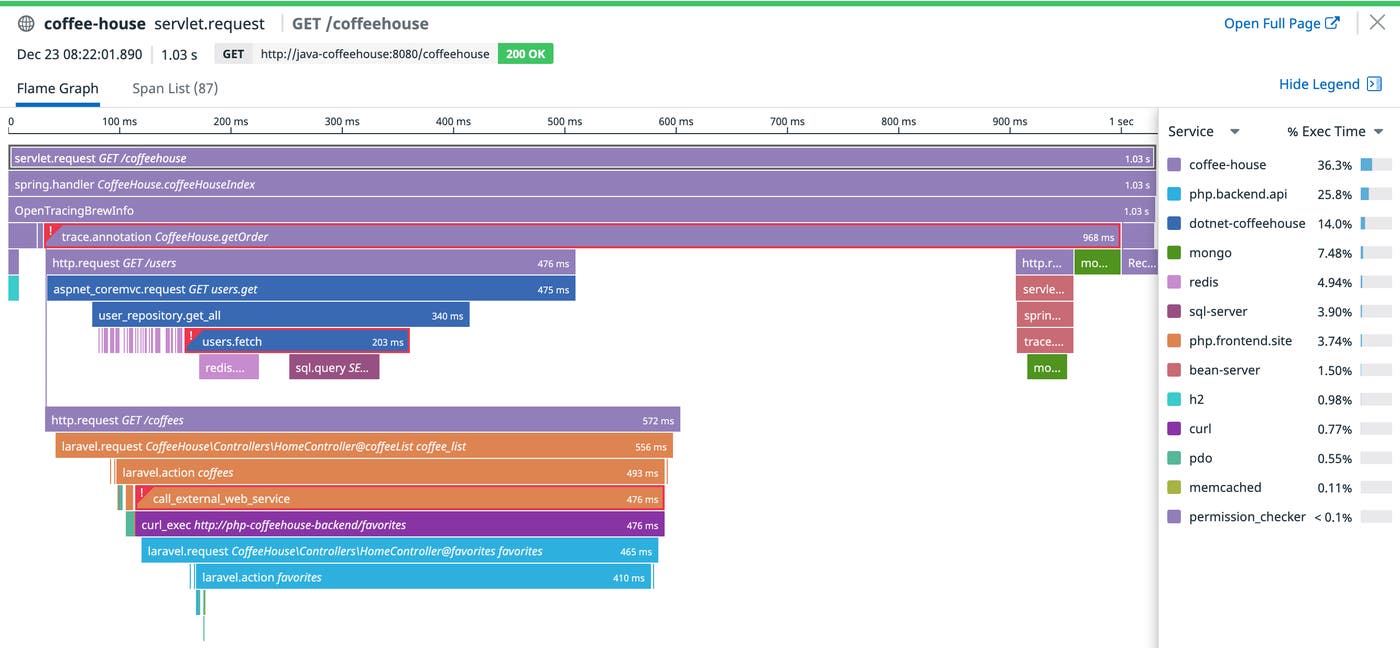
Datadog's distributed tracing libraries were built to solve this exact problem: propagating the context of a request across services and infrastructure boundaries. Datadog APM & distributed tracing follows the path of requests across complex, distributed systems to reconstruct the full lifespan of a request in a single visualization, known as a trace. Each trace comprises one or more spans, each one representing the latency of a single unit of work (e.g., a function call or a SQL query) within the transaction.

By enhancing those tracing libraries to inject that same request-scoped context into logs, Datadog automatically unifies all the logs and the trace for a given request. This feature harnesses the auto-instrumentation capability of Datadog's tracing libraries, which means correlating request logs with traces requires zero developer time, zero maintenance, and zero headaches for your engineering team, even in a constantly evolving environment.
View the logs associated with a request trace
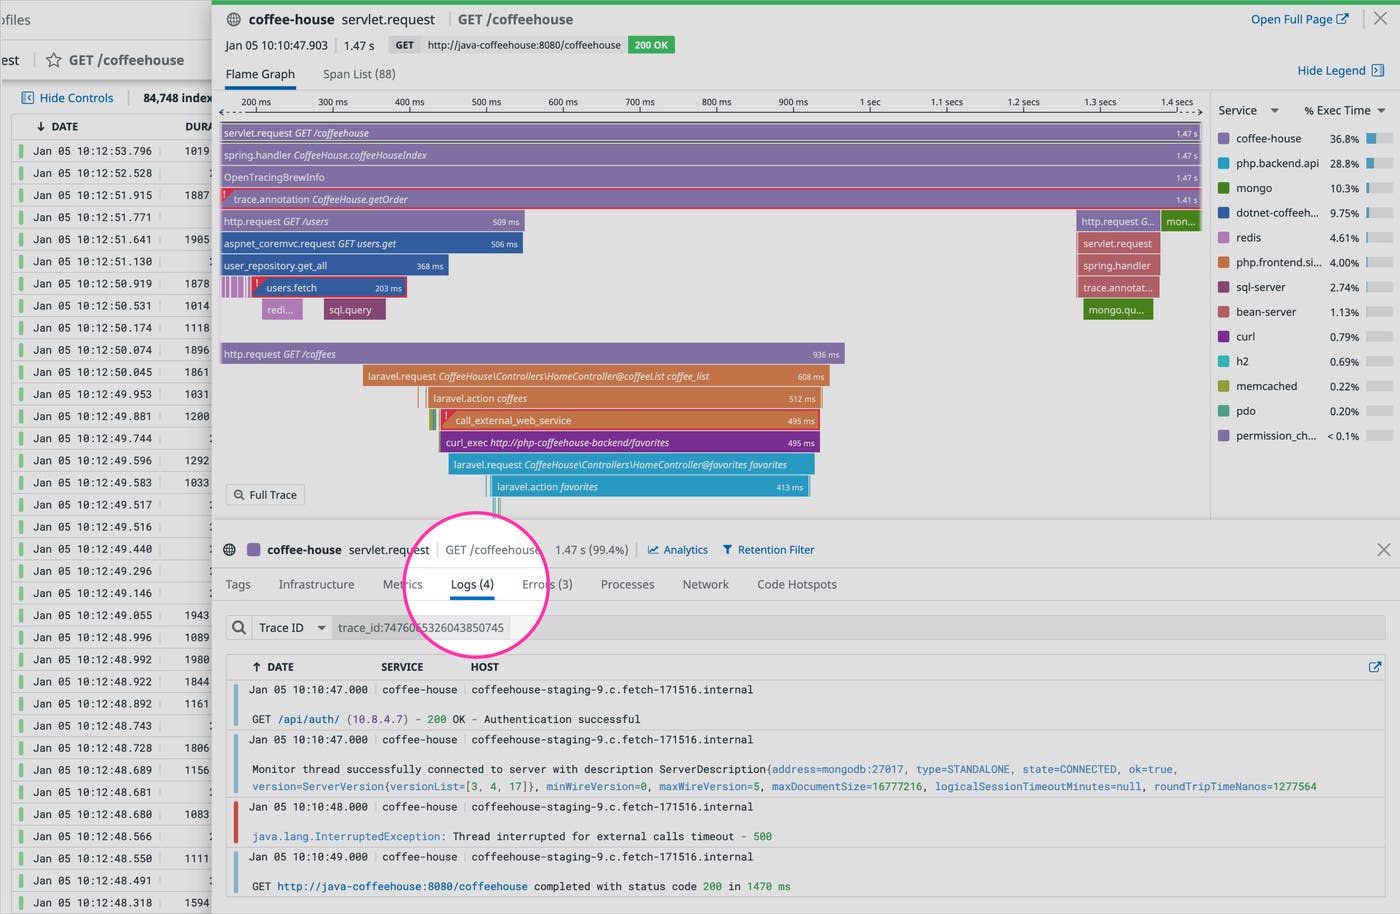
Once you've configured your tracing library to auto-correlate your traces and logs, you can click on any distributed request trace to view the logs inline. Pivoting seamlessly from traces to logs allows you to instantly gather the context you need to troubleshoot faster. For example, from a trace recording the end-to-end execution of a request that returned a server error, you can dive directly into the logs for all of the services that processed that request to see the low-level details of the error, bringing all your telemetry into one view.

Pivot from logs to traces in one click
From any single log, you can click to see the trace of the request or transaction that was being executed when that log was generated. Viewing the trace allows you to see the full call stack that surrounded the event captured in the log, and also provides application performance data so you can see if the exception ultimately caused a user-facing error or excessive latency in the handling of the request.
Isolate all the logs from a single request
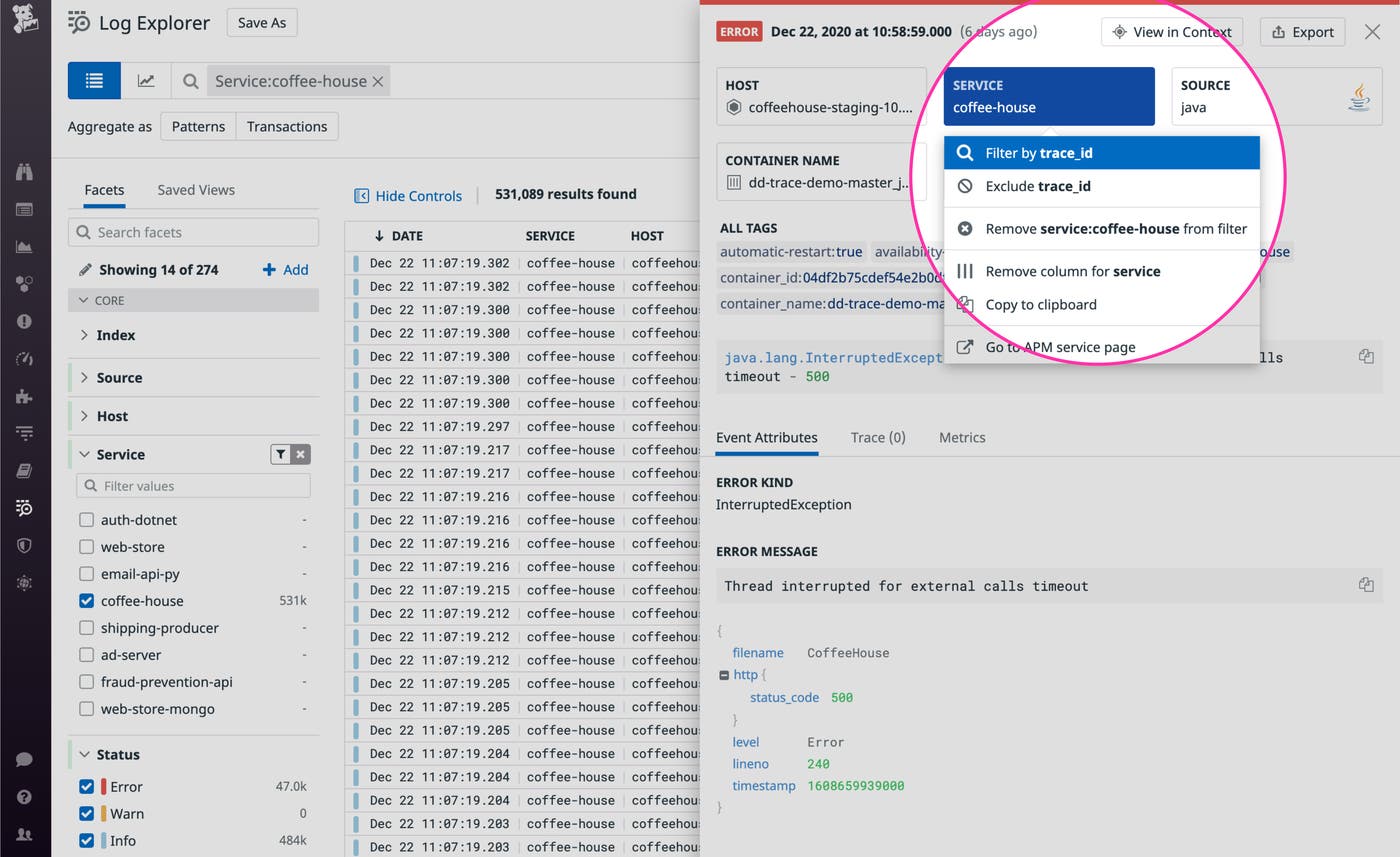
Even in a distributed, multi-service environment, where logs are generated independently by a multitude of services, the tracing library propagates the request context to every line of your logs. So you can use the Datadog Log Explorer to quickly gather all the logs generated by a given transaction. From any single log line, you can click to zoom out and explore all the logs that originated from the same request, enabling you to reconstruct the details of the transaction from beginning to end.

By instantly gathering all the logs from a given request or operation, you can sort them chronologically to uncover the source of a cascading failure, or dive into the application logs to find the exact parameters of a user request that generated an exception.
Flip the switch
In most cases, enabling auto-correlation of your logs and request traces is as simple as making a single configuration change to the tracer for your language of choice. For example, you can start correlating logs with traces in a Python application simply by setting the environment variable DD_LOGS_INJECTION=true when you run the Python tracer. Visit our docs for language-specific instructions for your tracing library.
If you aren't yet using Datadog to monitor your logs, distributed request traces, metrics, and synthetic tests in one place, you can sign up for a free 14-day trial here.

