Rudy Bunel
Splunk is a tool that lets you search, analyze, and create custom reports on your log data to help identify abnormal behavior in your infrastructure. With the new Datadog and Splunk integration, you can view the log alerts and reports that Splunk creates in the context of the infrastructure metrics and events that Datadog captures. Using Datadog and Splunk together, further increases your visibility into your infrastructure and helps identify the root cause of problems faster and with greater accuracy.
In this blog we’ll discuss how Datadog’s Splunk integration puts the microscope on application monitoring by facilitating team collaboration over Splunk events and providing visualization of Splunk events in the context of your infrastructure’s performance metrics.
Collaborate with your team about Splunk events
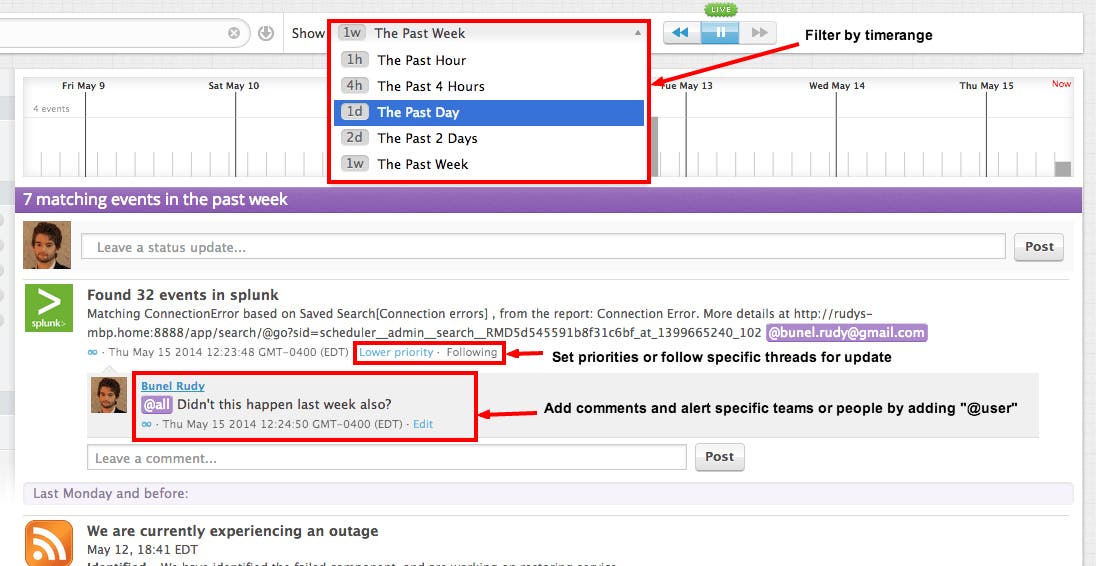
Splunk gives you the ability to create a custom log report based on your search criteria. The integration with Datadog allows you to automatically deliver this report to your Datadog Events Stream and to incorporate this data in Datadog dashboards. You can further utilize Datadog’s communication and analysis tools to comment on reports or filter them by specific time frames and priorities.

You can also customize Splunk event notifications and alert specific individuals by adding “@user” to the event message. This feature can be used with other integrated alert tools such as PagerDuty and OpsGenie to streamline your communication.

Correlate Splunk events with infrastructure metrics for more efficient root cause analysis
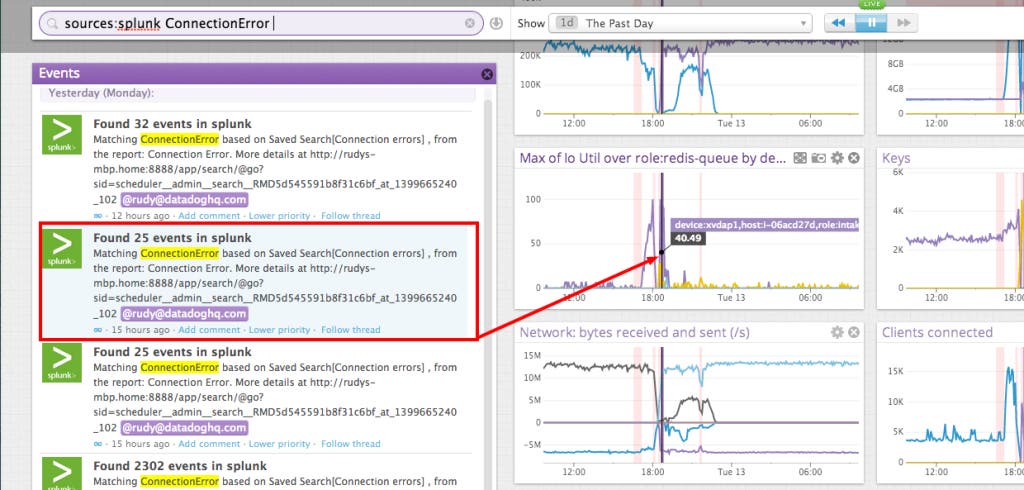
Datadog’s Splunk integration allows events from Splunk reports to be visualized and correlated with metrics drawn from all of Datadog’s integrations. As a result, you can now identify the root cause for performance issues more easily and efficiently.
For example, in the screenshot below we show how we found that I/O and network metrics spikes we were experiencing were due to connection errors that were detailed in our logs.

To collaborate with your team about Splunk events and correlate these events with other infrastructure metrics to more easily identify root cause for performance issues, try Datadog free for 14 days.


