Addie Beach
As user expectations for mobile apps increase, effective bug remediation involves not only addressing critical incidents as they occur but also proactively handling smaller performance issues in order to ensure a smooth user experience (UX). Instabug helps you understand how users experience your app with crucial mobile performance metrics—such as launch metrics, loading times, and UI hangs—viewable alongside your bug reports. Additionally, with granular release metrics, Instabug expedites incident detection and remediation throughout your entire development lifecycle. This enables you to fix the code defects that are causing performance issues before they frustrate users—or even crash your app.
We are pleased to partner with Instabug to offer an out-of-the-box (OOTB) dashboard widget along with a software license in the Datadog Marketplace. In this post, we’ll explore how you can use the OOTB Application Performance Index (Apdex) dashboard widget to assess user satisfaction, as well as leverage built-in bug reports with Datadog Application Performance Management (APM) and Infrastructure Monitoring to instantly correlate degraded performance with recently identified code issues.
Use the Apdex dashboard widget to assess user satisfaction with your mobile apps
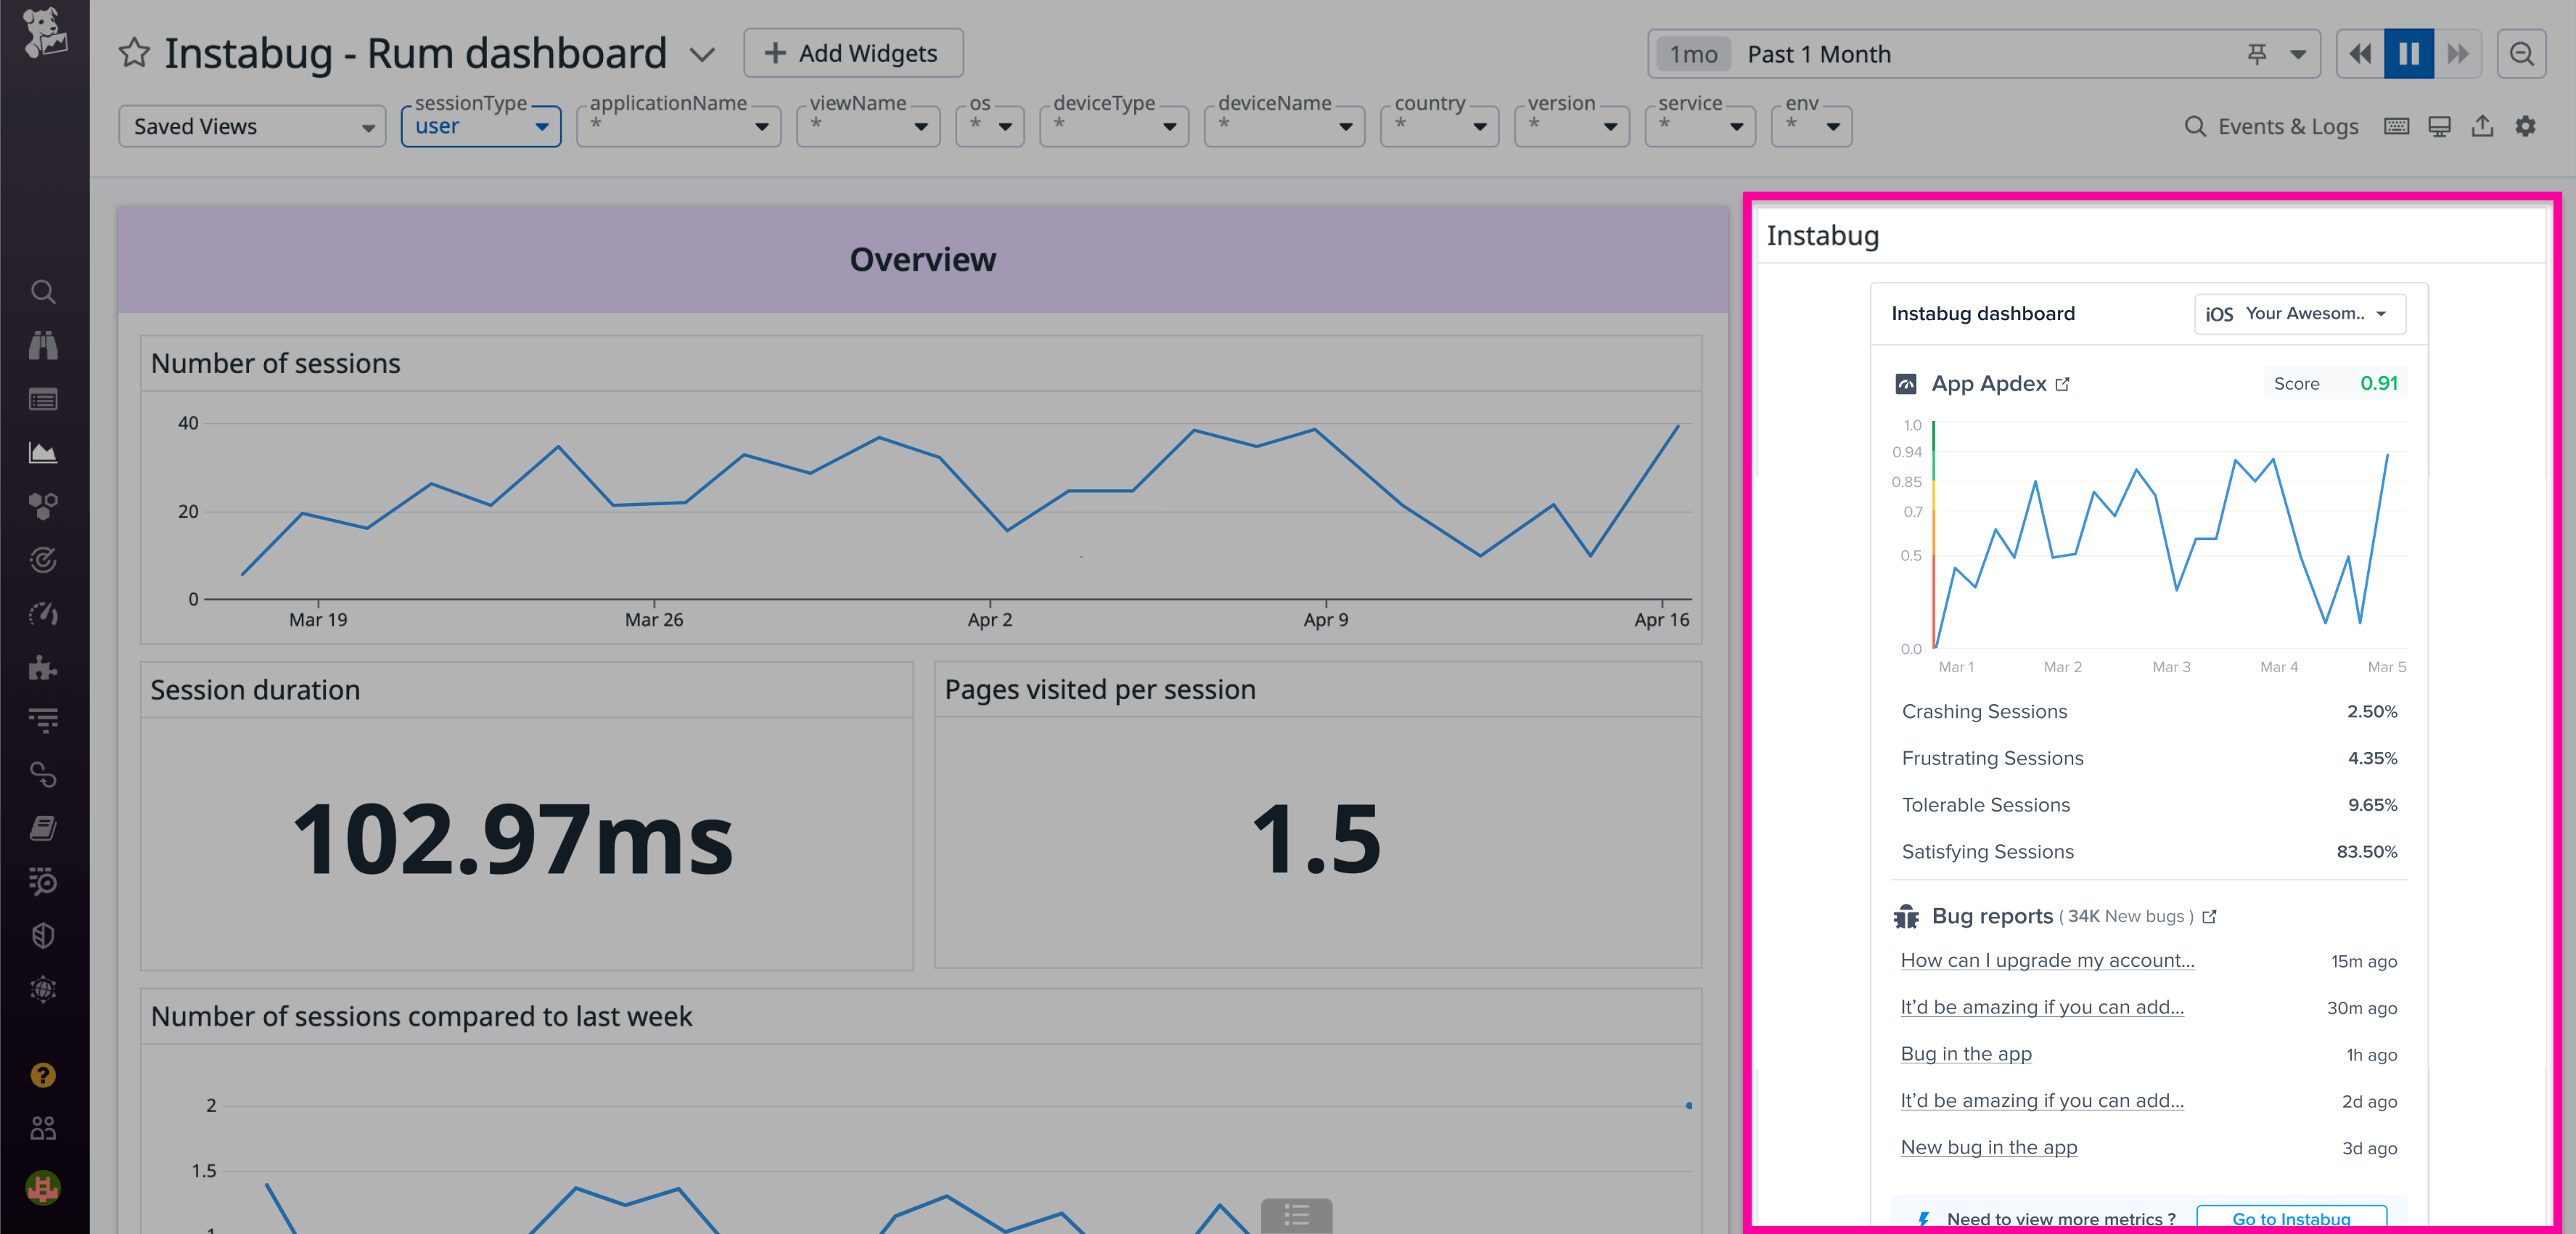
An Apdex score is an industry-wide standard that quantifies mobile usability by using various performance and stability metrics to calculate the perceived quality of your app, returning a figure from 0 to 1 that represents the proportion of satisfactory user sessions. Instabug’s Apdex score comes with default performance thresholds for determining whether a user experience is successful. You can customize these thresholds in Instabug by adding or removing variables such as traces, app hangs, and network calls to tailor the score to your app’s needs.
Within Datadog, the Instabug dashboard widget translates your performance thresholds into four easy-to-parse buckets—Satisfying, Tolerable, Frustrating, and Crashing—to help you interpret what raw Apdex scores mean for your UX. The percentage of user sessions that meet each threshold is presented alongside a color-coded timeseries graph that enables you to visualize changes in your Apdex score over time, so you can quickly spot unusual activity. By adding the widget to your dashboard, you can view this activity next to the other data you’re tracking and easily tie any shifts in performance to specific events such as releases or outages.

This high-level overview of system performance metrics complements your KPI dashboards, making it easy to see how client-side issues may be impacting your entire application. For example, if a widget suddenly reports a spike in Frustrating sessions, you can determine whether this correlates with other important metrics, such as overall app latency and uptime, helping you judge the scope and severity of the issue.
Quickly troubleshoot by using detailed bug reports with Datadog APM and Infrastructure Monitoring
Once you’ve noticed a performance issue, the widget provides tools for in-depth troubleshooting and easily integrates with your investigation workflows in Datadog. Right alongside the Apdex score in the widget, you can access a high-level overview of the five most recent bug reports—including the type of issue and a brief description of what happened—as well as the total number of new Instabug reports. If you need further information from the bug reports, including detailed logs and metadata, you can pivot to Instabug with the click of a button. Otherwise, you can begin conducting root cause analysis directly from within Datadog.
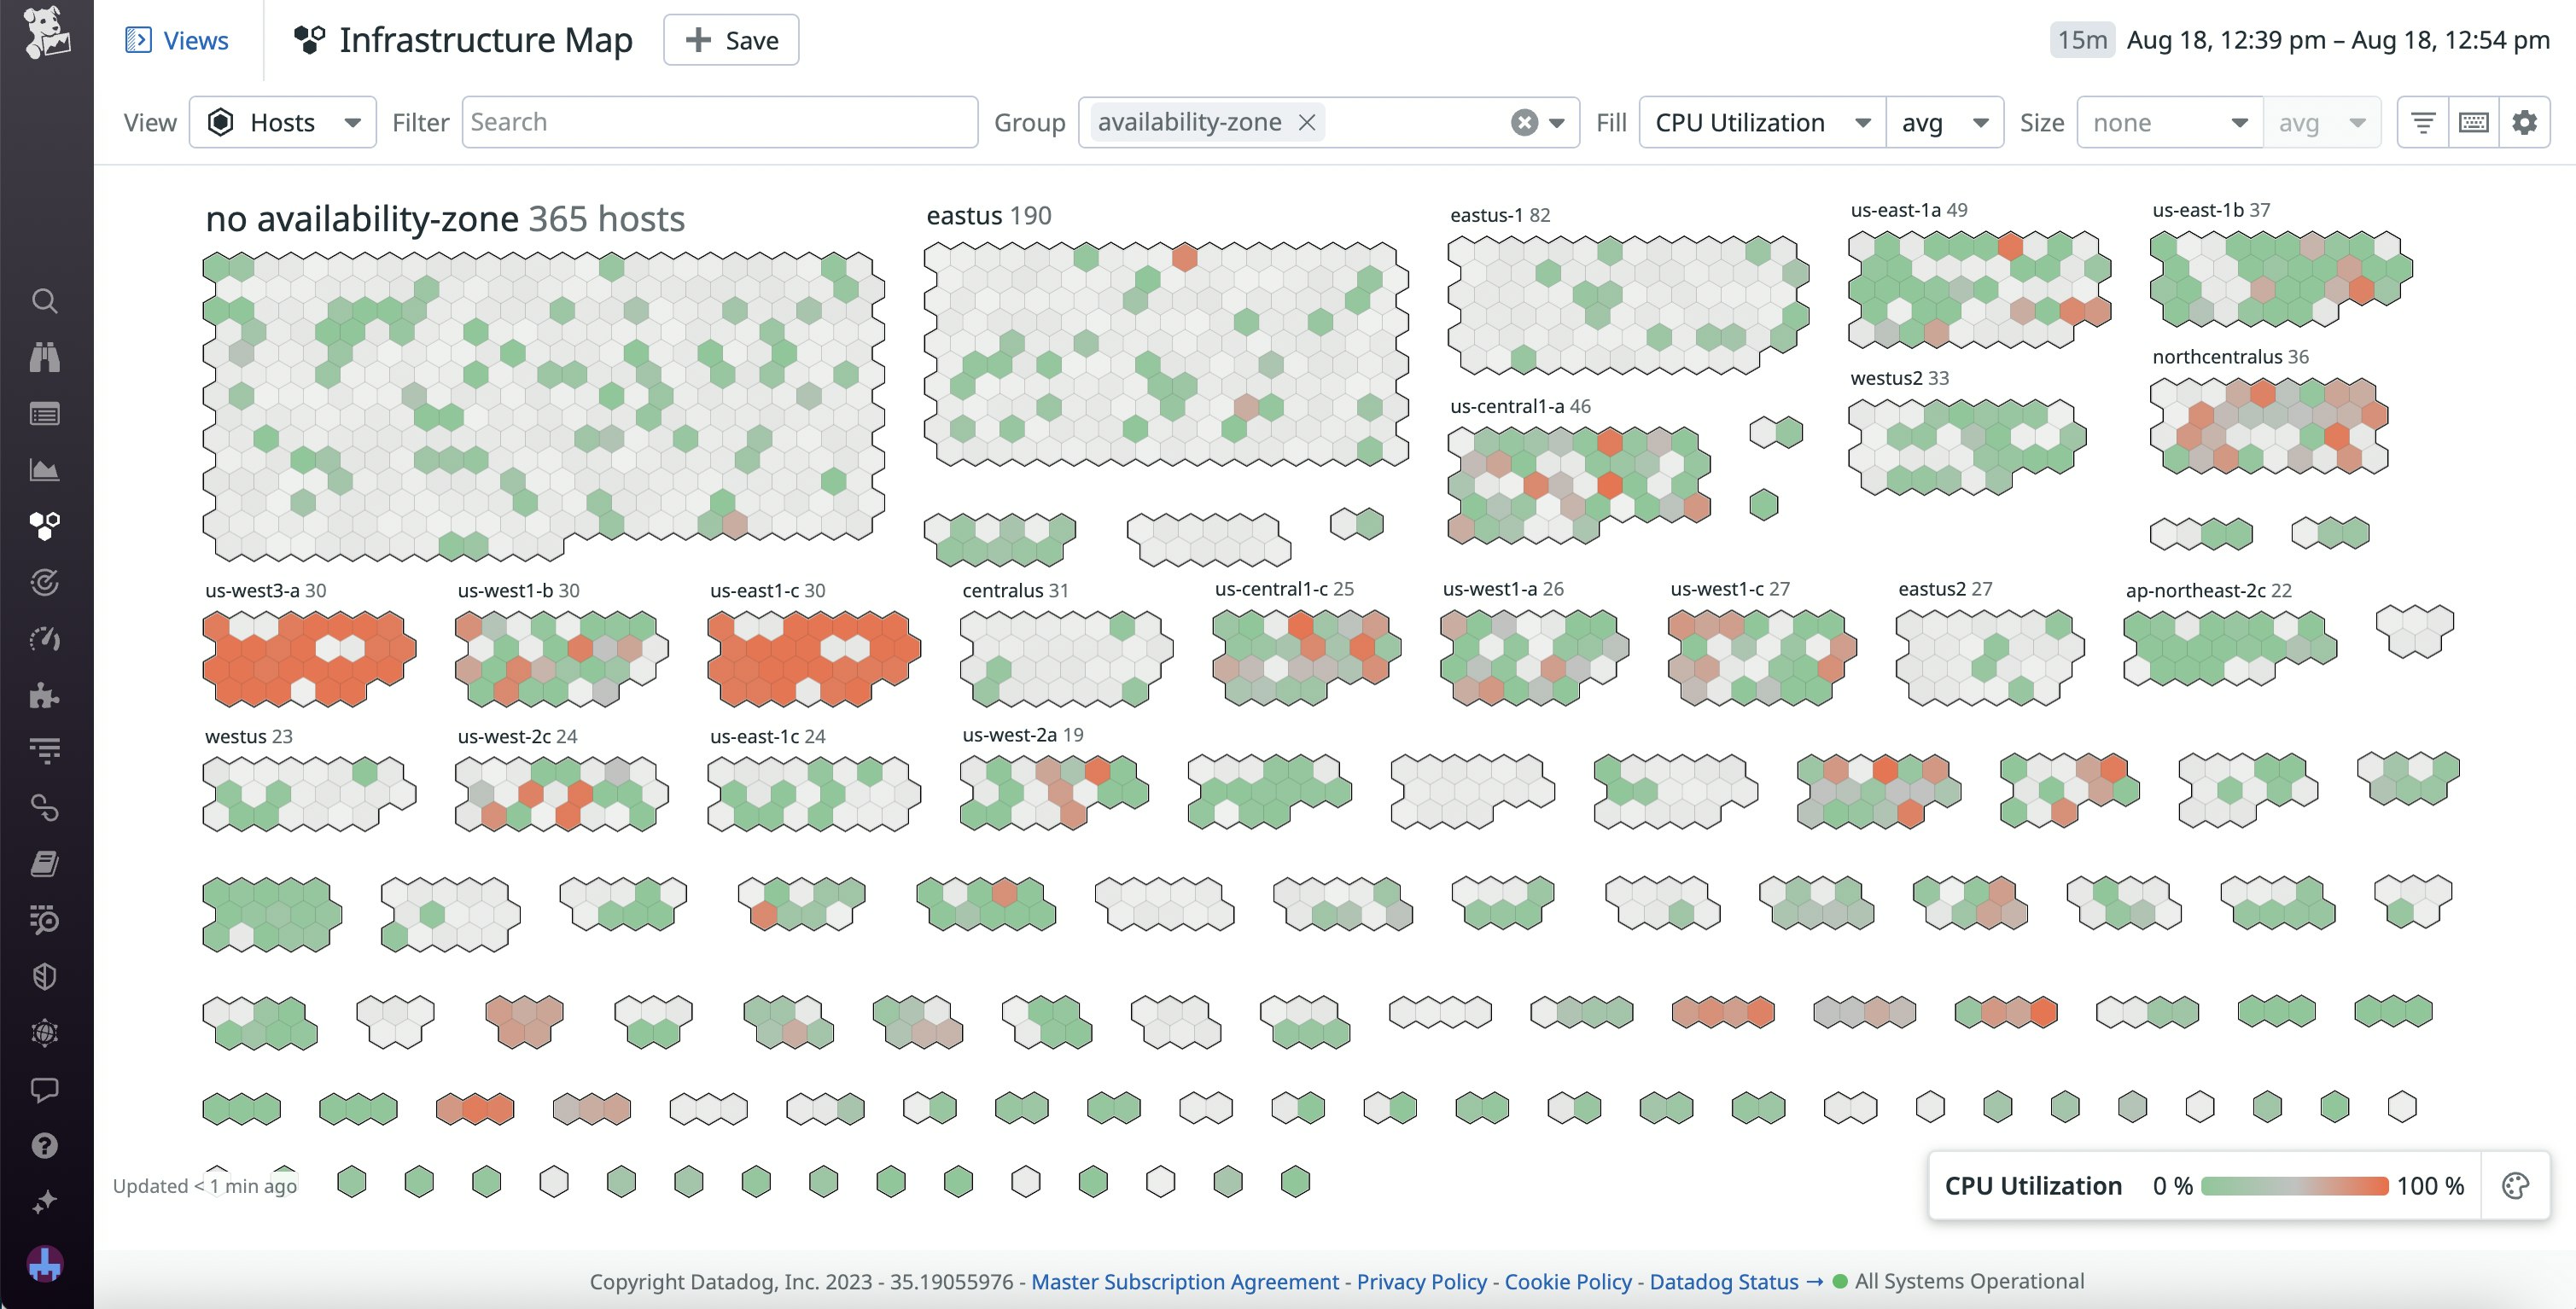
Let’s say you notice that the Apdex score is reflecting a high number of Crashing sessions. By looking at the bug reports in the widget, you quickly determine that the problem began shortly after a recent feature release. To dig deeper into the findings from your Instabug reports, you can jump to Datadog Error Tracking within APM to pinpoint the problematic lines of code and review the relevant tag, trace, and host information. You can also access your host and container maps (shown below) via Datadog Infrastructure Monitoring to assess the damage to your system at a high level, including using tags to filter for all the hosts that have been affected and locate any downstream impacts.

Optimize your mobile usability with the Instabug Apdex widget
The Instabug Apdex widget combines your UX data with crash reports to provide meaningful, context-driven troubleshooting. With clear categories and customizable variables, Instabug’s widget helps you make sense of your Apdex score and tailor it according to your app’s needs. You can then cross-reference your mobile usability insights against Instabug’s bug reports as well as troubleshoot with Datadog APM and Infrastructure Monitoring to find the cause of suboptimal performance.
You can get started by purchasing an Instabug software license through the Datadog Marketplace, installing the Instabug out-of-the-box dashboard widget, and viewing our documentation. If you aren’t already a Datadog user, you can sign up for a 14-day free trial.
The ability to promote branded marketing tools is a membership benefit offered through the Datadog Partner Network. If you are interested in developing an integration or application for the Datadog Marketplace, you can learn more in our Datadog Marketplace blog post and contact us at marketplace@datadog.com.


