Thomas Sobolik
CloudNatix is an infrastructure monitoring and optimization platform for VMs, containers, and other cloud resources. Customers can use CloudNatix’s Autopilot feature to automatically configure and run infrastructure optimization workflows that allocate and run their resources more efficiently. CloudNatix can take action to auto-size Kubernetes and VM workloads, defragment Kubernetes clusters, and create harvest pods from unused VMs, among other key optimizations. CloudNatix also offers its own federated Kubernetes management pane to assist customers with key Day 2 operations, such as debugging, monitoring Kubernetes upgrades, and cost analysis on a per-namespace basis. These features work to help optimize both infrastructure cost and performance.
We’re pleased to announce Datadog’s new partnership with CloudNatix, enabling users to unify Datadog and CloudNatix’s infrastructure data and cloud cost insights. Our partnership includes an integration bringing CloudNatix data into Datadog, as well as a software license offering in the Datadog Marketplace.
In this post, we’ll show how you can leverage Datadog’s unified observability platform to monitor your infrastructure and then quickly pivot to CloudNatix to take action.
Track infrastructure issues and cloud cost in real time
Once you’ve set up CloudNatix to send metrics to Datadog, you can use Datadog’s robust dashboarding and alerting features to track CloudNatix’s insights into your infrastructure’s resource utilization and cloud spend. The out-of-the-box CloudNatix dashboard enables you to review the daily spend for all of your CloudNatix-instrumented resources, alongside the dollar savings that could be applied by implementing CloudNatix’s recommended optimizations.

In the Workloads widget, you can see how many of your workloads are currently being auto-optimized by CloudNatix’s Autopilot feature, how many are instrumented by CloudNatix but not on Autopilot, and how many aren’t currently being tracked. This way, you can spot when your recommended savings is low, for example, or when your workloads’ resources are underutilized, and see if it’s possible to configure more auto-optimizations to remediate these issues.
By configuring alerts on these metrics in Datadog, your team members can receive timely notifications that can apprise them of infrastructure issues. For example, you can configure an alert on your daily cloud spend to be notified immediately when your infrastructure spend breaches its budget. Or, by alerting on your potential savings, you can establish a bellwether for when it’s time to configure further cost optimizations.
Optimize your resource allocation with automated workflows
The out-of-the-box CloudNatix dashboard conveniently links to different views within the CloudNatix platform, so you can quickly pivot to configure optimizations that can help you maximize your savings. You can first pivot to the Workloads page to get more details about which workload optimizations you currently have running. Then, if you’re optimizing a Kubernetes deployment for example, you could dive into the Cluster page to receive recommendations for cluster-level optimizations for your containers—such as compaction, rightsizing, or idle capacity harvesting.
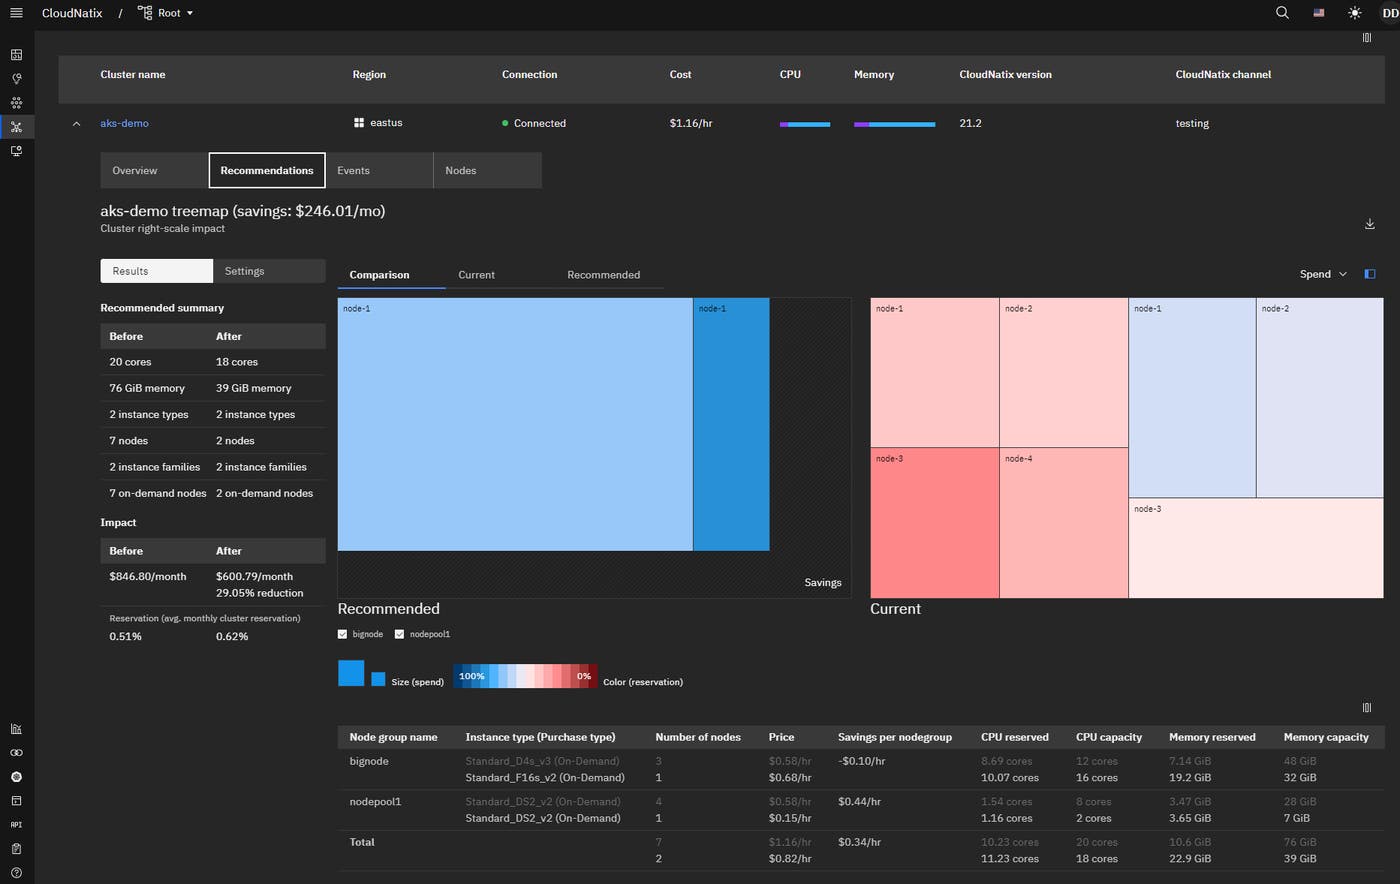
Let’s say you’ve been alerted to low CPU and memory utilization in your Kubernetes cluster and you observe in the dashboard that your cluster can be further optimized by CloudNatix. You can then pivot to the Cluster page and see a recommendation to apply cluster rightsizing, which will automatically find the optimal cluster configuration by running a simulated Kubernetes scheduler to test many different combinations of instance types until it finds the best one.

By applying this recommendation, you’ve helped ensure that your cluster runs as efficiently as possible. You can proceed to configure additional optimizations, such as Cluster Autopilot, or simply wait and see if your cluster’s CPU and memory efficiency improves.
Get started with CloudNatix and Datadog
In a complex, rapidly expanding environment, it’s critical to have full visibility into your infrastructure’s activity and performance and the resulting cost impacts. By integrating CloudNatix and Datadog, you can leverage Datadog’s comprehensive observability platform to track your infrastructure usage and cloud costs, and then pivot directly to CloudNatix to configure optimizations that remediate issues. You can install the integration via the tile and sign up for CloudNatix via the Datadog Marketplace.
The ability to promote branded monitoring tools in the Datadog Marketplace is one of the benefits of membership in the Datadog Partner Network. You can learn more about the Datadog Marketplace in our blog post, and you can contact us at marketplace@datadog.com if you’re interested in developing an integration or application. And if you’re brand new to Datadog, get started with a free trial.


