Michael Cronk
High-performance computing (HPC) environments support some of the most critical workloads in the world—from asset pricing models in financial institutions to molecular simulations in drug discovery. These workloads often span hundreds of thousands of cores, depend on specialized infrastructure such as GPUs, and run for extended periods. As a result, performance and efficiency are critical.
Traditionally, HPC teams have been forced to monitor jobs and infrastructure separately, with no easy way to correlate job behavior with the health of the underlying systems. This lack of visibility leads to underutilized clusters, performance bottlenecks, and costly delays.
Datadog now offers end-to-end visibility across HPC workloads and the infrastructure that supports them. With support for on-premises, hybrid, and cloud-native environments, Datadog helps teams track compute, storage, network, and GPU performance alongside job execution and scheduler activity. In this post, we’ll explore how Datadog can help you:
- Monitor on-premises and cloud-based HPC clusters in a single platform
- Visualize and investigate HPC job behavior
- Correlate compute, storage, network, and GPU metrics with job behavior
- Pinpoint and remediate bottlenecks
Gain end-to-end observability across HPC environments
HPC workloads increasingly span multiple environments. Teams can run tightly coupled simulations on-premises, burst workloads into the cloud during peak demand, or operate entirely in cloud-native environments by using tools such as AWS Parallel Computing Service (AWS PCS) and Microsoft Azure VMs. Datadog supports all of these deployment models, offering consistent visibility regardless of where your workloads run.
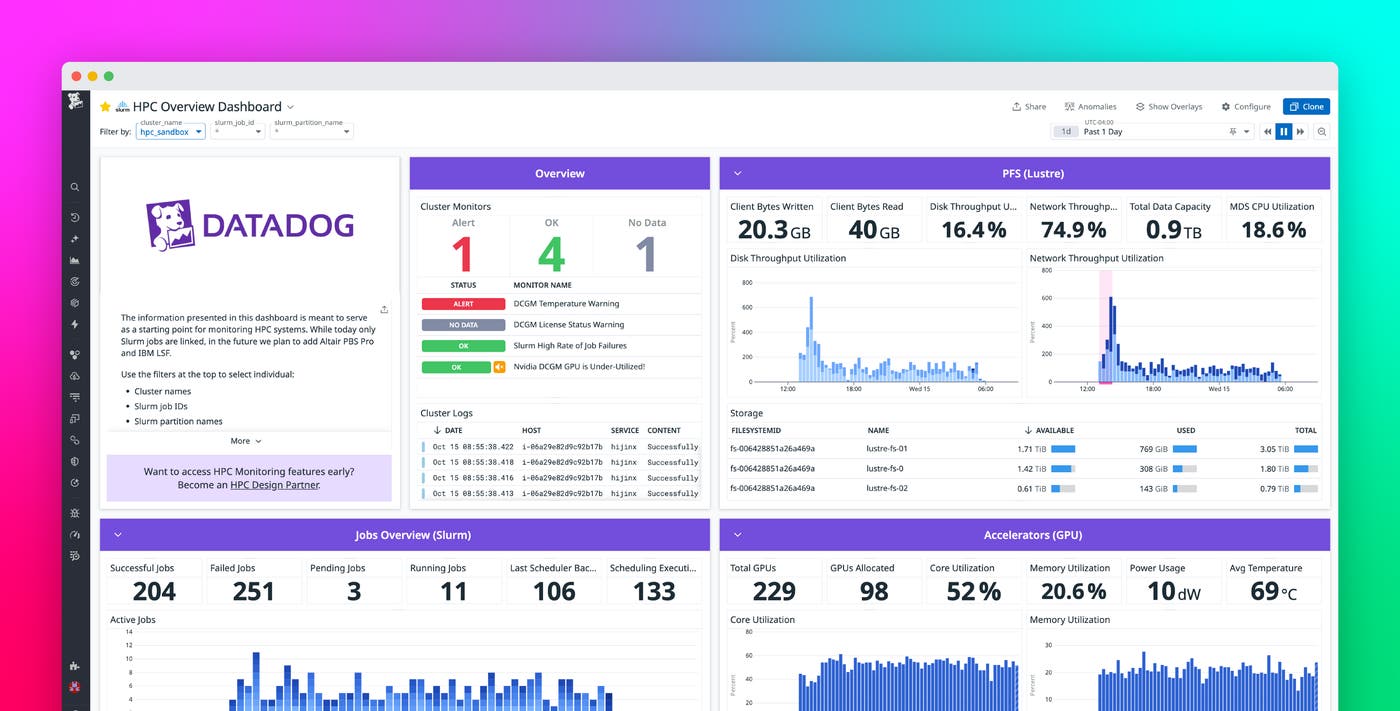
Prebuilt dashboards and monitors are tailored for specific integrations across your HPC stack, and a centralized HPC overview dashboard unites key telemetry data in one place.
Visualize and investigate HPC job behavior
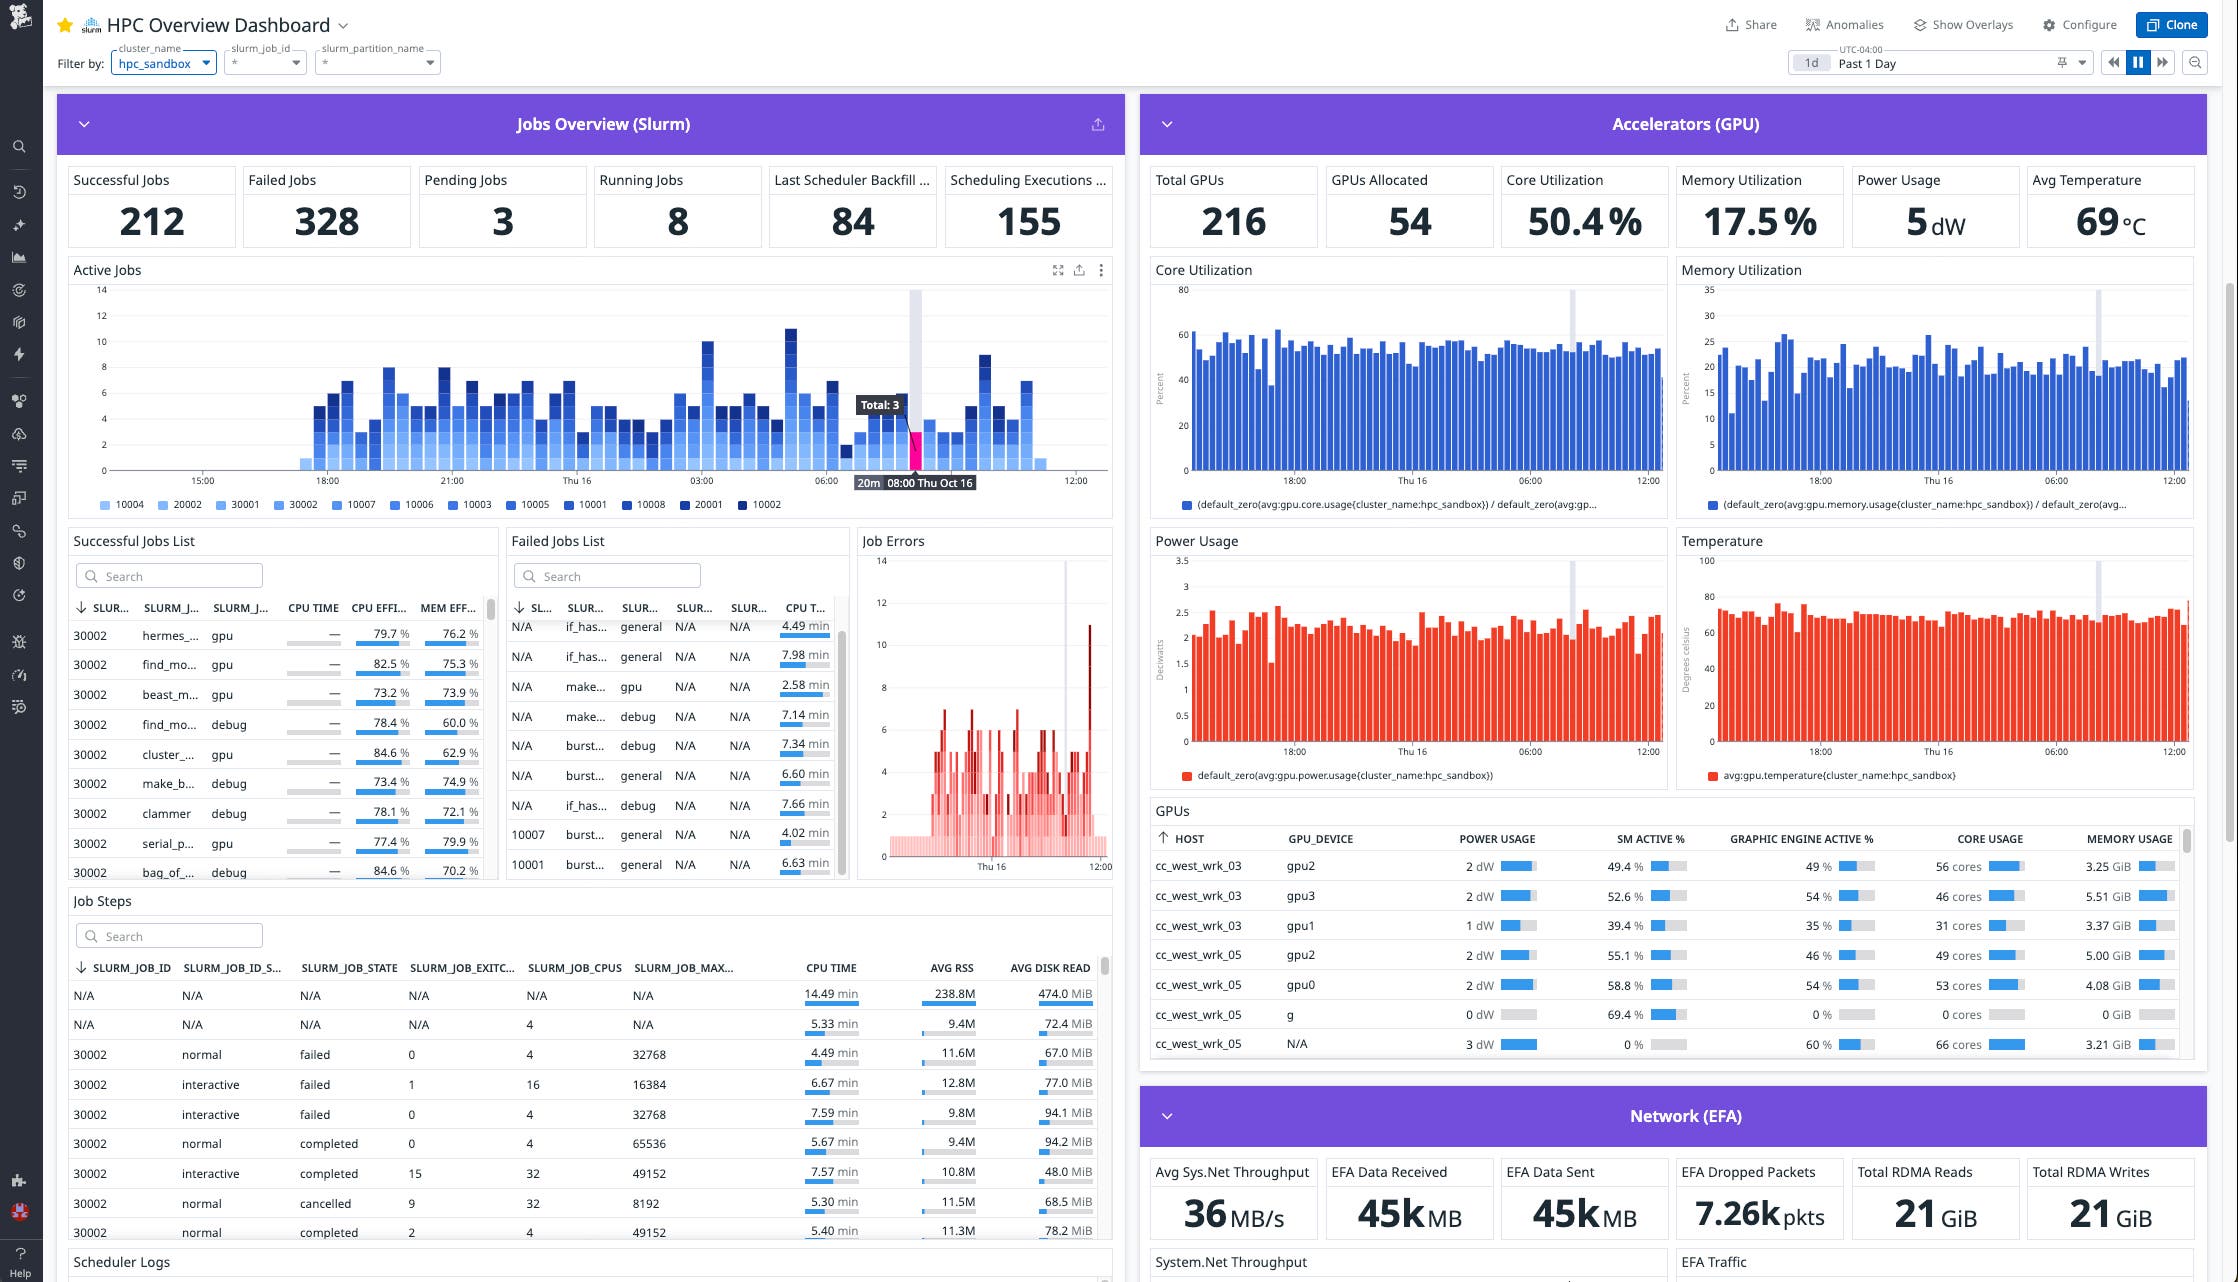
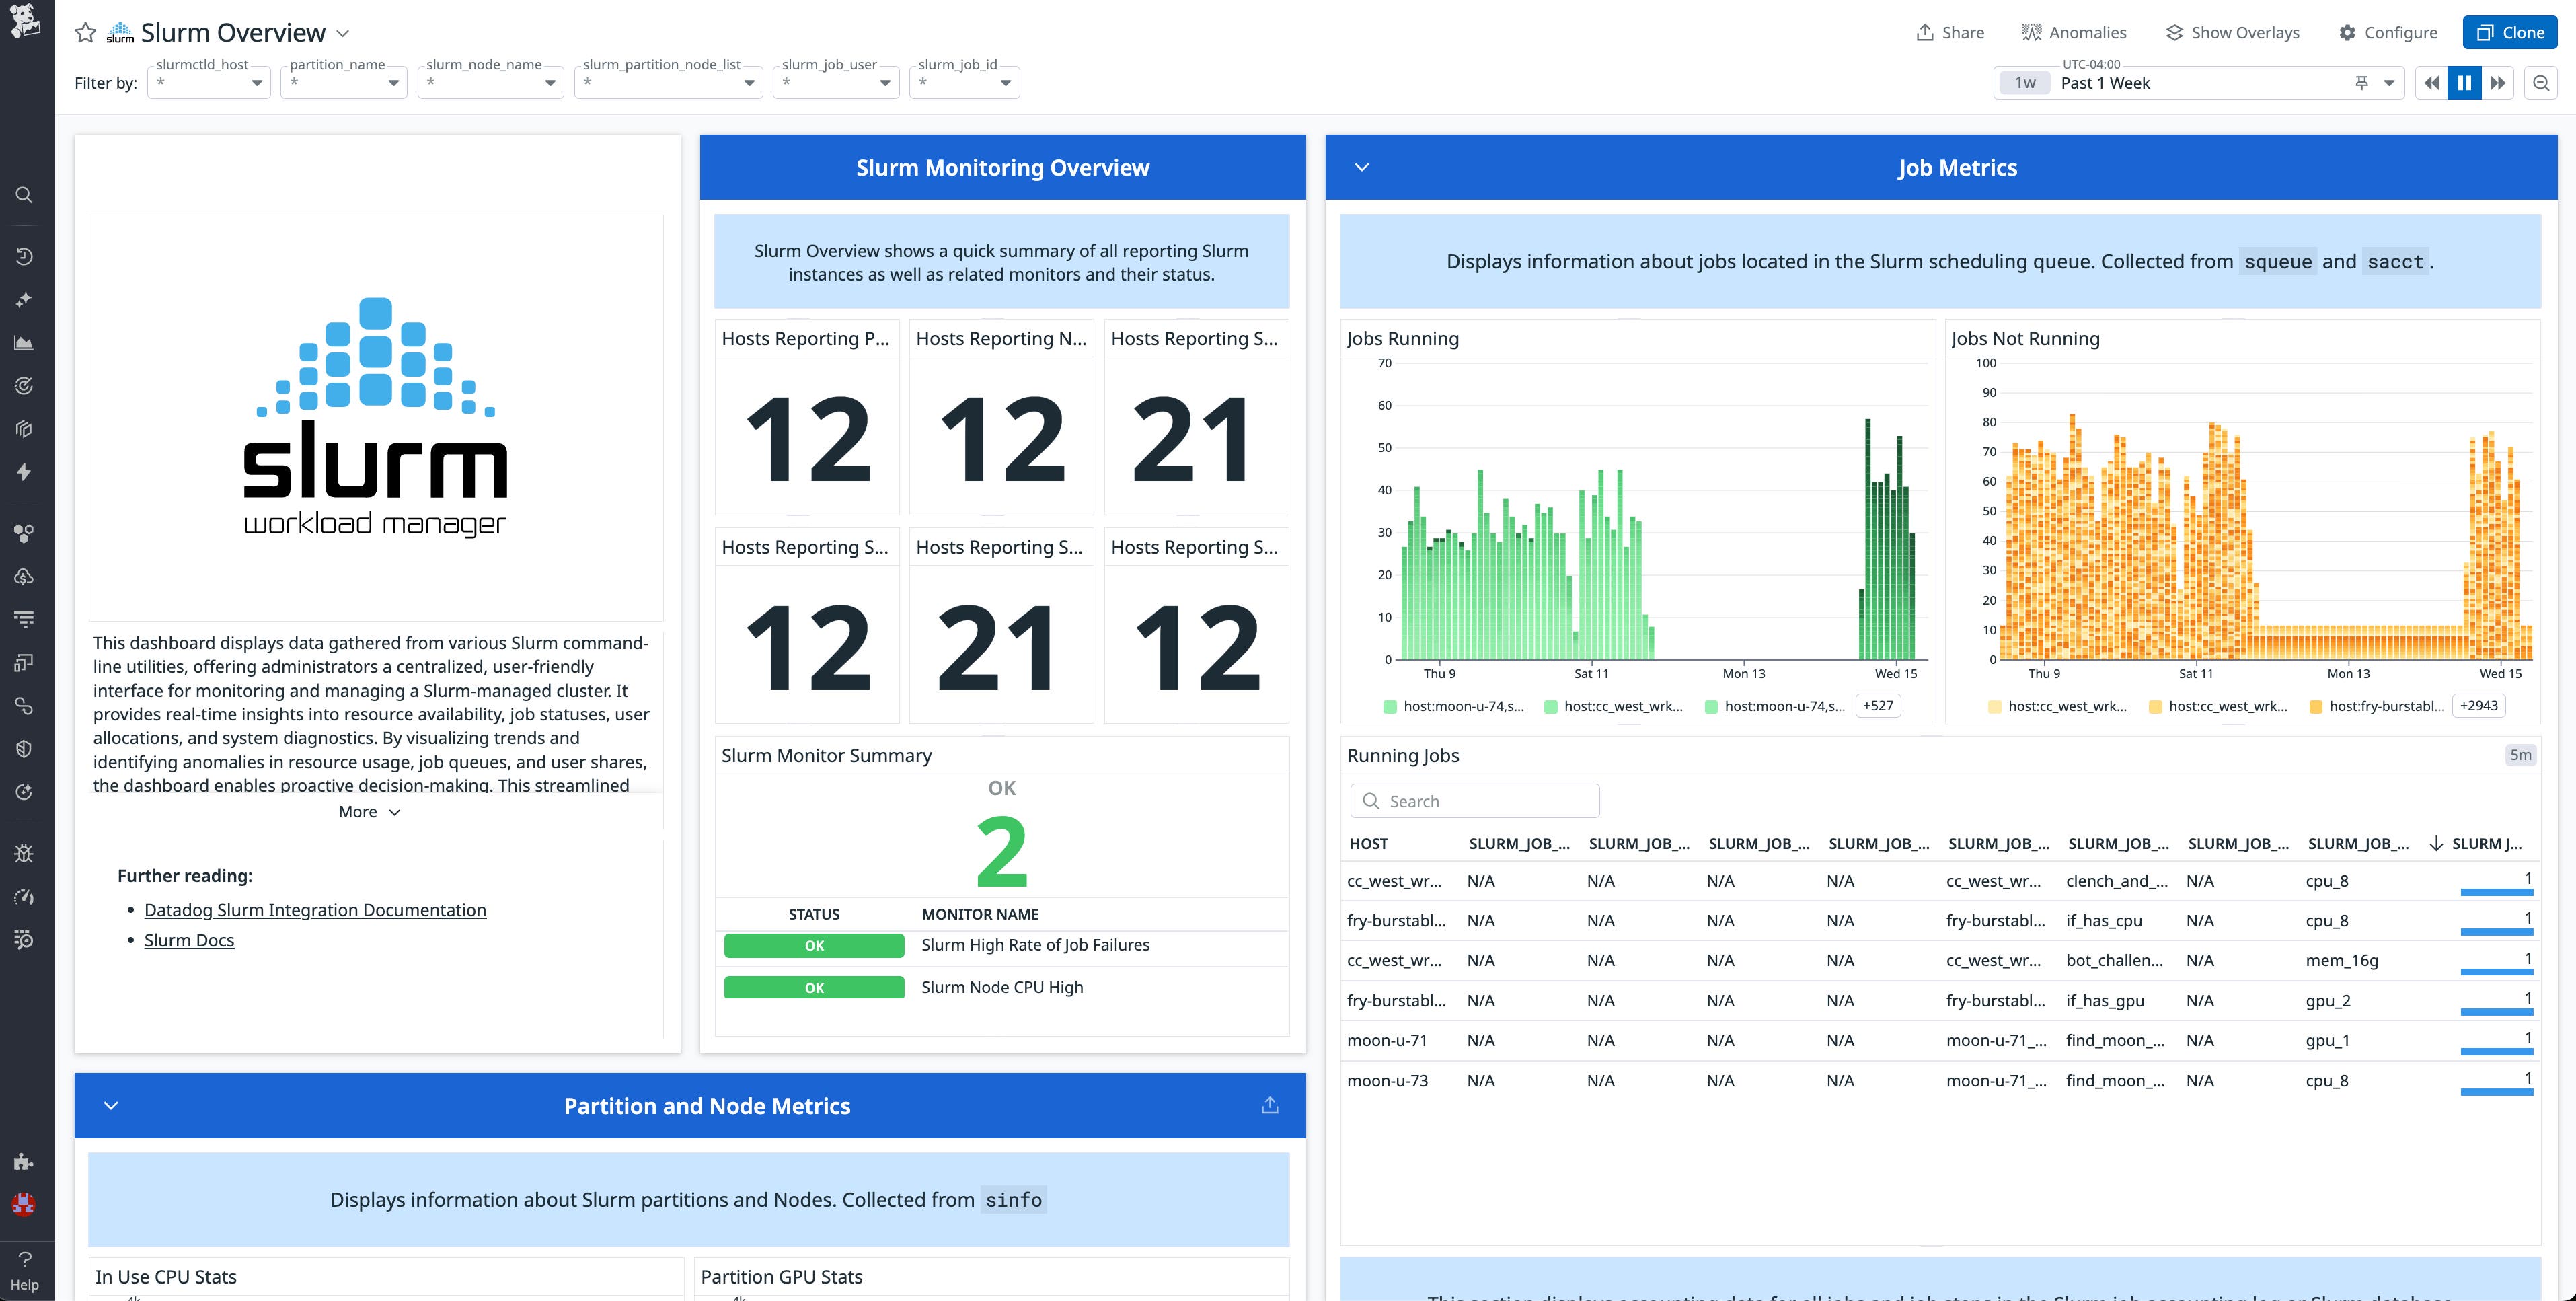
Datadog’s integration with Slurm, one of the most widely used workload managers in HPC environments, provides deep visibility into job activity and performance. Teams can view pending, running, and completed jobs at a glance and quickly identify which have succeeded or failed. The integration also exposes step-level execution metrics such as CPU time, disk I/O, and memory usage for each job step, along with error counts and queue backfill details.
All of this data is presented in a dedicated Slurm dashboard that consolidates job status and performance insights in one place.
Correlate compute, storage, network, and GPU metrics with job behavior
Observing how jobs behave is only part of the picture. To truly optimize throughput, HPC teams need to understand how job execution relates to the performance of the surrounding infrastructure. Datadog connects compute, storage, network, and GPUs, and correlates them with job behavior. When an issue occurs, your teams can use this context to understand what went wrong and why.
Assess compute utilization and cost-effectiveness
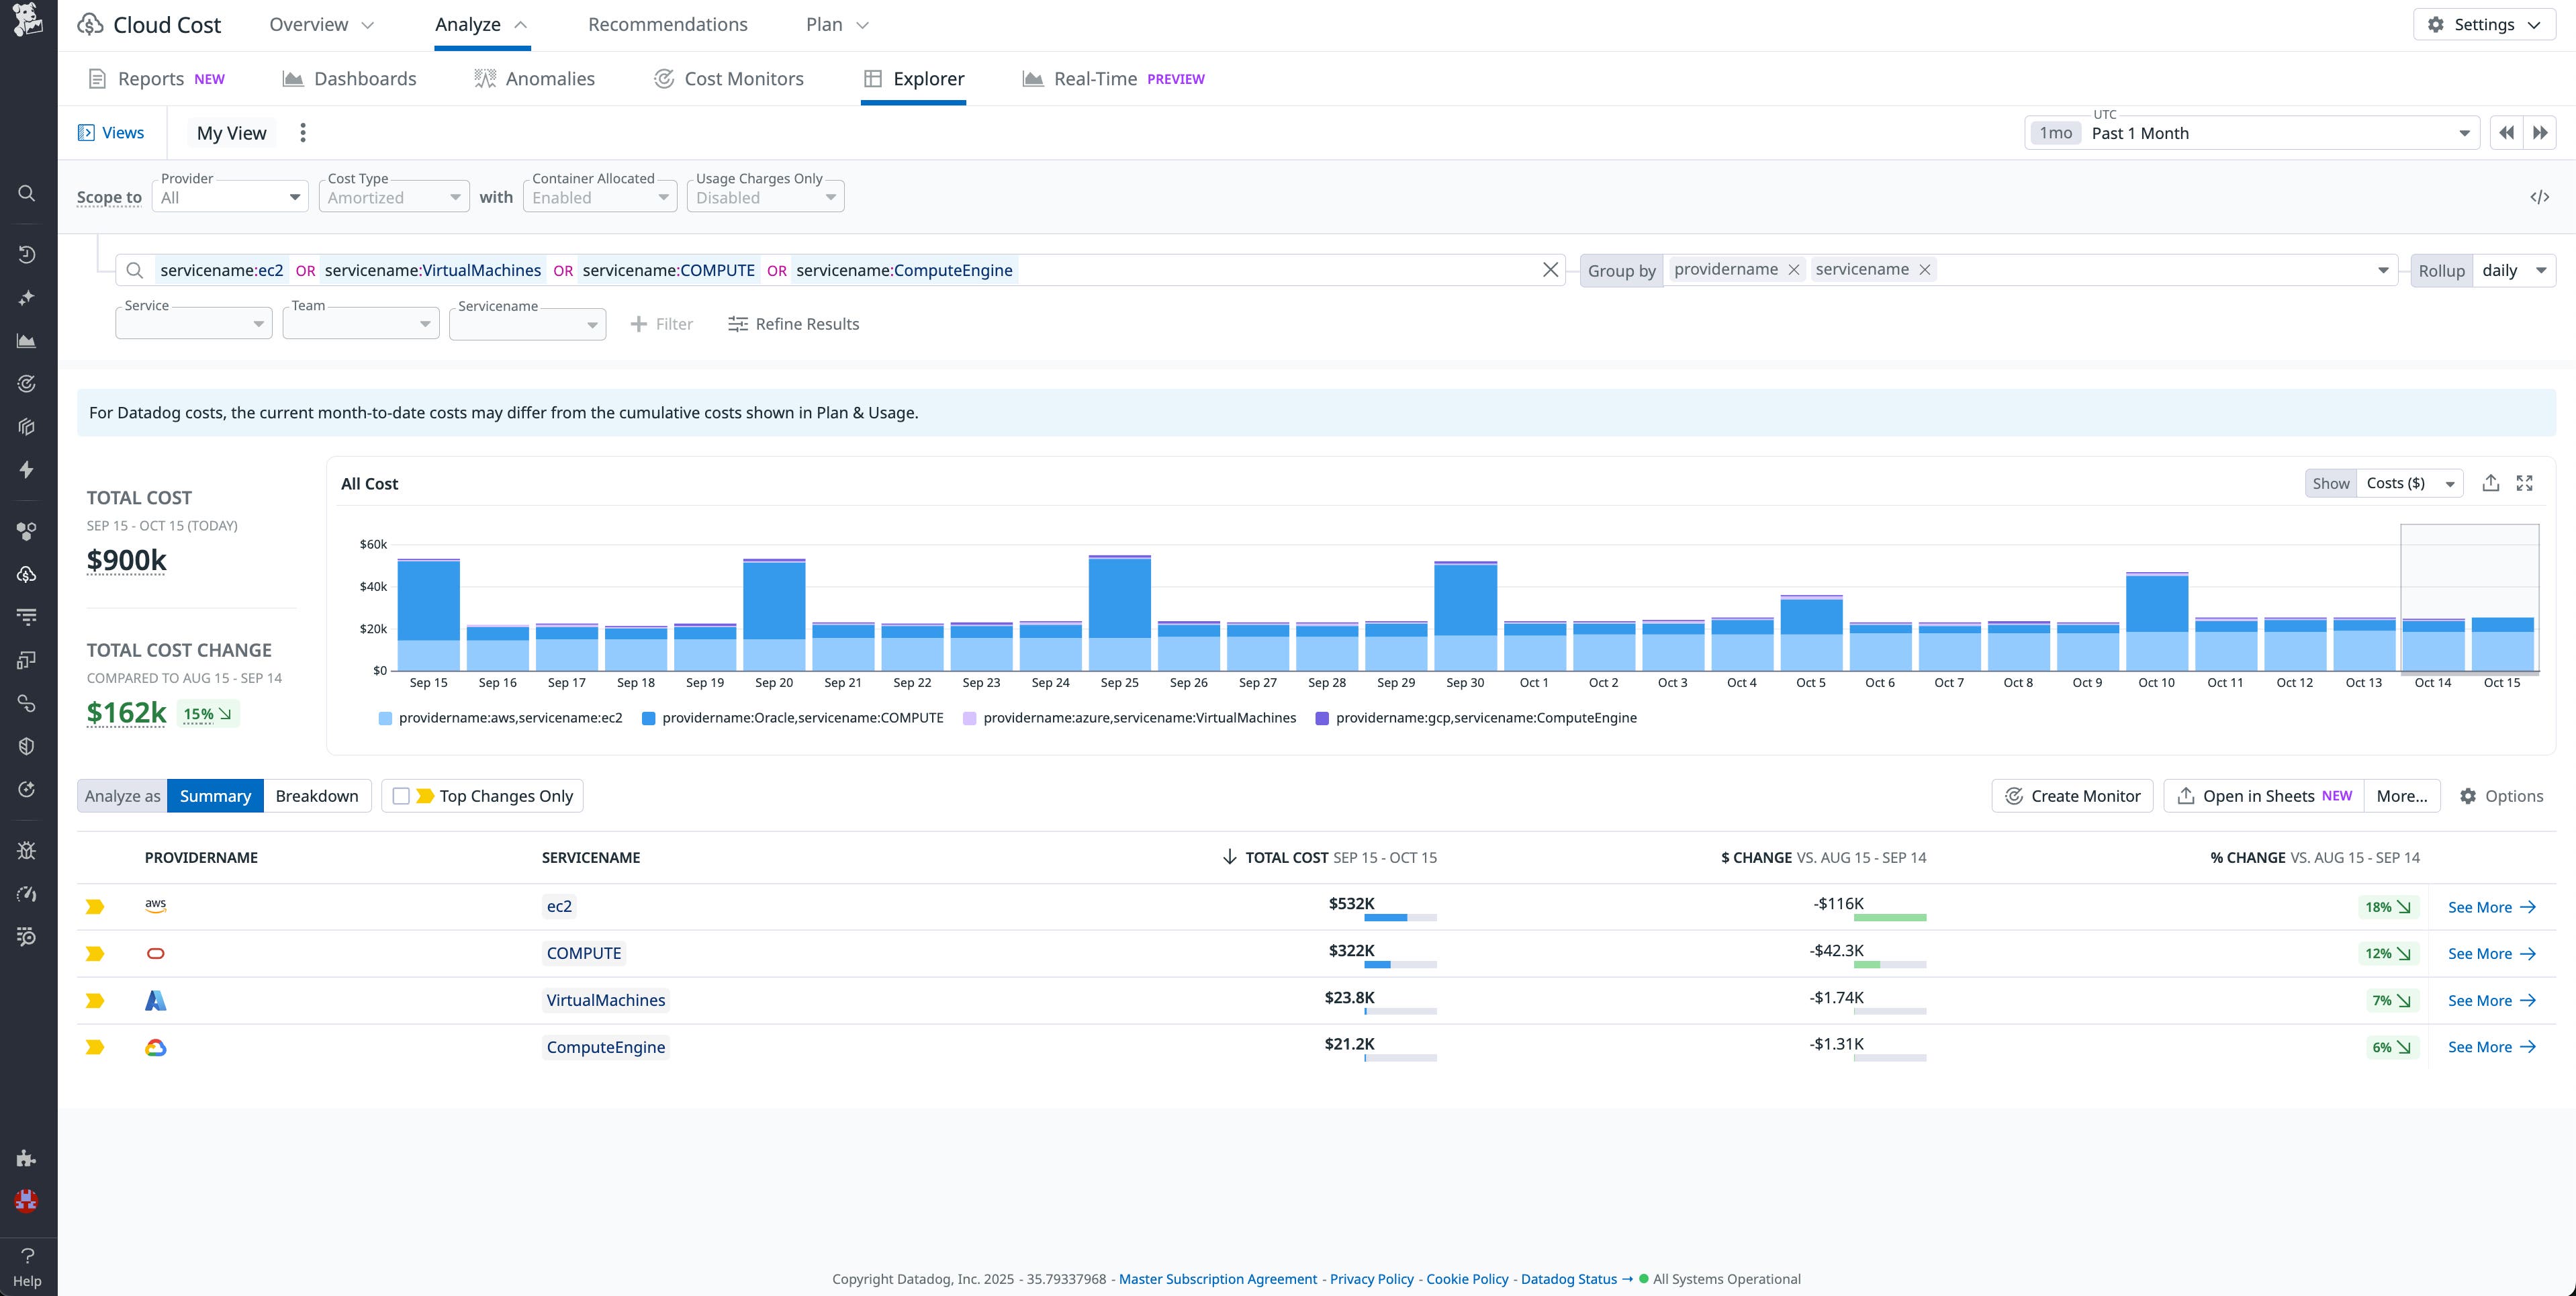
Compute resources are the foundation of HPC workloads, whether the workloads run on-premises, in the cloud, or both. Datadog collects metrics from compute nodes that run on Linux, Windows, Amazon EC2 instances, Azure VMs, and Google Cloud VMs, helping your teams ensure that resources are efficiently utilized and appropriate for workload demands.
Datadog’s CPU utilization metrics highlight idle or overcommitted resources and reveal patterns that can indicate throughput bottlenecks. These insights can be correlated with job execution data to reveal which workloads drive usage spikes, fail to saturate nodes, or compete for resources inefficiently. Datadog Cloud Cost Management (CCM) provides additional context by linking compute usage to spend, helping you make informed decisions about workload placement and cloud resource allocation.
Identify storage-related slowdowns
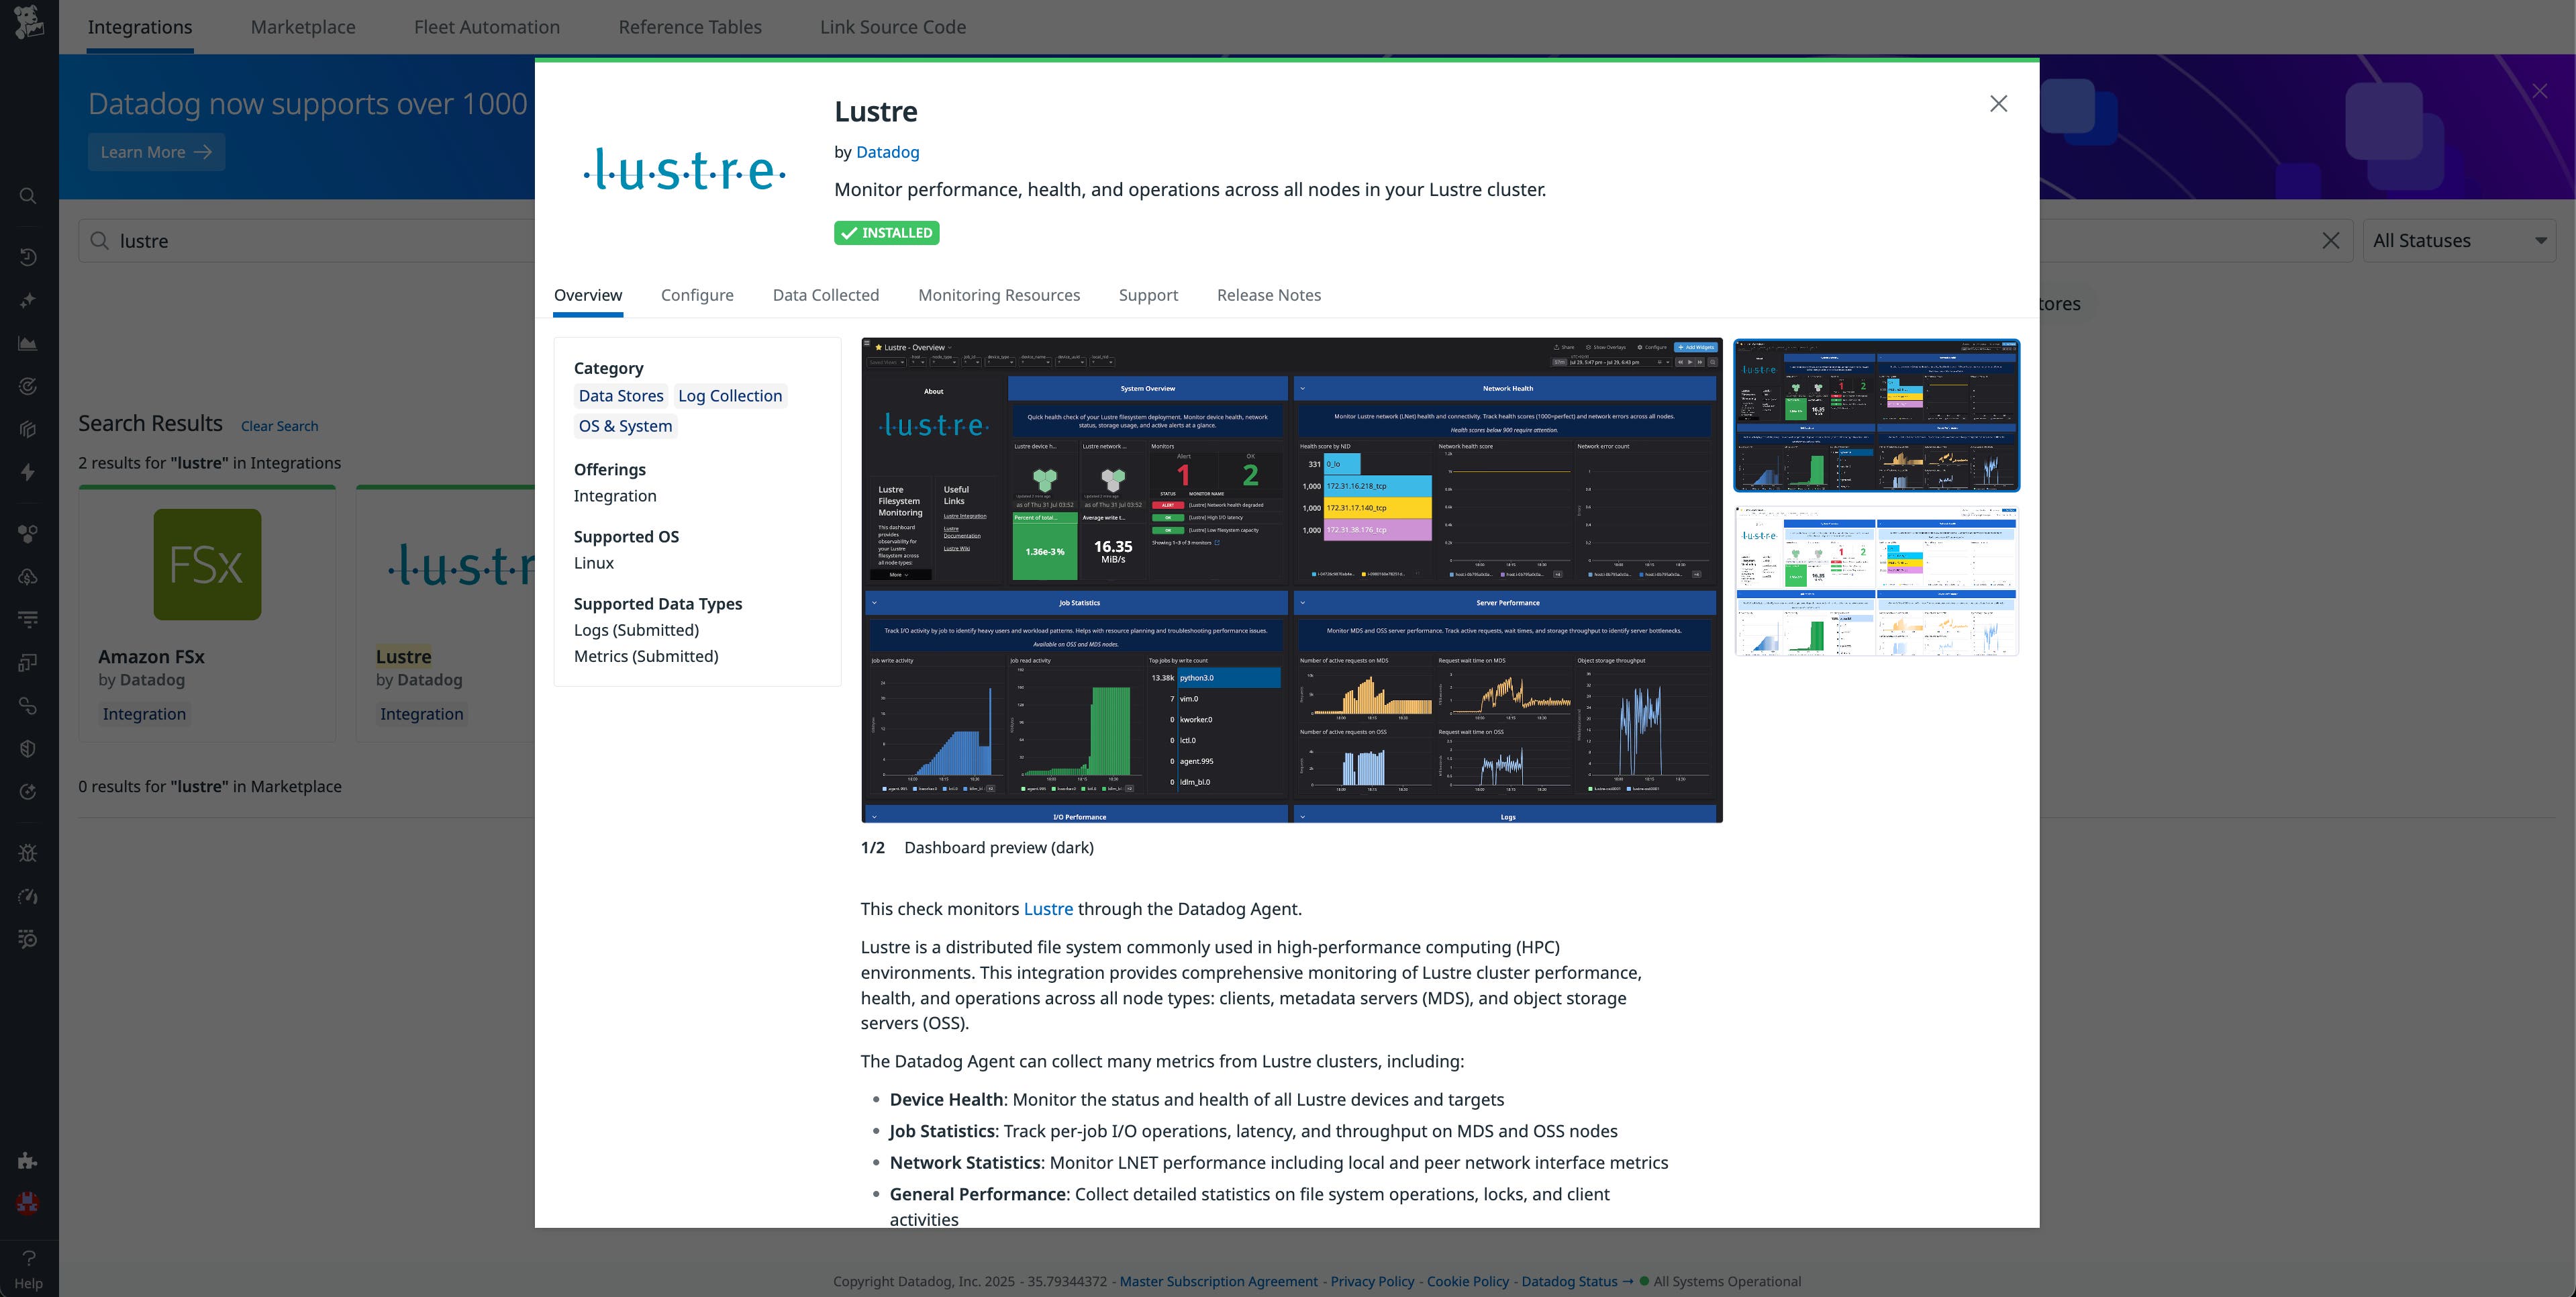
Storage is a common source of performance degradation in HPC workloads. To help identify and resolve storage-related bottlenecks, Datadog offers an integration with Lustre, a high-performance parallel file system (PFS) that is used in many clusters. This integration provides metrics such as metadata server load, I/O throughput, and lock contention, as well as indicators of inefficient access patterns like small file reads. When paired with job-level data, these metrics make it easier to determine whether a given slowdown is due to job logic or I/O stalls in the file system.
Datadog also supports secondary storage systems, including Amazon EFS and Amazon S3, that are frequently used in cloud-based HPC environments.
Detect network throughput and latency issues
In HPC environments, network performance is closely tied to workload efficiency. Latency or throughput degradation on high-speed interconnects can delay job execution even when compute and storage are otherwise healthy.
Datadog provides observability into interconnects like F5 Networks and InfiniBand, enabling your teams to track metrics such as round-trip time and packet retransmits. This visibility makes it easier to pinpoint when networking issues are responsible for idle nodes or delayed I/O, and it helps your teams take corrective action before jobs fail or stall.
Track NVIDIA GPU usage and performance
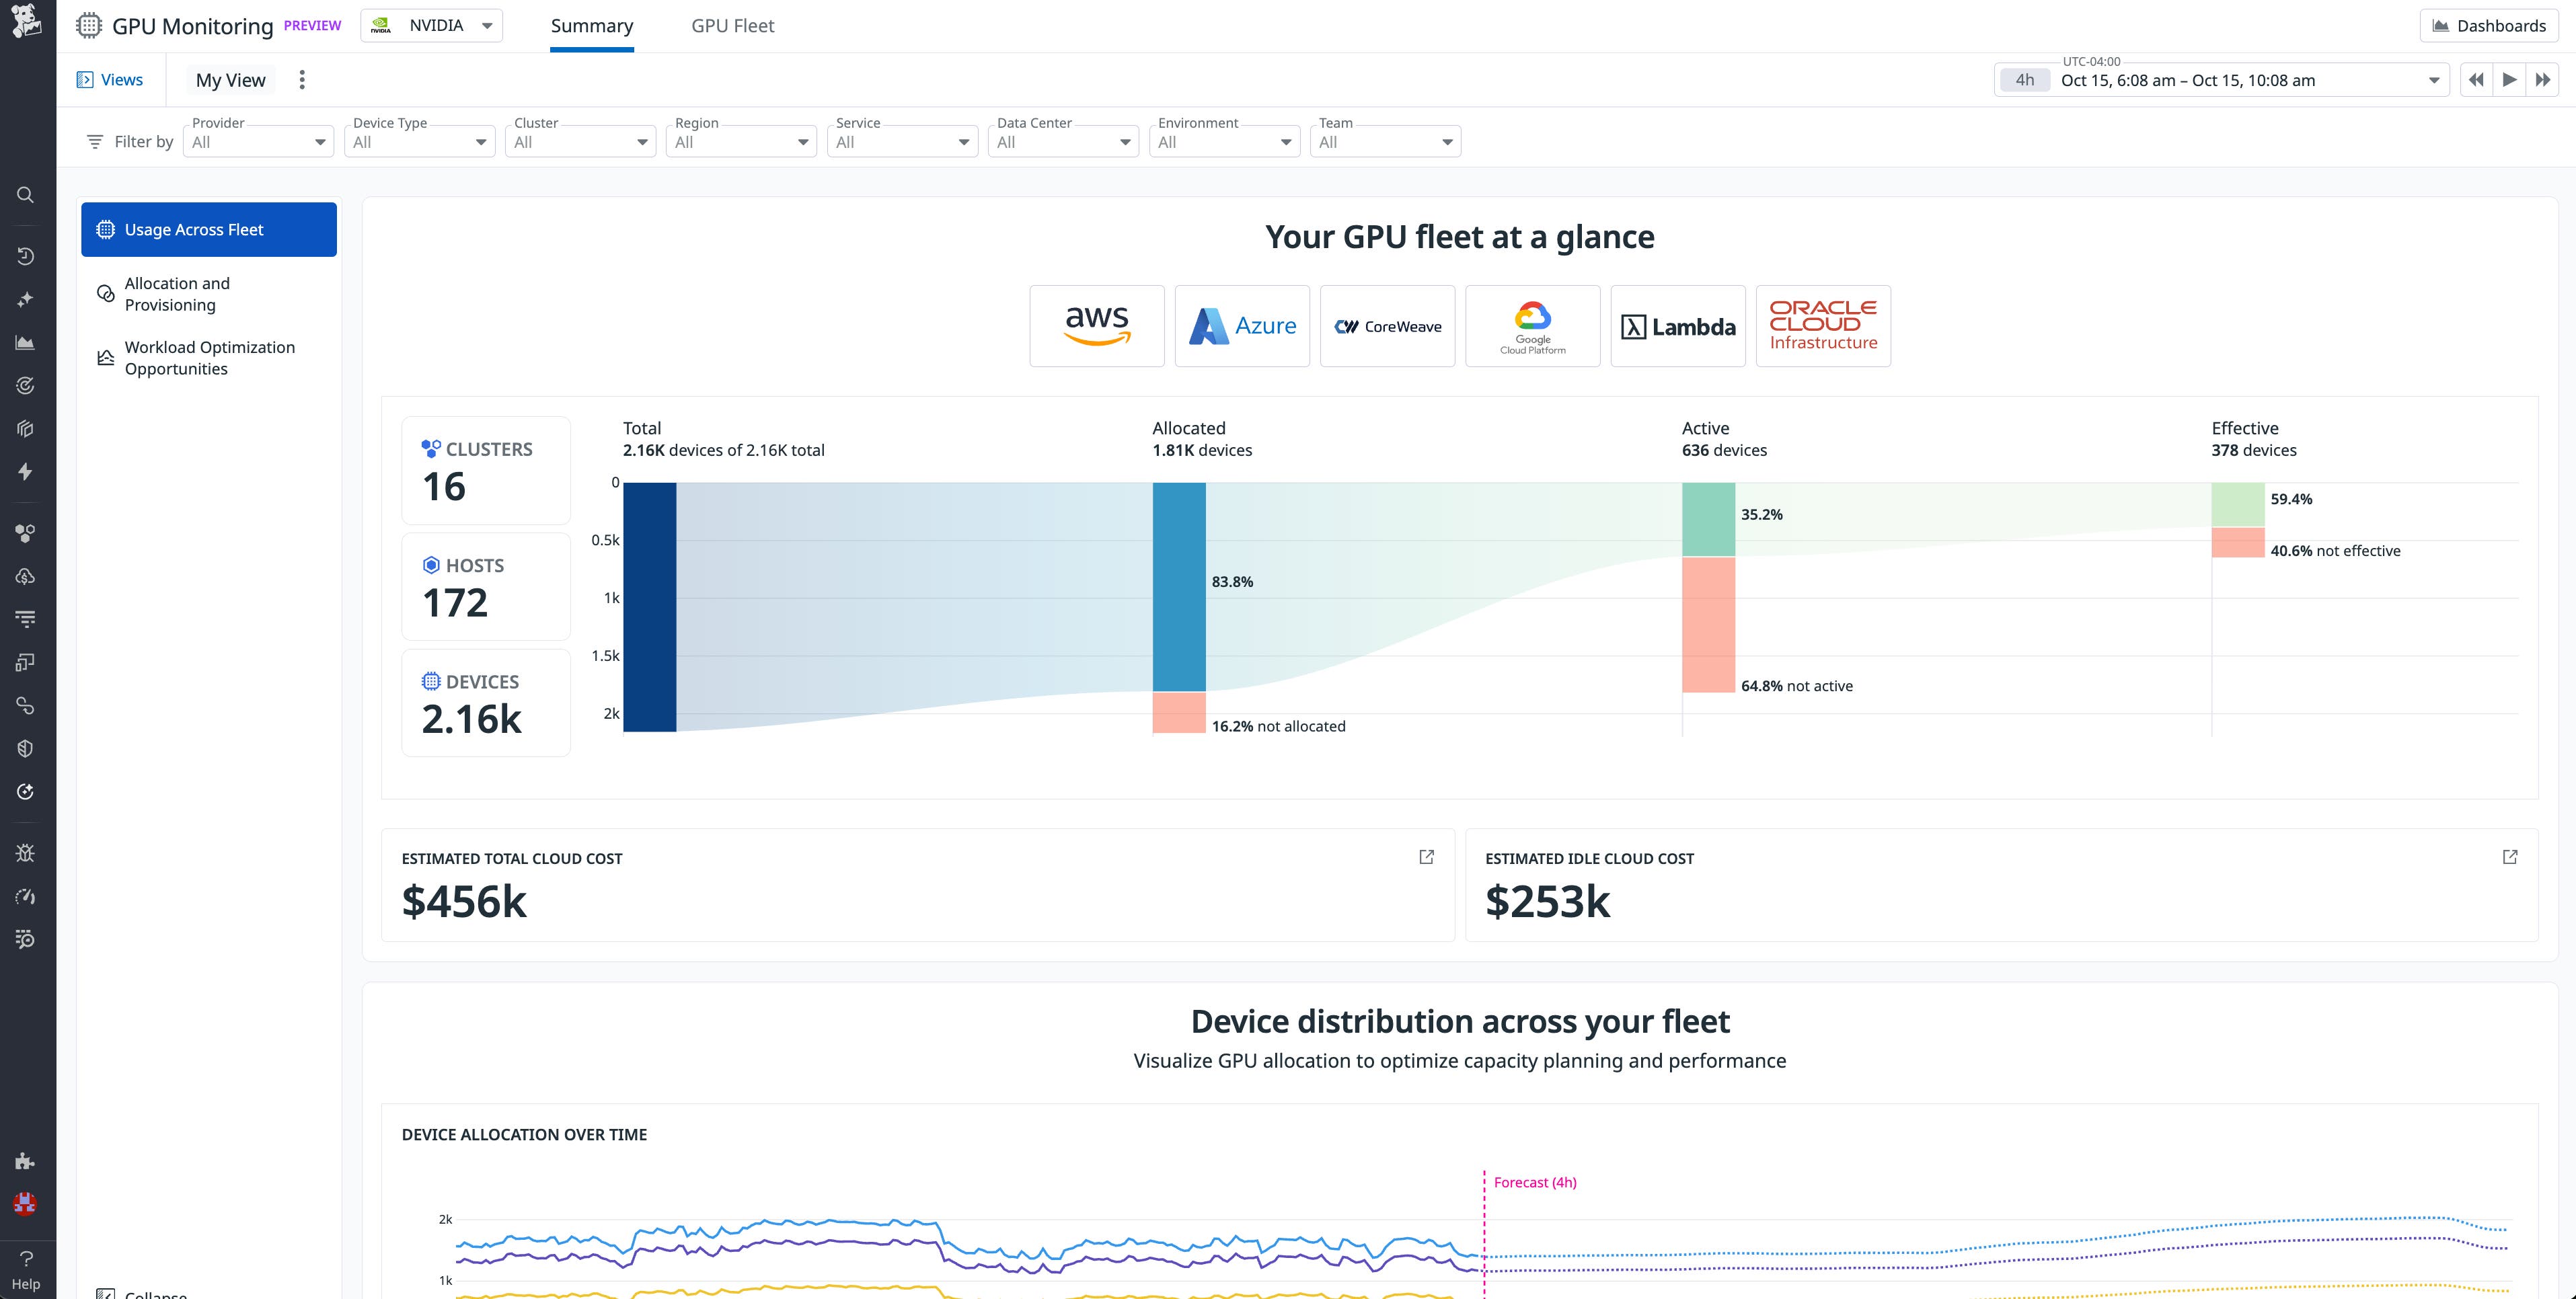
GPU acceleration plays a central role in many HPC workloads, including those that train machine learning models and run data-intensive simulations. You can monitor GPU performance by using Datadog’s NVIDIA integration, which captures metrics from NVIDIA Data Center GPU Manager (DCGM). With Datadog’s GPU Monitoring feature, your teams can track GPU utilization, temperature, memory usage, and error rates to help keep this specialized hardware running efficiently.
This level of visibility helps identify idle GPUs, imbalanced workloads where CPUs and GPUs are poorly coordinated, and hardware-level issues that might otherwise go undetected. By correlating GPU metrics with job activity and systemwide performance, you can more easily diagnose bottlenecks and recover wasted capacity.
Pinpoint and remediate bottlenecks
Although monitoring is essential, HPC teams also need tools that help them act on the data that they collect. Datadog is developing new features that go beyond visualization.
These capabilities include a bottleneck detection feature that explains the impact of the identified congestion on throughput and provides remediation suggestions to improve cluster utilization and efficiency. Additionally, a new UI provides a job execution graph that enables you to track jobs through the queued, active, and completed stages. To deploy these advanced preview features in your HPC environments and participate in design and feedback sessions, sign up to be a design partner.
Start optimizing your HPC workloads with Datadog
HPC environments can be costly and complex to operate. When teams lack the ability to connect job behavior with system performance, they risk wasting resources, failing to diagnose problems, and incurring unnecessary costs. Datadog addresses these challenges by providing end-to-end observability across the HPC stack from schedulers and compute to storage, network, and GPUs.
With support for on-premises, cloud, and hybrid deployments, Datadog helps your HPC teams improve job throughput, maximize cluster utilization, and resolve performance issues. To get started optimizing your HPC workloads, check out our Slurm documentation or sign up to be a design partner.
If you don’t already have a Datadog account, you can sign up for a 14-day free trial.
