John Matson
This post is part 1 of a 3-part series about monitoring Apache Cassandra performance. Part 2 is about collecting metrics from Cassandra, and Part 3 details how to monitor Cassandra with Datadog.
What is Cassandra?
Apache Cassandra is a distributed database system known for its scalability and fault-tolerance. Cassandra originated at Facebook as a project based on Amazon’s Dynamo and Google’s BigTable, and has since matured into a widely adopted open-source system with very large installations at companies such as Apple and Netflix. Some of Cassandra’s key attributes:
Highly available (a Cassandra cluster is decentralized, with no single point of failure)
Scales nearly linearly (doubling the size of a cluster doubles your throughput)
Excels at writes at volume
Naturally accommodates data in sequence (e.g., time-series data)
Key Apache Cassandra performance metrics

By monitoring Apache Cassandra performance you can identify slowdowns, hiccups, or pressing resource limitations—and take swift action to correct them. Some of the key areas where you will want to capture and analyze metrics are:
Throughput, especially read and write requests
Latency, especially read and write latency
Disk usage, especially disk space on each node
Garbage collection frequency and duration
Errors and overruns, especially unavailable exceptions which indicate failed requests due to unavailability of nodes in the cluster
This article references metric terminology introduced in our Monitoring 101 series, which provides a framework for metric collection and alerting. Apache Cassandra performance metrics are accessible using a variety of tools, including the Cassandra utility nodetool, the JConsole application, and JMX- or Metrics-compliant monitoring tools. For details on metrics collection using any of these tools, see Part 2 of this series.
Throughput
| Name | Description | Metric type | Availability |
|---|---|---|---|
| Reads | Read requests per second | Work: Throughput | JConsole, JMX/Metrics reporters |
| Writes | Write requests per second | Work: Throughput | JConsole, JMX/Metrics reporters |
Monitoring the requests—both reads and writes—that Cassandra is receiving at any given time gives you a high-level view of your cluster’s activity levels. Understanding how—and how much—your cluster is being used will help you to optimize Cassandra’s performance. For instance, which compaction strategy you choose (see disk usage section below) will likely depend on whether your workload tends to be read-heavy or write-heavy.
Cassandra’s standard metrics include exponentially weighted moving averages for request calls over 15-minute, five-minute, and one-minute intervals. The one-minute rates for read and write throughput are especially useful for near-real-time visibility. These latency metrics are available from Cassandra aggregated by request type (e.g., read or write), or per column family (the Cassandra analogue of a database table).
Metric to alert on: Read throughput
Monitoring the rate of queries at any given time provides the highest-level view of how your clients are interacting with Cassandra. And since Cassandra excels at handling high volumes of writes, you will often want to keep a close eye on the read rate to look out for potential problems or significant changes in your clients’ query patterns. Consider alerting on sustained spikes (over historical baselines) or sudden, unexpected drops (on a percentage basis over a short timeframe) in throughput.

Metric to alert on: Write throughput
Cassandra should be able to gracefully handle large numbers of writes. Nevertheless, it is well worth monitoring the volume of write requests coming into Cassandra so that you can track your cluster’s overall activity levels and watch for any anomalous spikes or dips that warrant further investigation.

Latency
| Name | Description | Metric type | Availability |
|---|---|---|---|
| Write latency | Write response time, in microseconds | Work: Performance | nodetool, JConsole, JMX/Metrics reporters |
| Read latency | Read response time, in microseconds | Work: Performance | nodetool, JConsole, JMX/Metrics reporters |
| Key cache hit rate | Fraction of read requests for which the key’s location on disk was found in the cache | Other | nodetool, JConsole, JMX/Metrics reporters |
Like any database system, Cassandra has its limitations—for instance, there are no joins in Cassandra, and querying by anything other than the row key requires multiple steps. The upside is that Cassandra makes tradeoffs like these to ensure fast writes across a large, distributed data store.
So whatever your Cassandra use case, chances are you care a great deal about write performance. And for many applications, such as supporting user queries, read performance is extremely important as well. Monitoring latency gives you a critical view of overall Cassandra performance and can indicate developing problems or a shifting in usage patterns that may require adjustments to your Cassandra cluster.
Cassandra slices latency statistics into a number of different metrics, but perhaps the simplest and highest-value metrics to monitor are the current read and write latency. The Cassandra metric write latency measures the number of microseconds required to fulfill a write request, whereas read latency measures the same for read requests. Understanding what to look for in these metrics requires a bit of background on how Cassandra handles requests.
How Cassandra distributes reads and writes
Several factors impact Cassandra’s latency, from the speed of your disks to the networks linking the nodes and data centers of your cluster. Tuning two major Cassandra parameters, which control the flow of data into and out of a cluster, can also have an effect.
The replication factor dictates how many nodes in a data center contain a replica of each row of data. Consistency level defines how many of the replica nodes must respond to a read or write request before Cassandra considers that action a success. For instance:
A consistency level of
ONErequires a response from only one replica node;QUORUMrequires a response from a quorum of replicas, with the quorum determined by the formula (replication_factor / 2) + 1, rounded down;ALLrequires that all replica nodes respond.
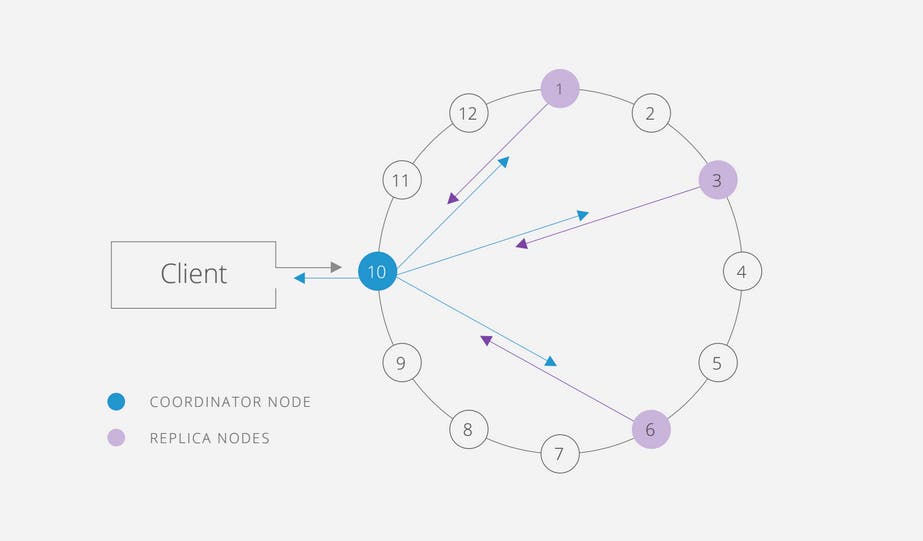
Together, these two factors control how many independent read or write operations must take place before an individual request is fulfilled. For instance, consider the 12-node data center in the diagram below, with a replication factor of three. Each write request will eventually propagate to three replica nodes, but the number of nodes that must perform a write before the request can be acknowledged as successful depends on the consistency level: one node (for consistency level ONE), two nodes (QUORUM), or three nodes (ALL). Similarly, a read request must retrieve responses from only the nearest node (ONE), from two replicas (QUORUM), or from all three replica nodes (ALL). If replica nodes return conflicting data in response to a read request, the most recently timestamped version of the row will be sent to the client.

These parameters provide you with control over your data store’s consistency, availability, and latency. For instance, a consistency level of ONE provides the lowest latency, but increases the probability of stale data being read, since recent updates to a row may not have propagated to every node by the time a read request arrives for that row. On the other hand, a consistency level of ALL provides the highest levels of data consistency but means that a read or write request will fail if any of the replicas are unavailable.
The replication factor is defined when you create a “keyspace” to contain your column families. (A keyspace is akin to a database in a relational context: the keyspace is a collection of column families, just as the database is a collection of tables.) For instance, to create a keyspace called “test,” with each row of each column family replicated three times across the data center, you would run the following command in the CQL (Cassandra Query Language) shell, which is available from Cassandra’s home directory:
$ bin/cqlshcqlsh> CREATE KEYSPACE test WITH REPLICATION = { 'class' : 'SimpleStrategy', 'replication_factor' : 3 };Consistency levels can be set via CQLsh as well:
cqlsh> CONSISTENCY;Current consistency level is ONE.cqlsh> CONSISTENCY QUORUM;Consistency level set to QUORUM.Key caching
Cassandra also features adjustable caches to minimize disk usage and therefore read latency. By default, Cassandra uses a key cache to store the location of row keys in memory so that rows can be accessed without having to first seek them on disk. The key cache hit rate provides visibility into the effectiveness of your key cache. If the key cache hit rate is consistently high (above 0.85, or 85 percent), then the vast majority of read requests are being expedited through caching. If the key cache is not consistently serving up row locations for your read requests, consider increasing the size of the cache, which can be a low-overhead tactic for improving read latency.
The size of the key cache can be checked or set with the key_cache_size_in_mb: setting in the conf/cassandra.yaml file. You can also set the key cache capacity from the command line, using the nodetool utility that ships with Cassandra. For instance, to set the key cache capacity on localhost to 100 megabytes:
$ bin/nodetool --host 127.0.0.1 setcachecapacity -- 100 0The same command can be used to set the size of the row cache (set to zero in the example above), which stores actual rows in memory rather than simply caching the location of those rows. The row cache can provide significant speedups, but it can also be very memory-intensive and must be used carefully. As a result, Cassandra disables row caching by default.
Metric to alert on: Write latency
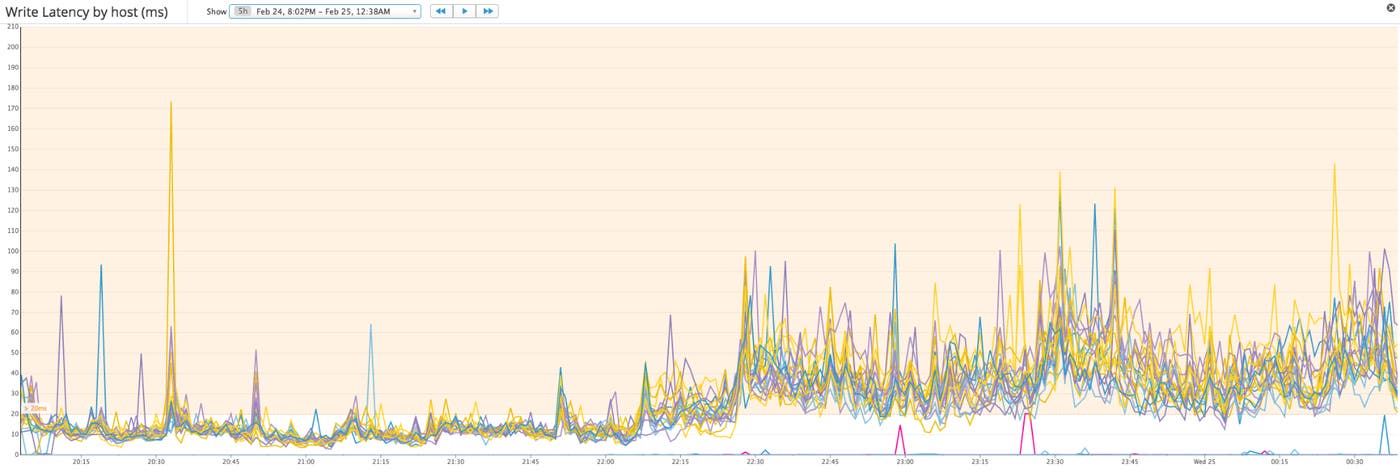
Cassandra writes are usually much faster than reads, since a write need only be recorded in memory and appended to a durable commit log before it is acknowledged as a success. The specific latency levels that you deem acceptable will depend on your use case. Chronically slow writes point to systemic issues; you may need to upgrade your disks to faster SSDs or check your consistency settings. (The consistency setting EACH_QUORUM, for example, requires communication between data centers, which may be geographically distant.) But a sudden change, as seen midway through the time-series graph below, usually indicates potentially problematic developments such as network issues or changes in usage patterns (e.g., a significant increase in the size of database inserts).

Metric to alert on: Read latency
Cassandra’s read operations are usually much slower than writes, because reads involve more I/O. If a row is frequently updated, it may be spread across several SSTables, increasing the latency of the read. Nevertheless, read latency can be a very important metric to watch, especially if Cassandra queries are serving up data into a user-facing application. Slow reads can point to problems with your hardware or your data model, or else a parameter in need of tuning, such as compaction strategy. In particular, if read latency starts to climb in a cluster running level-tiered compaction, it may be a sign that nodes are struggling to handle the volume of writes and the associated compaction operations.

Disk usage
| Name | Description | Metric type | Availability |
|---|---|---|---|
| Load | Disk space used on a node, in bytes | Resource: Utilization | nodetool, JConsole, JMX/Metrics reporters |
| Total disk space used | Disk space used by a column family, in bytes | Resource: Utilization | nodetool, JConsole, JMX/Metrics reporters |
| Completed compaction tasks | Total compaction tasks completed | Resource: Other | JConsole, JMX/Metrics reporters |
| Pending compaction tasks | Total compaction tasks in queue | Resource: Saturation | nodetool, JConsole, JMX/Metrics reporters |
You will almost certainly want to keep an eye on how much disk Cassandra is using on each node of your cluster so that you can add more nodes before you run out of storage.
Cassandra exposes several different disk metrics, but the simplest ones to monitor are load or total disk space used. The metric “load” has nothing to do with processing load or requests in queue; rather it is a node-level metric that indicates the amount of disk, in bytes, used by that node. Total disk space used provides the total number of bytes used by a given column family (the Cassandra analogue of a database table). If you aggregate either metric across your entire cluster, you should arrive at the overall size of your Cassandra data store.
How much free disk space you need to maintain depends on which compaction strategy your Cassandra column families use. When Cassandra writes data to disk, it does so by creating an immutable file called an SSTable. Updates to the data are managed by creating new, timestamped SSTables; deletes are accomplished by marking data to be removed with “tombstones.” To optimize read performance and disk usage, Cassandra periodically runs compaction to consolidate SSTables and remove outdated or tombstoned data.
During compaction, Cassandra creates and completes new SSTables before deleting the old ones; this means that the old and new SSTables temporarily coexist, increasing short-term disk usage on the cluster. The size of that increase (and therefore the disk space needed) varies greatly by compaction strategy:
The default compaction strategy, size-tiered compaction, merges SSTables of similar size. Size-tiered compaction requires the most available disk space (50 percent or more of total disk capacity) because, in the most extreme case, it can temporarily double the amount of data stored in Cassandra. This strategy was designed for write-heavy workloads.
Level-tiered compaction groups SSTables into progressively larger levels, within which each SSTable is non-overlapping. This strategy is more I/O-intensive than size-tiered compaction, but it ensures that most of the time a read can be satisfied by a single SSTable, rather than reading from different versions of a row spread across many SSTables. Aside from providing performance benefits for read-intensive uses, level-tiered compaction also requires much less disk overhead (roughly 10 percent of disk) for temporary use during compaction.
Date-tiered compaction, a newer option that is optimized for time-series data, groups and compacts SSTables based on the age of the data points they contain. Date-tiered compaction has configurable compaction windows, so the disk space needed for compaction can be controlled by adjusting options such as <code>maxSSTableAgeDays</code>, which tells Cassandra to stop compacting SSTables once they reach a certain age.
Compaction activity can be tracked via metrics for completed compaction tasks and pending compaction tasks. Completed compactions will naturally trend upward with increased write activity, but a growing queue of pending compaction tasks indicates that the Cassandra cluster is unable to keep pace with the workload, often because of I/O limitations or resource contention that may require the addition of new nodes.
Metric to alert on: Load
Monitoring the disk used by each node can alert you to an unbalanced cluster or looming resource constraints. Depending on how your Cassandra cluster is used and the compaction strategy that you choose, you can monitor disk utilization to determine when you should add more nodes to your cluster to ensure that Cassandra always has enough room to run compactions.

Garbage collection
| Name | Description | Metric type | Availability |
|---|---|---|---|
| ParNew count | Number of young-generation collections | Other | nodetool,* JConsole, JMX/Metrics reporters |
| ParNew time | Elapsed time of young-generation collections, in milliseconds | Other | nodetool,* JConsole, JMX/Metrics reporters |
| ConcurrentMarkSweep count | Number of old-generation collections | Other | nodetool,* JConsole, JMX/Metrics reporters |
| ConcurrentMarkSweep time | Elapsed time of old-generation collections, in milliseconds | Other | nodetool,* JConsole, JMX/Metrics reporters |
*Note that nodetool reports metrics on all garbage collections, regardless of type
Because Cassandra is a Java-based system, it relies on Java garbage collection processes to free up memory. The more activity in your Cassandra cluster, the more often the garbage collector will run. The type of garbage collection depends on whether the young generation (new objects) or the old generation (long-surviving objects) is being collected.
ParNew, or young-generation, garbage collections occur relatively often. ParNew is a stop-the-world garbage collection, meaning that all application threads pause while garbage collection is carried out, so any significant increase in ParNew latency will impact Cassandra's performance.
ConcurrentMarkSweep (CMS) collections free up unused memory in the old generation of the heap. CMS is a low-pause garbage collection, meaning that although it does temporarily stop application threads, it does so only intermittently. If CMS is taking a few seconds to complete, or is occurring with increased frequency, your cluster may not have enough memory to function efficiently.
Errors and overruns
| Name | Description | Metric type | Availability |
|---|---|---|---|
| Exceptions | Requests for which Cassandra encountered an (often nonfatal) error | Work: Error | nodetool, JConsole, JMX/Metrics reporters |
| Timeout exceptions | Requests not acknowledged within configurable timeout window | Work: Error | JConsole, JMX/Metrics reporters |
| Unavailable exceptions | Requests for which the required number of nodes was unavailable | Work: Error | JConsole, JMX/Metrics reporters |
| Pending tasks | Tasks in a queue awaiting a thread for processing | Resource: Saturation | nodetool, JConsole, JMX/Metrics reporters |
| Currently blocked tasks | Tasks that cannot yet be queued for processing | Resource: Saturation | nodetool, JConsole, JMX/Metrics reporters |
If your cluster can no longer handle the flow of incoming requests for whatever reason, you need to know right away. One window into potential problems is Cassandra’s count of exceptions thrown. In general, you want this number to be very small, although not all exceptions are created equal.
For instance, Cassandra's timeout exception reflects the incomplete (but not failed) handling of a request. Timeouts occur when the coordinator node sends a request to a replica and does not receive a response within the configurable timeout window. Timeouts are not necessarily fatal—the coordinator will store the update and attempt to apply it later—but they can indicate network issues or even disks nearing capacity. The settings read_request_timeout_in_ms (defaults to 5,000 milliseconds), write_request_timeout_in_ms (defaults to 2,000 ms), and other timeout windows can be set in the cassandra.yaml configuration file.
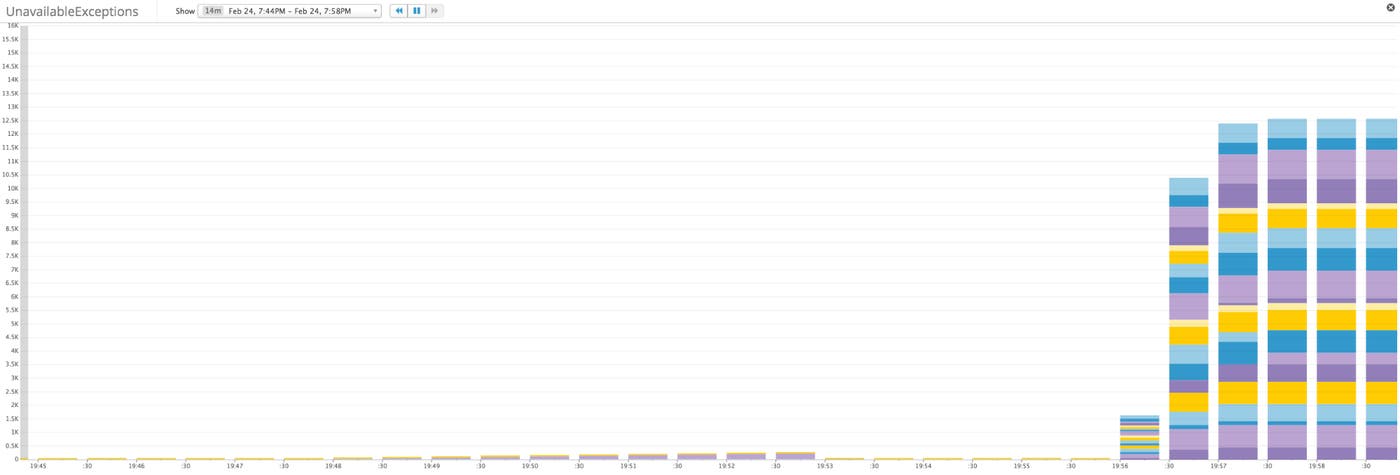
A more worrisome exception type is the unavailable exception, which indicates that Cassandra was unable to meet the consistency requirements for a given request, usually because one or more nodes were reported as down when the request arrived. For instance, in a cluster with replication factor of three and a consistency level of ALL, a read or write request will need to reach all three replica nodes in the cluster to perform a successful read or write.
Another way to detect signs of incipient problems is to monitor the status of Cassandra’s tasks as it processes requests. Each type of task in Cassandra (e.g., ReadStage tasks) has a queue for incoming tasks and is allotted a certain number of threads for executing those tasks. If all threads are in use, tasks will accumulate in the queue awaiting an available thread. The number of tasks in a queue at any given moment is described by the metric pending tasks. Once the queue of pending tasks fills up, Cassandra will register additional incoming tasks as currently blocked, although those tasks may eventually be accepted and executed.
Metric to alert on: Unavailable exceptions
An unavailable exception is the only exception that will cause a write to fail, so any occurrences are serious. Cassandra’s inability to meet consistency requirements can mean that several nodes are down or otherwise unreachable, or that stringent consistency settings are limiting the availability of your cluster.

Conclusion
In this post we’ve explored several of the metrics you should monitor to keep tabs on your Cassandra cluster. If you are just getting started with Cassandra, monitoring the metrics in the list below will provide visibility into your data store’s health, performance, and resource usage, and may help identify areas where tuning could provide significant benefits:
Eventually you will recognize additional, more specialized metrics that are particularly relevant to your own Cassandra cluster and its users. For instance, if the vast majority of your data lives in a single column family, you may find column family–level metrics especially valuable, whereas more aggregated metrics may be more informative if your data is spread across a large number of column families.
Read on for a comprehensive guide to collecting any of the metrics described in this article, or any other metric exposed by Cassandra.
Acknowledgments
Many thanks to Matt Stump and Adam Hutson for suggesting additions and improvements to this article.
Source Markdown for this post is available on GitHub. Questions, corrections, additions, etc.? Please let us know.

