Addie Beach

Lukas Goetz-Weiss

Ryan Lucht
Metrics are fundamental to experimentation for two reasons: They set the basis for evaluating ideas and interventions, and they can suggest where to look next. As such, many teams collect a wide variety of metrics, from application performance data to revenue trends. However, doing so often means manually knitting together data from multiple sources and formats. Even then, data silos can make it challenging to understand the full impact of experimental changes.
In this post, we’ll explore:
- The types of data you’ll encounter when working with experiments
- How to organize and analyze this data as you run experiments
- How to combine this data for cross-team collaboration and end-to-end visibility
Understanding experimental data
Teams use experiments for many reasons, including quickly catching bugs and analyzing marketing campaigns. As such, their data needs vary drastically. Engineering teams need real-time observability data to quickly detect and mitigate production issues resulting from code deployments, while product management and design teams rely on behavioral data to understand the subtle impact that changes have on user experience (UX). They may also look to business metrics to help them answer big-picture questions from stakeholders.
These different forms of experimental data can be broken down into two basic categories:
-
Event stream data: This data powers observability across your app. It includes both application performance metrics and behavioral analytics. Event stream data enables quick insights into the current state of your app and how it compares against historical trends. As a result, volume, speed, and low ingestion costs are the main priorities for this type of data. To simplify ingestion and analysis, monitoring platforms often structure this data using generalized schemas.
-
Transactional data: This data powers applications and serves as a reliable source of truth. Teams often use transactional data from completed user sessions for long-term, big-picture analyses, typically focused on user retention or revenue generation. With quality and accuracy as the primary concerns, transactional data schemas are custom-built for specific purposes and undergo rigorous engineering reviews. Transactional data sources are expensive to build but are crucial for tracking progress toward business objectives. This data is usually replicated to a data warehouse for further processing by data modeling jobs and analysis at a scheduled cadence, meaning that any insights are usually at least several hours behind real time.
| Data type | Latency | Accuracy | Examples |
|---|---|---|---|
| Event stream data | Low | Moderate | Error rates, pageviews, requests per second, click counts |
| Transactional data | High | High | Total revenue, cost per conversion, customer lifetime value |
Data throughout the experiment lifecycle
Both event stream data and transactional data are essential for designing robust experiments. To understand their roles, we can explore how these data types factor into each step of creating an experiment.
Hypothesis generation
Most experiments begin with a hypothesis about how the experiment will affect your system. Each hypothesis has two key parts: the change being tested and the expected result. For large-scale experiments, the expected result often ties to a business goal that correlates with transactional data, such as an increase in user spend.
Let’s say your organization is considering a major redesign of your app’s UI. You decide to conduct an experiment to see whether redesigning a single key feature generates enough revenue to justify the larger project. You’ll measure the revenue increase (or decrease) using transactional data, with the exact metric determined during the experimental design phase.
Experiment design
When designing the experiment, you need to decide which metrics you’ll use to measure impact. First, determine your goal metrics—the key indicators of your experiment’s impact. Goal metrics tie closely to the expected result of your hypothesis, so their accuracy is key. Teams often rely on transactional data for these primary success metrics. Continuing the example from above, you may use average revenue per user (ARPU) to track whether your redesign results in a greater spend.
However, transactional data is often best analyzed on a longer timeline to ensure that you capture a full, accurate picture of any trends. To capture the smaller fluctuations in user behavior that help you make quicker judgments, you may also want to include driver metrics based on event stream data. For example, while you may want to measure ARPU for several weeks after the start of the experiment, you can immediately track increases in checkout pageviews or clicks on a Purchase button as users interact with your app.
Lastly, you may also want to include guardrail metrics to ensure that your experiments haven’t broken key functionality. Because these metrics often need to be measured in real time to help your teams quickly catch issues, they often come from event stream data. Guardrail metrics may include error rates or page load durations. However, teams may also occasionally use guardrail metrics to catch changes in transactional data as well. For example, they may want to ensure that an experimental feature doesn’t lower the average order amount.
Audience selection
The final step before running your experiment is selecting the target audience. Many teams target a sample of the global population, but sometimes you want more control over who participates in the experiment. For example, you might isolate power users or users in a certain marketing region. To do so, you can create targeting rules based on transactional user data to define your sample.
Experiment launch
After launching your experiment, you’ll often need to wait a few days before analyzing the results to collect enough data to draw a statistically sound conclusion. However, it’s important to start monitoring your guardrail metrics right away to catch any critical issues caused by your changes. In this case, you might set up real-time alerts for error rates and cart abandonments to quickly address and restore functionality.
Analysis and interpretation
When your experiment has generated enough data, you can begin analyzing the results. You’ll want to rely on driver metrics for immediate insights and your goal metrics for a deeper view of success. Driver metrics, which are usually based on event stream data, help you identify subtle changes in user behavior more quickly.
In this scenario, you see a clear increase in Purchase button clicks after implementing your experiment. However, this doesn’t necessarily mean revenue has increased. Users may be making smaller purchases or clicking repeatedly on a broken button in frustration. With goal metrics based on transactional data, you can see what’s actually happening. When you look at ARPU, you find the higher click rate does indeed correlate with an increase in revenue, suggesting that the experiment was successful and the redesign project can move forward.
Unite teams through shared data with Eppo and Datadog
Event stream and transactional data work hand in hand during experiments to help teams make well-informed decisions based on solid results. Behavioral metrics show how users interact in the moment, while business data reveals whether those behaviors have a measurable impact. Combining both types of data simplifies cross-organizational collaboration. Product Managers (PMs) and engineering teams can easily investigate the impact of performance issues, while engineers can more easily work with data teams on instrumenting, organizing, and modeling data. PMs can then perform meaningful analyses without relying solely on data teams. To take full advantage of both event stream and transactional data in your experiments, though, you need to be able to visualize them in the same place.
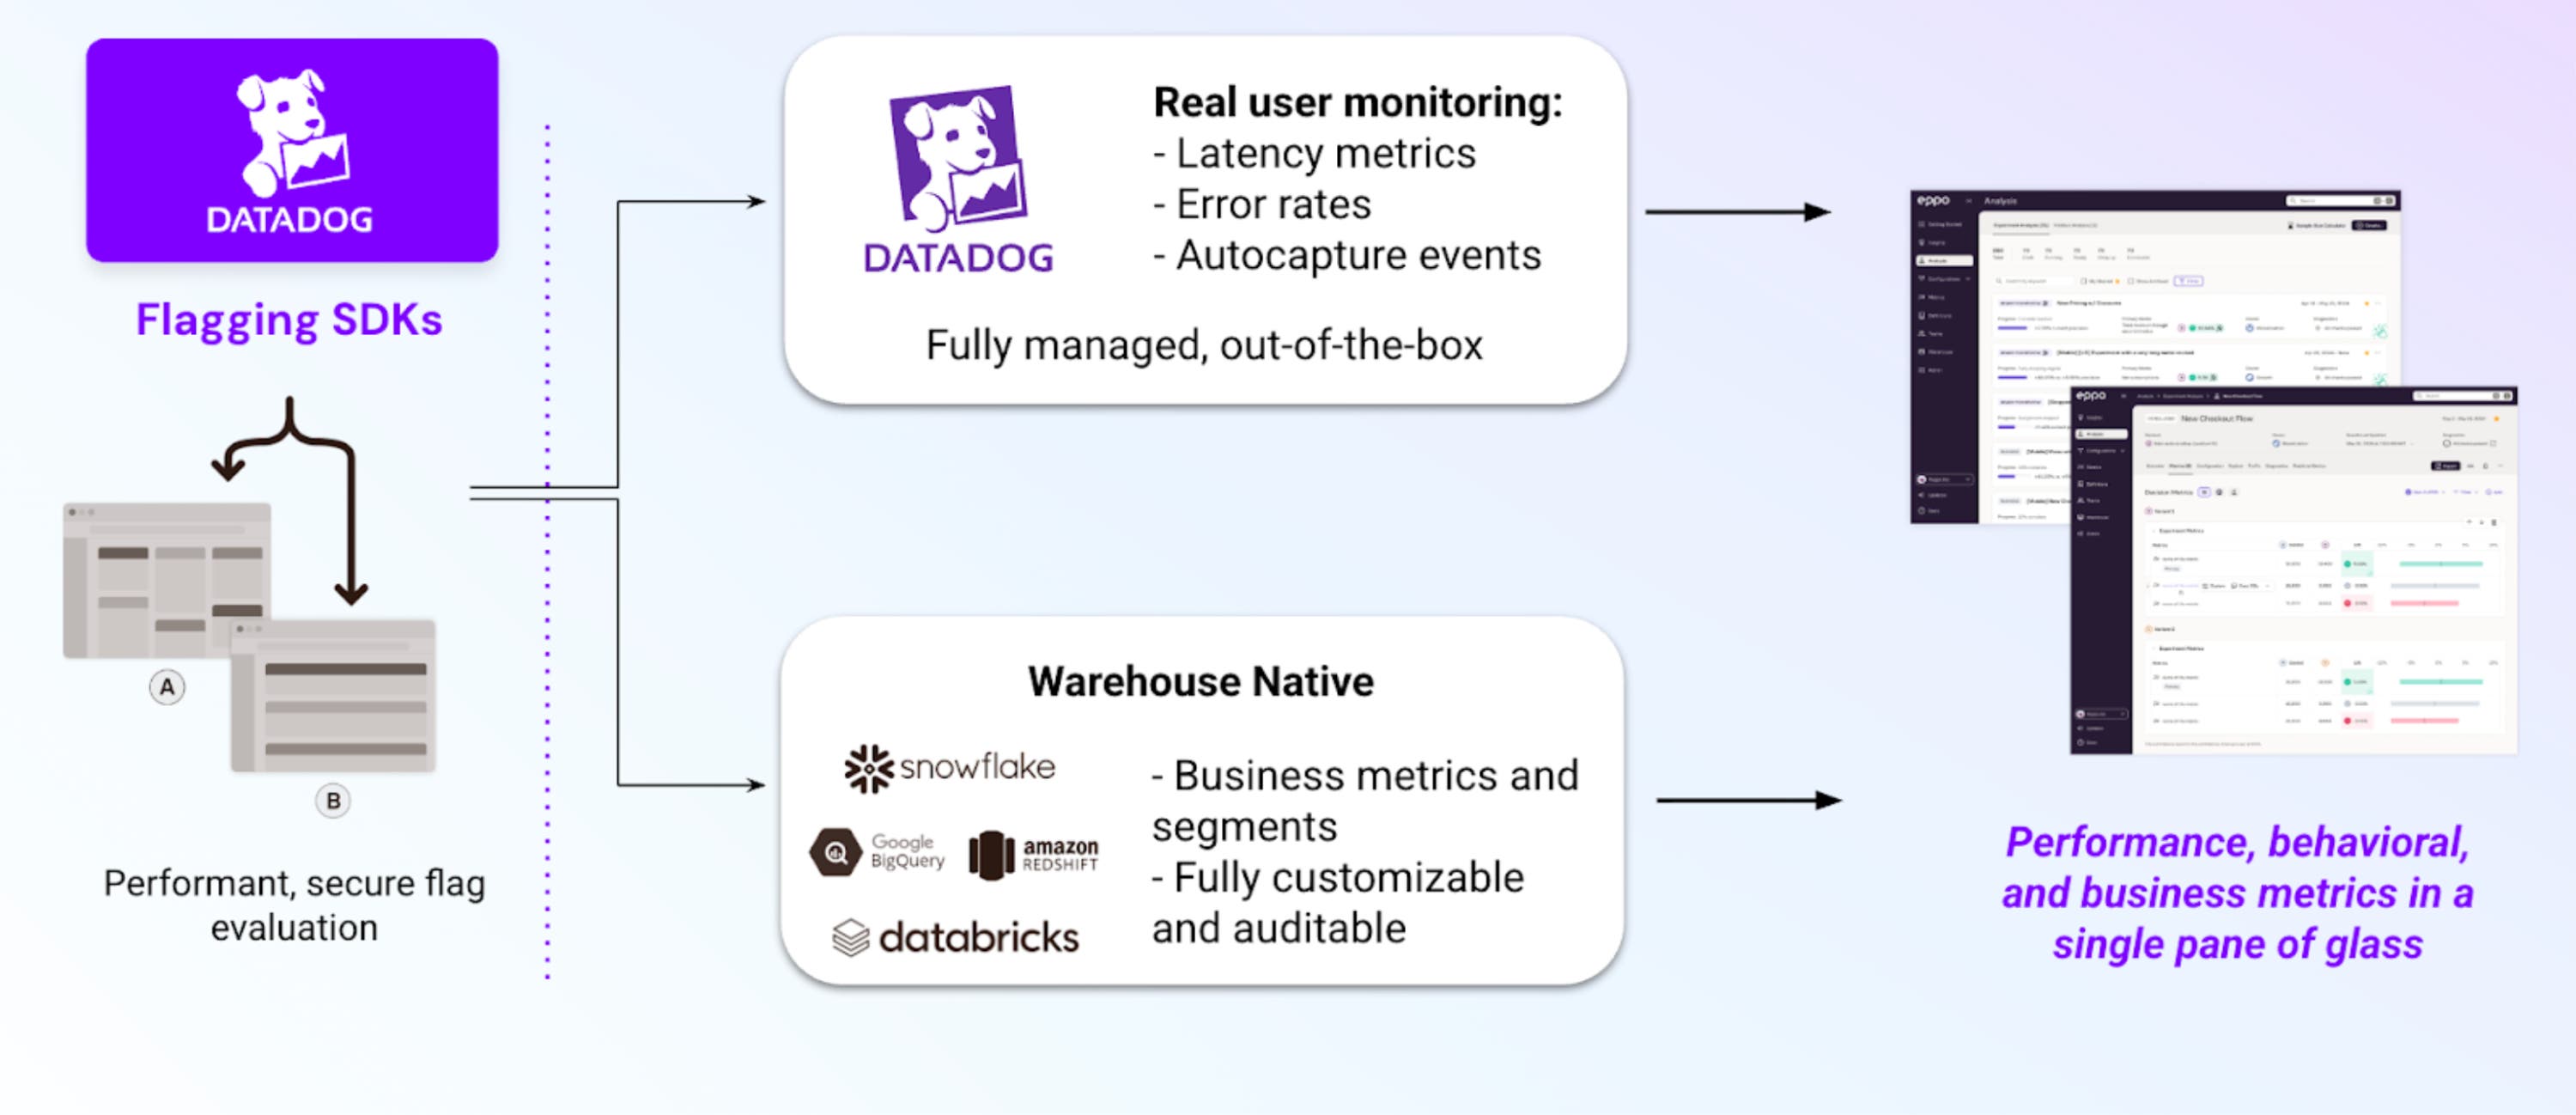
Datadog brings event stream and transactional data into a single platform, helping you design robust experiments and deeply analyze the results. Datadog fully manages event stream data out of the box with the Datadog Browser SDK, enabling you to measure data such as availability and performance metrics, error rates, button clicks, or pageviews. Additionally, you can easily add custom data as needed by creating a call to datadogRum.addAction. As a result, you can analyze performance and behavioral changes quickly with no technical overhead.
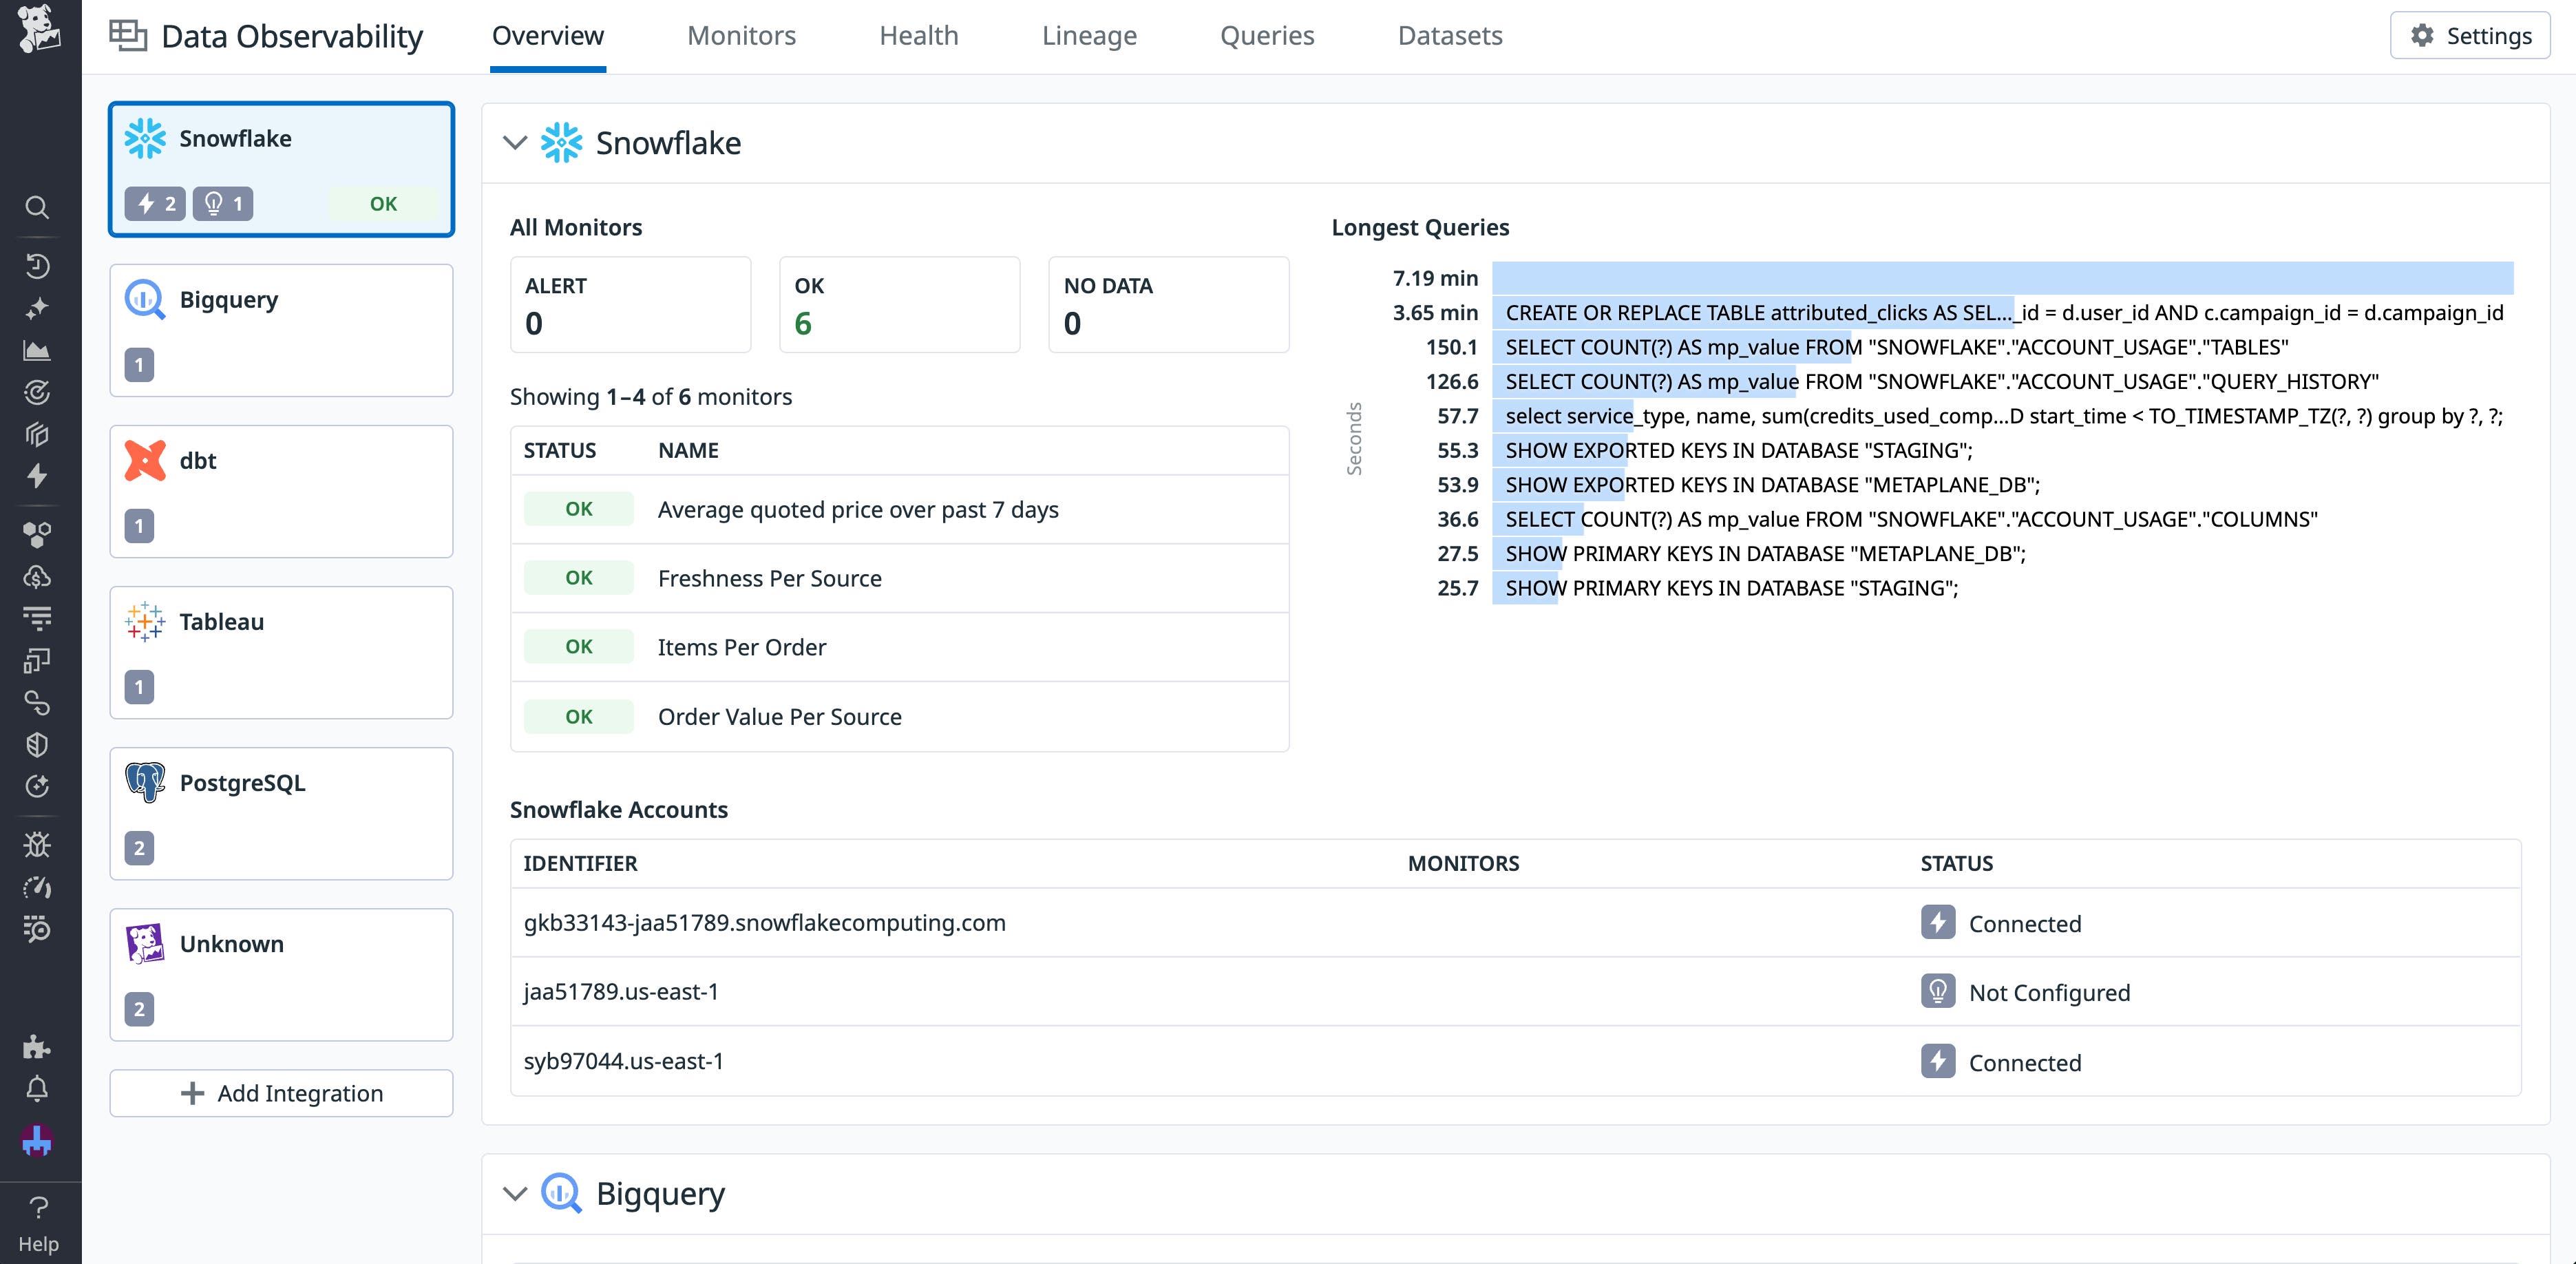
For transactional datasets, Datadog uses your existing data warehouses as a source of truth for business data thanks to a warehouse-native architecture. First, Datadog can help you ensure that your data warehouse sources are healthy through Data Observability, giving teams confidence in the reliability of the experiment results.

You can then analyze and visualize this data with our more than 1,000 integrations. Once you’ve done so, you can visualize information from these datasets side by side with your OOTB event stream metrics. All this happens without egressing any user-level data, eliminating security risks while ensuring that the latest definitions are always used.

This dual-path approach means that teams get both real-time observability for time-sensitive investigations and deep warehouse-certified insights when precision matters. As a result, PMs, designers, and engineers can transition between detailed analyses of performance and behavioral changes and reliable assessments of business impact to help them confidently make decisions based on their experiments.
Visualize all your experimental data for deep insights
Bridging observability, product analytics, and data warehouses is critical for designing and interpreting effective experiments. Doing so helps teams unlock richer insights, reduce silos, and build confidence in their decisions.
You can access experiments in the Datadog platform with Datadog Feature Flags. Soon, you’ll also be able to construct robust experiments and perform detailed analyses of your results directly within Datadog Experiments. To learn about our existing capabilities, view our Feature Flag documentation. Or, if you’re new to Datadog, you can sign up for a 14-day free trial.


