Quentin Francois
At Datadog, our data pipelines process trillions of data points every day to power core product features like long-term metrics queries. As data engineers, ensuring that data pipelines deliver good data in time at such a large scale is challenging. In this post, we’ll cover our best practices to guarantee the reliability of our data pipelines.
“Reliability is the probability that a system will produce correct outputs up to some given time”
According to the above definition of reliability, a highly reliable pipeline doesn’t have to mean that the pipeline never fails. If you’ve got a data pipeline that’s supposed to produce some data every day, and this pipeline crashes a few times while still delivering the data in time, that’s still a reliable pipeline. That doesn’t mean there’s no issue—it probably isn’t normal that a pipeline crashes several times a day—but it’s reliable, because the data is delivered consistently and on time.
There are a few things to consider when designing a pipeline. They’re going to fail eventually, so they should be fault tolerant. You’ll need good monitoring in place, so you can detect unexpected failures early, and make sure you’re prepared to deal with failures when they happen in order to recover fast.
Starting with architecture
While all of our live data is streamed, aggregated, post-processed, and analyzed in real-time, we operate a number of batch processes to power other features, including optimized long-term data storage.
Here’s a simplified view of Datadog’s architecture for these batch processes:
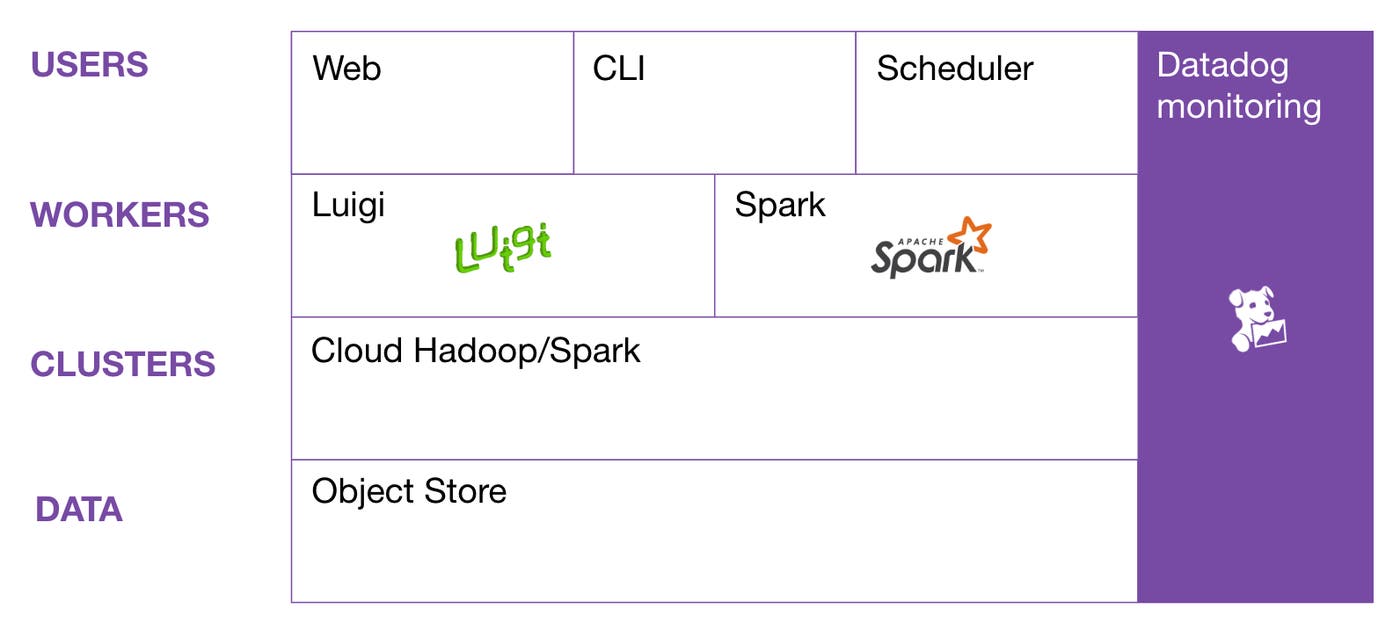
We use an object store for all our historical data. On top of that, you have the clusters we use to run our Spark data pipelines. We use cloud Hadoop/Spark services for launching and configuring our clusters. Then, we have two types of workers: Luigi workers, for task and workflow management; and Spark workers, for compiling code and sending it to the appropriate cluster. Finally, the user has several ways of launching jobs: the web interface, the command line, and the job scheduler.
Clusters
When we talk about architecting data pipelines, we want to talk about clusters. In a lot of companies, you have a single giant Hadoop cluster on which people run all their jobs. At Datadog, instead of having everyone compete for resources on a giant cluster, each of our data pipelines runs on its own cluster.
At peak, we have dozens of clusters running, but most of them have a short lifespan—about three hours on average. This architecture has a few advantages over using one giant cluster:
- We get total isolation between jobs, since they run on separate clusters: they don’t interfere with each other, and it makes monitoring much easier—we’ll know exactly what’s happening on each cluster, and why.
- We can also tune the cluster size and hardware for each job. Some instances are CPU-optimized, while other instances are memory-optimized. So if one job is CPU intensive, we may use a CPU-optimized instance—but if the job is more memory intensive, we might use a memory-optimized instance.
- We can easily scale clusters up and down. This is useful when we’re behind schedule, and we want to catch up, or when we need to scale up as our data volume grows. With a single giant cluster, people often have to wait for resources to free up, but with dozens of clusters, there’s no more waiting on loaded clusters: data scientists, data analysts, and data engineers can just start new clusters and run their jobs there.
- We can also easily upgrade our versions of Hadoop/Spark. Upgrading to newer versions is usually a pain because things get deprecated or new bugs are introduced. Having different clusters for each job lets us do gradual upgrades.
Spot instances
We use multiple cloud providers, but when running in AWS, we sometimes run our clusters on spot instances. If you’re not familiar with spot instances, here’s a quick explanation.
In order to ensure on-demand resources for their users, Amazon needs to have a lot of excess servers. Most of the time, these excess servers are unused, so they make them available at discounts on the spot market. You can get ridiculous savings using spot instances, up to 80% off the on-demand price—but the downside is your clusters can disappear at any time depending on supply and demand. It’s like having chaos monkeys randomly killing nodes in your clusters.
Now, you might be wondering how we can build highly reliable data pipelines with clusters that can fail at any time. But this isn’t a bad thing: it actually forces us to design our data pipelines in ways that make them more fault tolerant.
Broadly: don’t have long running jobs. The longer the job, the more work you lose when you have a cluster problem, and the longer it takes to recover from a failed job. To avoid long jobs, we break them into smaller pieces:
-
Vertically by separating the transformations into multiple jobs that persist intermediate data in S3.
-
Horizontally by partitioning input data and running multiple jobs to process the whole thing, instead of doing it all in a single job.
Let’s look at the example of one of our most critical data pipeline, the rollup pipeline, in charge of producing aggregated timeseries data used in historical metrics queries.

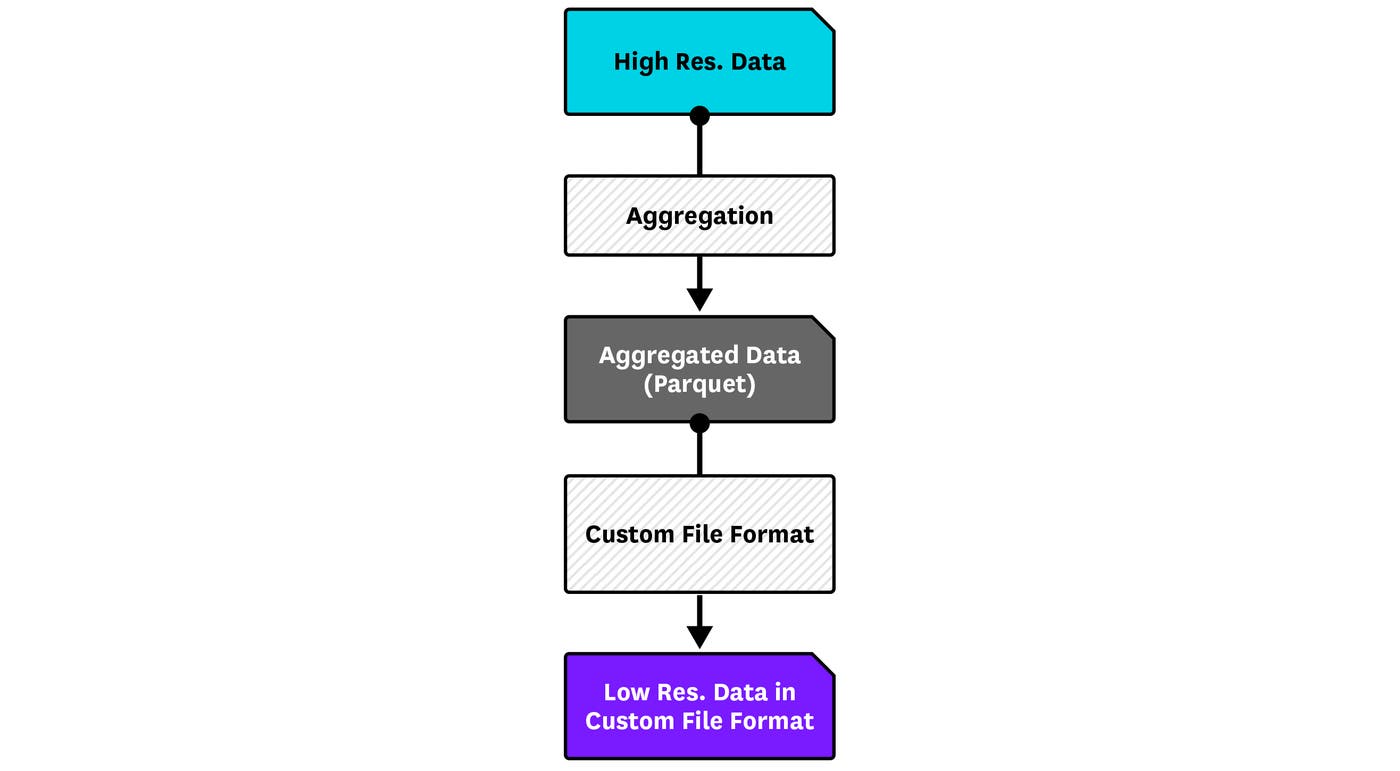
If we were running this in a single job, it would take more than 14 hours, and it’d be very hard and expensive to recover from cluster failures. Instead, we split the pipeline in two steps: aggregate the high resolution data, and then store the low resolution data in a custom file format, which is optimized for queries. The first job does the aggregation and checkpoints the data in S3 as Parquet files, and the second job writes out the data into that custom format:
This wasn’t enough, though: these two jobs were still fairly big, and kept getting bigger as we grew. So we broke up the jobs horizontally as well. The input data comes from Kafka, so it follows the Kafka partitioning scheme. We defined shards: each shard is basically a group of Kafka partitions. We can then increase or decrease the number of shards processed by each job, and even isolate big or sensitive shards to their own job.
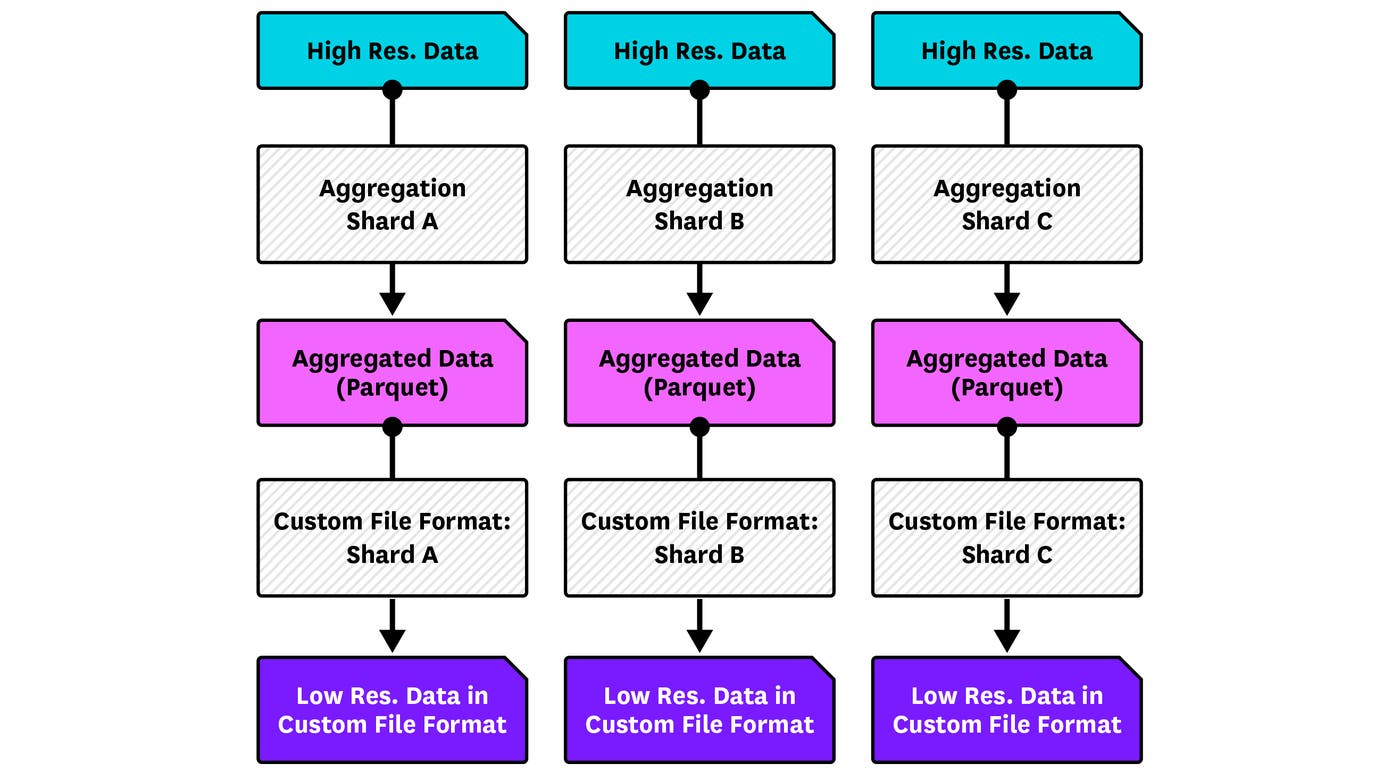
Of course, this strategy has a cost in terms of performance: launching jobs has some overhead, and checkpointing data to S3 takes more time than caching it locally on the cluster. There will always be a trade-off between performance and fault tolerance.
Monitoring
We’ve seen how to architect our jobs in a way that makes them more tolerant to failures, but problems will still happen. We also need to have good monitoring in place to detect failures early, so we can take actions before the issues actually impact downstream users of the output of our data pipelines.
As we’ve seen before, jobs are running on separate clusters, so that they are totally isolated from each other. We install the Datadog Agent on all of the nodes in our clusters in order to report all kinds of metrics, but these metrics are only useful if we can visualize them cluster-by-cluster. We do this by tagging our clusters. The tags are sent to EMR when starting up the clusters, and the Datadog Agent pulls up these tags and attaches them to all the metrics that it reports. In Datadog, we can use these tags to filter metrics for a given cluster, and see what’s going on in that cluster.
Tagging is also useful in giving us a permanent view of a cluster in Datadog. Even though the actual underlying EMR cluster changes every day, we keep the same tag for a given job.
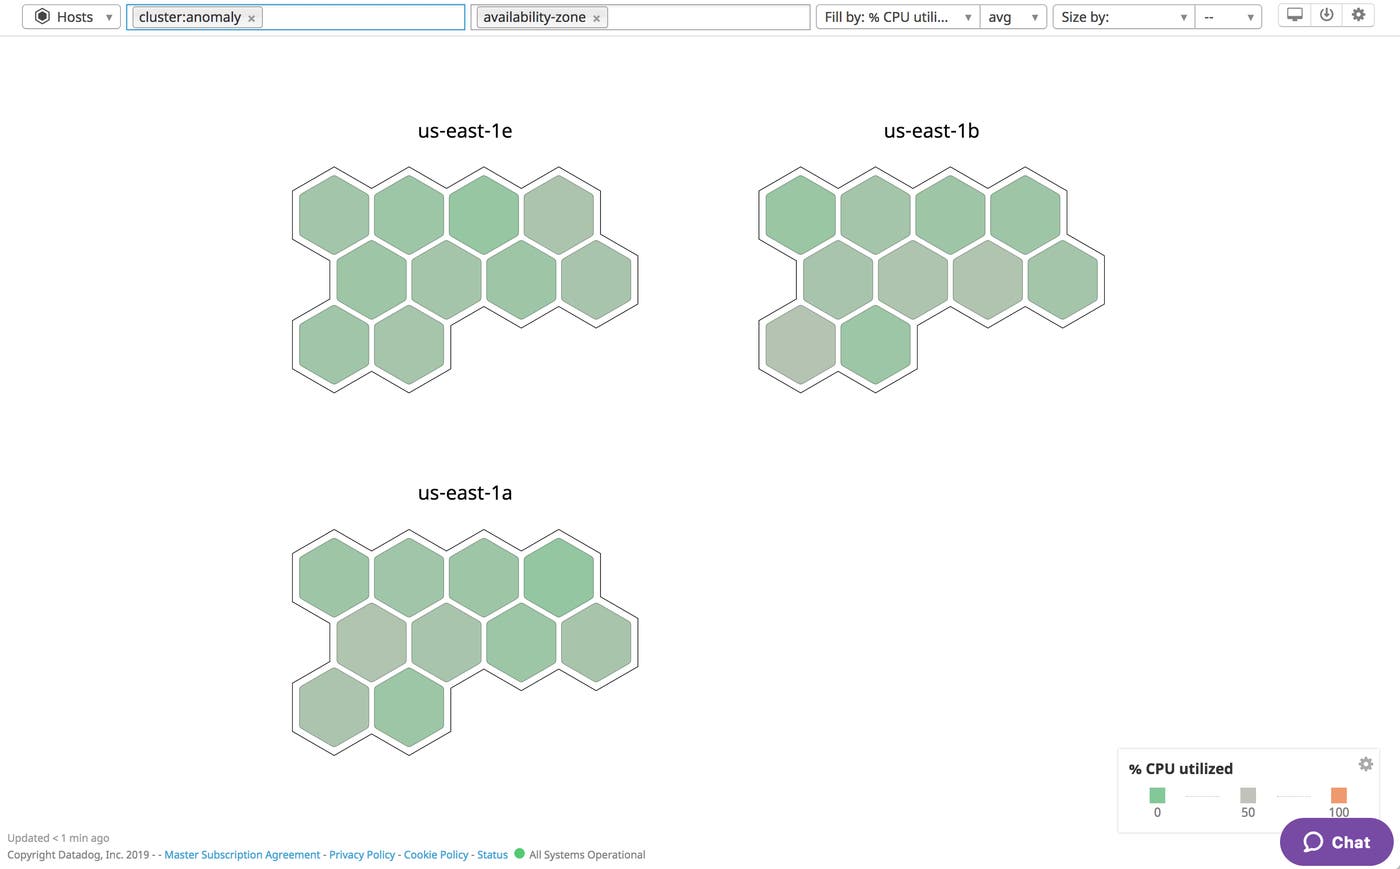
The Datadog Agent lets us collect 3 types of metrics to give us a complete view of the health of our data pipelines and their underlying clusters:
System metrics
System metrics help us monitor the health of our clusters. We mostly care about disk usage and memory usage as they’re a main source of failures that usually happen.
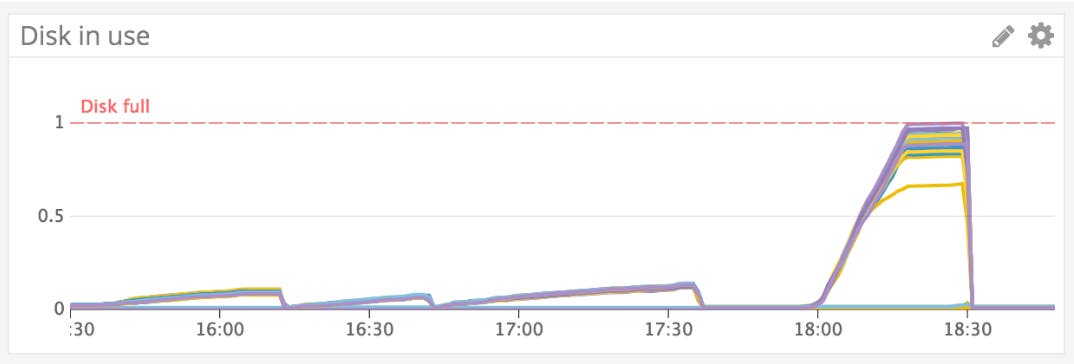
This graph shows the percentage of disk used by a node on a given cluster. The first three jobs are running fine, they have plenty of room—but the last job is eating up a lot more disk, and some nodes have run out of disk space. So we can tell that this job has failed. We set up alerts for when our jobs are running out of disk, which means that we may need to add more nodes to the cluster.
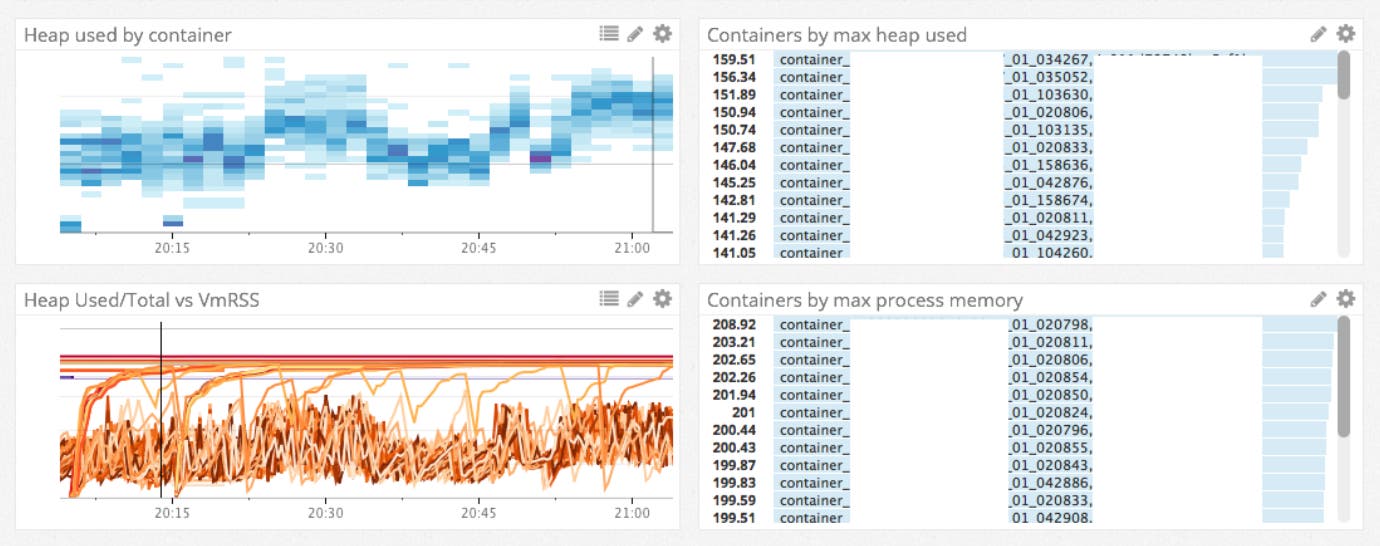
Meanwhile, memory usage is a tricky thing to manage in Spark, and lots of failures are due to a shortage of memory. The Agent can report memory metrics by executor in the heatmap. The graph above shows the maximum memory usage by executor. Some executors are reaching the limits and then suddenly dropping, because they’re running out of memory.
Job metrics
Datadog has an integration with Spark that lets us collect all sorts of metrics. One of the most useful metrics is the number of failed tasks: Spark usually retries failed tasks, but we’ve seen situations where failures keep happening, and the job can get stuck. So, we have an alert set on the number of failed tasks. We also report some custom internal metrics throughout the jobs. We send distinct metrics in each key stage of the pipeline. These metrics are especially useful to detect where issues happen in the job.
Data latency metrics
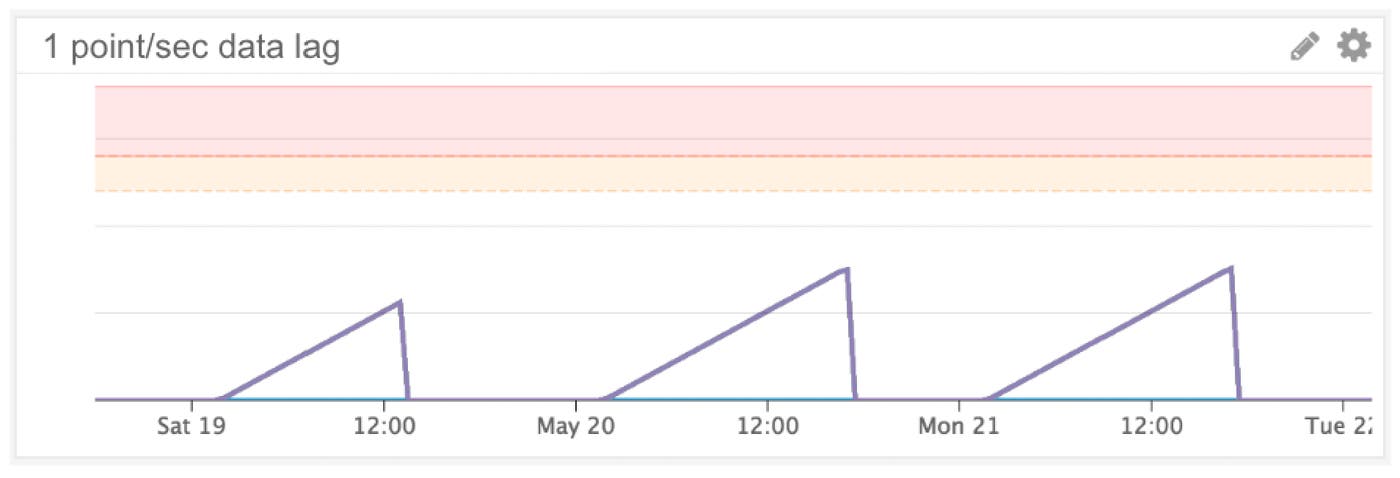
Reliability means that some data needs to be ready before a certain deadline. How do we know if our jobs are behind? We have a task that is scheduled to run every five minutes. This task checks the output data in S3 and reports lag metrics to Datadog: it says when the data in S3 was last updated. These metrics tell us whether the job is behind and whether we need to scale up the cluster.
Handling failures
Be prepared for failures. First, consider the kind of failures you can expect:
- Delayed or corrupted input data
- Data volume growth causing performance issues
- Hardware failures and spot instances instability
- Bad code changes
When these failures occur, we need to react with two goals in mind:
Recover quickly
There are a few ways to accomplish a quick recovery. Break jobs into small pieces: hardware failure will then only impact a small portion of the job, so it’ll be faster to replay and recover. If failures are due to the spot market, switching from spot to on-demand clusters improves availability—but, of course, this has a cost. Cluster size can be increased in order to finish the job faster. You should also establish easy ways to rerun jobs.
Limit customer-facing impact
Even if we have good monitoring in place and ways to recover from failures, our pipelines sometimes don’t finish before the deadline. The customer-facing impact of job delays is often minimal for two reasons. First, thanks to horizontal sharding, issues are isolated to the few customers being processed in the delayed shard(s). Second, we have ways to keep the service operational at the cost of slightly degraded performance. In the example of the metrics aggregation pipeline, the query system would use raw data to perform queries instead of being able to use pre-aggregated data if the pipeline is delayed—queries might get a bit slower, but customers will still be able to see data on their dashboards.
Conclusion
Remember that reliability is a matter of time constraints: you need to agree on the latency requirements with the downstream users of your data pipelines. The latency requirements will determine how much effort you’ll have to spend to make your pipeline highly reliable.
Making sure that data pipelines deliver good data on time, i.e. meeting the latency agreements, is part of our mission as data engineers. Throughout this post, we covered several best practices which, we hope, will help you to build more reliable data pipelines:
- Break down jobs into small, survivable pieces to reduce lost work in the event of failures.
- Monitor cluster metrics, job metrics, and data latencies metrics to detect failures early.
- Think about failures ahead of time and get prepared to recover fast from failures.

