
Evan Mouzakitis
This post is part 3 of a 4-part series on monitoring Hadoop health and performance. Part 1 gives a general overview of Hadoop's architecture and subcomponents, Part 2 dives into the key metrics to monitor, and Part 4 explains how to monitor a Hadoop deployment with Datadog.
If you’ve already read our guide to key Hadoop performance metrics, you’ve seen that Hadoop provides a vast array of metrics on job execution performance, health, and resource utilization.
In this post we'll step through several different ways to access those metrics. We'll show you how to collect metrics from core Hadoop components (HDFS, MapReduce, YARN), as well as from ZooKeeper, using standard development tools as well as specialized tools like Apache Ambari and Cloudera Manager.
Collecting HDFS metrics
HDFS emits metrics from two sources, the NameNode and the DataNodes, and for the most part each metric type must be collected at the point of origination. Both the NameNode and DataNodes emit metrics over an HTTP interface as well as via JMX.
NameNode HTTP API
The NameNode offers a summary of health and performance metrics through an easy-to-use web UI. By default, the UI is accessible via port 50070, so point a web browser at: http://<namenodehost>:50070
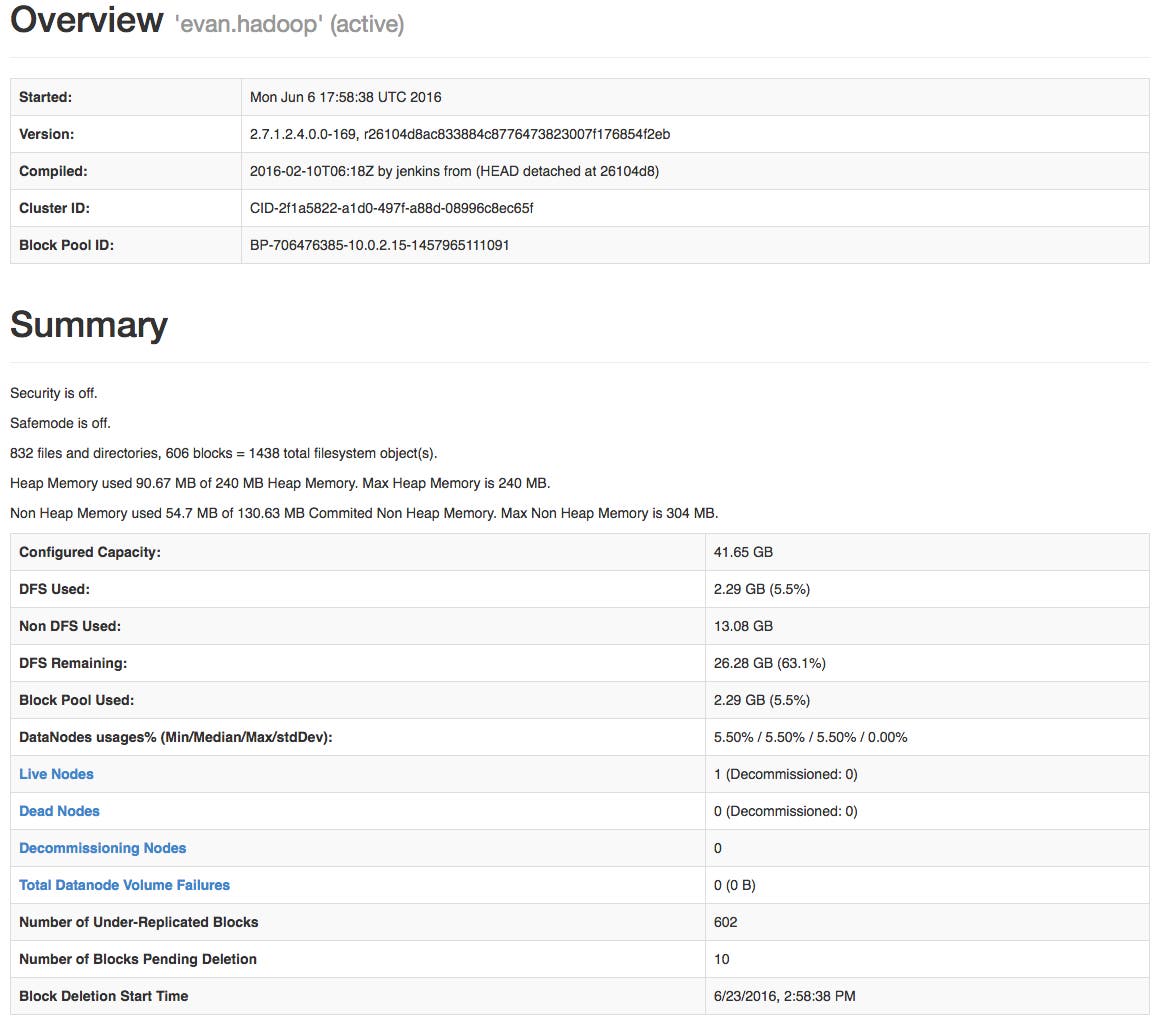
While a summary is good to have, it is likely you will want to drill deeper into the metrics mentioned in part two of this series; to see all the metrics, point your browser to http://<namenodehost>:50070/jmx, which will result in JSON output like this:
{ "beans" : [ { "name" : "java.lang:type=Memory", "modelerType" : "sun.management.MemoryImpl", "ObjectPendingFinalizationCount" : 0, "HeapMemoryUsage" : { "committed" : 241172480, "init" : 262144000, "max" : 241172480, "used" : 110505832 }, "NonHeapMemoryUsage" : { "committed" : 136773632, "init" : 136773632, "max" : 318767104, "used" : 35047040 }, "Verbose" : true, "ObjectName" : "java.lang:type=Memory" }, { "name" : "java.lang:type=GarbageCollector,name=ConcurrentMarkSweep", "modelerType" : "sun.management.GarbageCollectorImpl", "LastGcInfo" : null, "CollectionCount" : 0, "CollectionTime" : 0, "Valid" : true, "MemoryPoolNames" : [ "Par Eden Space", "Par Survivor Space", "CMS Old Gen", "CMS Perm Gen" ], "Name" : "ConcurrentMarkSweep", "ObjectName" : "java.lang:type=GarbageCollector,name=ConcurrentMarkSweep" }, { "name" : "java.nio:type=BufferPool,name=mapped", "modelerType" : "sun.management.ManagementFactoryHelper$1", "TotalCapacity" : 2144, "MemoryUsed" : 2144, "Name" : "mapped", "Count" : 1, "ObjectName" : "java.nio:type=BufferPool,name=mapped" }, { "name" : "java.lang:type=Compilation", "modelerType" : "sun.management.CompilationImpl", "CompilationTimeMonitoringSupported" : true, "TotalCompilationTime" : 9808, "Name" : "HotSpot 64-Bit Tiered Compilers", "ObjectName" : "java.lang:type=Compilation" }, { "name" : "java.lang:type=MemoryPool,name=Par Eden Space", "modelerType" : "sun.management.MemoryPoolImpl", "Valid" : true, "Usage" : { "committed" : 167772160, "init" : 167772160, "max" : 167772160, "used" : 95843104 }, "PeakUsage" : { "committed" : 167772160, "init" : 167772160, "max" : 167772160, "used" : 167772160 }, [...]You can also filter by specific MBeans, like so:
http://<namenodehost>:50070/jmx?qry=java.lang:type=Memory{ "beans" : [ { "name" : "java.lang:type=Memory", "modelerType" : "sun.management.MemoryImpl", "Verbose" : true, "ObjectPendingFinalizationCount" : 0, "HeapMemoryUsage" : { "committed" : 251658240, "init" : 262144000, "max" : 251658240, "used" : 86238032 }, "NonHeapMemoryUsage" : { "committed" : 137166848, "init" : 136773632, "max" : 318767104, "used" : 57894936 }, "ObjectName" : "java.lang:type=Memory" } ] }Whether you use the API or JMX, most of the NameNode metrics from part two of this series can be found under the MBean Hadoop:name=FSNamesystem,service=NameNode. VolumeFailuresTotal, NumLiveDataNodes, NumDeadDataNodes, NumLiveDecomDataNodes, NumStaleDataNodes can be found under the MBean Hadoop:name=FSNamesystemState,service=NameNode.
DataNode HTTP API
A high-level overview of the health of your DataNodes is available in the NameNode dashboard, under the Datanodes tab (http://localhost:50070/dfshealth.html#tab-datanode).
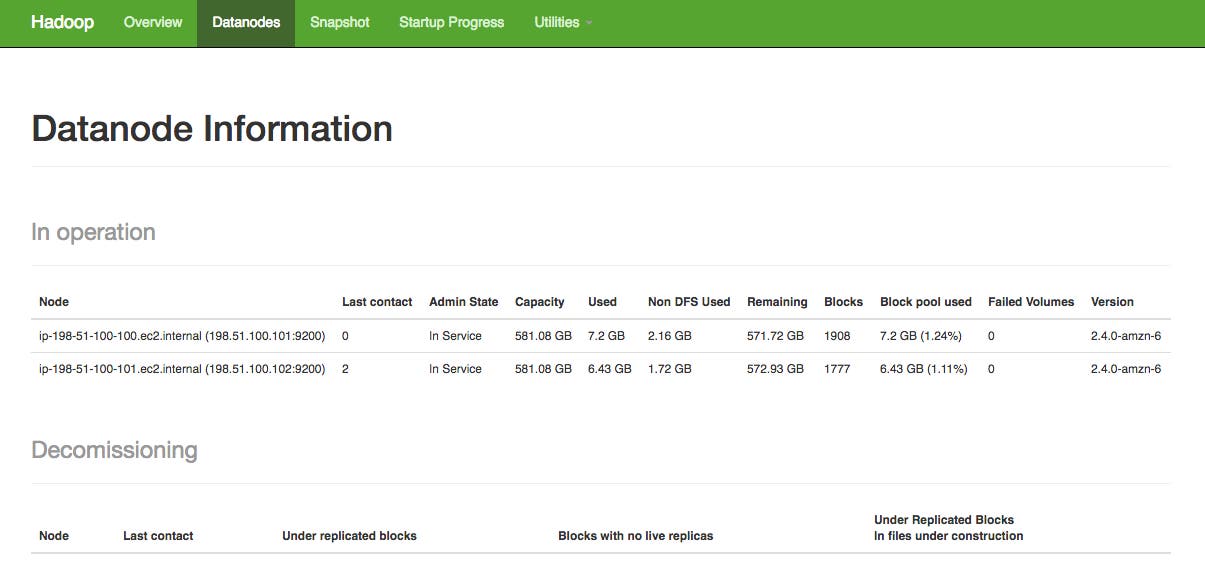
To get a more detailed view of an individual DataNode, you can access its metrics through the DataNode API.
By default, DataNodes expose all of their metrics on port 50075, via the jmx endpoint. Hitting this endpoint on your DataNode with your browser or curl gives you all of the metrics from part two of this series, and then some:
$ curl http://<datanodehost>:50075/jmx { "name" : "Hadoop:service=DataNode,name=DataNodeActivity-evan.hadoop", "modelerType" : "DataNodeActivity-evan.hadoop", "tag.SessionId" : null, "tag.Context" : "dfs", "tag.Hostname" : "evan.hadoop", "BytesWritten" : 387072, "TotalWriteTime" : 0, "BytesRead" : 0, "TotalReadTime" : 0, "BlocksWritten" : 0, "BlocksRead" : 0, "BlocksReplicated" : 0, "BlocksRemoved" : 0, "BlocksVerified" : 0, "VolumeFailures" : 0, [...]To retrieve all of the the metrics detailed in part two (and only those metrics), use this query:
$ curl http://<datanodehost>:50075/jmx?qry=Hadoop:name=FSDatasetState,service=DataNode { "beans" : [ { "name" : "Hadoop:service=DataNode,name=FSDatasetState", "modelerType" : "FSDatasetState", "tag.Context" : "FSDatasetState", "tag.StorageInfo" : "FSDataset{dirpath='[/hadoop/hdfs/data/current]'}", "tag.Hostname" : "sandbox.hortonworks.com", "Capacity" : 44716605440, "DfsUsed" : 1870278656, "Remaining" : 28905246720, "NumFailedVolumes" : 0, "LastVolumeFailureDate" : 0, "EstimatedCapacityLostTotal" : 0, "CacheUsed" : 0, "CacheCapacity" : 0, "NumBlocksCached" : 0, "NumBlocksFailedToCache" : 0, "NumBlocksFailedToUnCache" : 0 } ] }NameNode and DataNode metrics via JMX
Like Kafka, Cassandra, and other Java-based systems, both the NameNode and DataNodes also exposes metrics via JMX.
The JMX remote agent interfaces are disabled by default; to enable them, set the following JVM options in hadoop-env.sh (usually found in $HADOOP_HOME/conf):
export HADOOP_NAMENODE_OPTS="-Dcom.sun.management.jmxremote -Dcom.sun.management.jmxremote.password.file=$HADOOP_HOME/conf/jmxremote.password -Dcom.sun.management.jmxremote.ssl=false -Dcom.sun.management.jmxremote.port=8004 $HADOOP_NAMENODE_OPTS" export HADOOP_DATANODE_OPTS="-Dcom.sun.management.jmxremote -Dcom.sun.management.jmxremote.password.file=$HADOOP_HOME/conf/jmxremote.password -Dcom.sun.management.jmxremote.ssl=false -Dcom.sun.management.jmxremote.port=8008 $HADOOP_DATANODE_OPTS"These settings will open port 8004 on the NameNode and 8008 on the DataNode, with password authentication enabled (see "To Set up a Single-User Environment" here for more information on configuring the JMX remote agent).
Once enabled, you can connect using any JMX console, like JConsole or Jmxterm. The following shows a Jmxterm connection to the NameNode, first listing available MBeans, and then drilling into the Hadoop:name=FSNamesystem,service=NameNode MBean:
[hadoop@evan.hadoop conf]# java -jar /opt/datadog-agent/agent/checks/libs/jmxterm-1.0-DATADOG-uber.jar --url localhost:8004 Welcome to JMX terminal. Type "help" for available commands. $>beans #domain = Hadoop: Hadoop:name=BlockStats,service=NameNode Hadoop:name=FSNamesystem,service=NameNode Hadoop:name=FSNamesystemState,service=NameNode Hadoop:name=JvmMetrics,service=NameNode Hadoop:name=MetricsSystem,service=NameNode,sub=Control Hadoop:name=MetricsSystem,service=NameNode,sub=Stats [...] $>bean Hadoop:name=FSNamesystem,service=NameNode $>info #mbean = Hadoop:name=FSNamesystem,service=NameNode #class name = FSNamesystem # attributes %0 - BlockCapacity (java.lang.Integer, r) %1 - BlocksTotal (java.lang.Long, r) %2 - CapacityRemaining (java.lang.Long, r) %3 - CapacityRemainingGB (java.lang.Float, r) %4 - CapacityTotal (java.lang.Long, r) %5 - CapacityTotalGB (java.lang.Float, r) %6 - CapacityUsed (java.lang.Long, r) %7 - CapacityUsedGB (java.lang.Float, r) %8 - CapacityUsedNonDFS (java.lang.Long, r) [...] $>get BlocksTotal #mbean = Hadoop:name=FSNamesystem,service=NameNode: BlocksTotal = 695;Once you've enabled JMX, connecting to DataNodes is the same as with the NameNode, with a different port (8008) and MBean (Hadoop:name=FSDatasetState,service=DataNode):
[hadoop@evan.hadoop conf]# java -jar /opt/datadog-agent/agent/checks/libs/jmxterm-1.0-DATADOG-uber.jar --url localhost:8008 Welcome to JMX terminal. Type "help" for available commands. $>bean Hadoop:name=FSDatasetState,service=DataNode #bean is set to Hadoop:name=FSDatasetState,service=DataNode $>info #mbean = Hadoop:name=FSDatasetState,service=DataNode #class name = FSDatasetState # attributes %0 - CacheCapacity (java.lang.Long, r) %1 - CacheUsed (java.lang.Long, r) %2 - Capacity (java.lang.Long, r) %3 - DfsUsed (java.lang.Long, r) %4 - EstimatedCapacityLostTotal (java.lang.Long, r) %5 - LastVolumeFailureDate (java.lang.Long, r) %6 - NumBlocksCached (java.lang.Long, r) %7 - NumBlocksFailedToCache (java.lang.Long, r) %8 - NumBlocksFailedToUnCache (java.lang.Long, r) %9 - NumFailedVolumes (java.lang.Integer, r) %10 - Remaining (java.lang.Long, r) %11 - tag.Context (java.lang.String, r) %12 - tag.Hostname (java.lang.String, r) %13 - tag.StorageInfo (java.lang.String, r) $>get NumFailedVolumes #mbean = Hadoop:name=FSDatasetState,service=DataNode: NumFailedVolumes = 0;Collecting MapReduce counters
MapReduce counters provide information on MapReduce task execution, like CPU time and memory used. They are dumped to the console when invoking Hadoop jobs from the command line, which is great for spot-checking as jobs run, but more detailed analysis requires monitoring counters over time.
The ResourceManager also exposes all MapReduce counters for each job. To access MapReduce counters on your ResourceManager, first navigate to the ResourceManager web UI at http://<resourcemanagerhost>:8088.
Find the application you're interested in, and click "History" in the Tracking UI column:
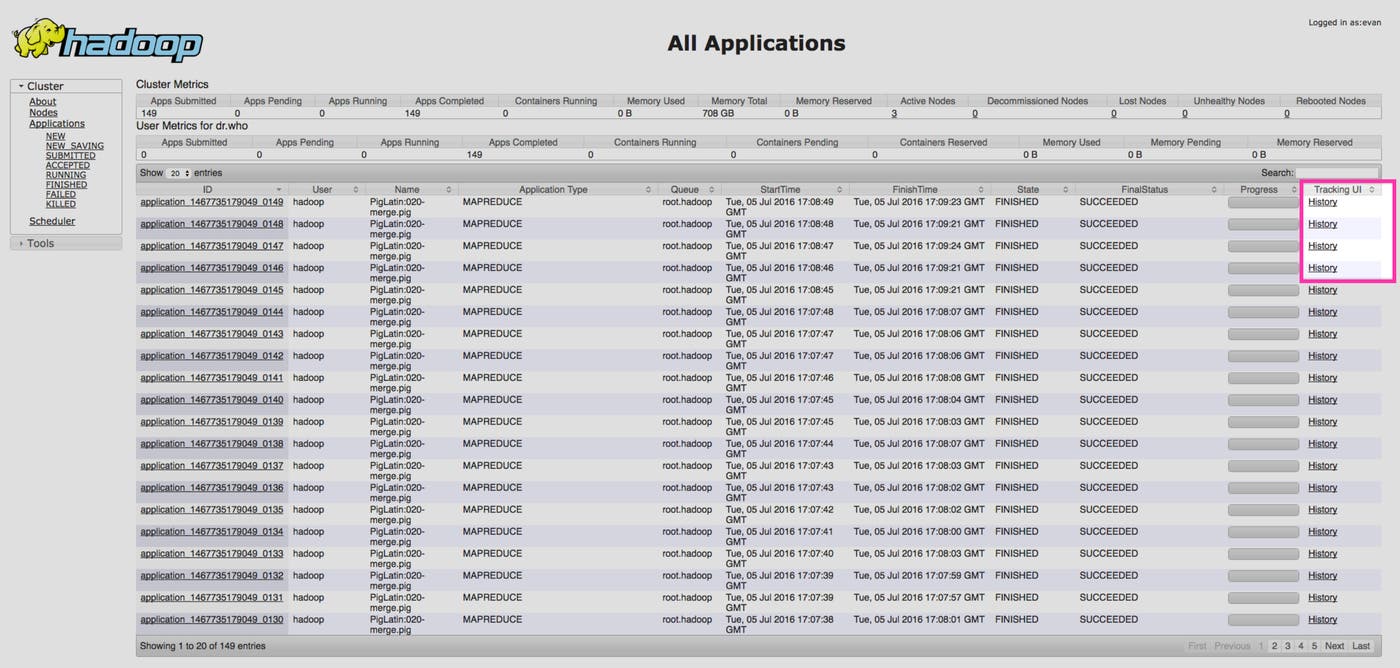

And finally, you should see all of the counters collected associated with your job:

Collecting Hadoop YARN metrics
Like HDFS metrics, YARN metrics are also exposed via an HTTP API.
YARN HTTP API
By default, YARN exposes all of its metrics on port 8088, via the jmx endpoint. Hitting this API endpoint on your ResourceManager gives you all of the metrics from part two of this series, and more:
$ curl http://localhost:8088/jmx{ "beans" : [{ "name" : "Hadoop:service=ResourceManager,name=QueueMetrics,q0=root", "AppsSubmitted" : 10, "AppsRunning" : 5, "AppsPending" : 4, "AppsCompleted" : 0, "AppsKilled" : 0, "AppsFailed" : 1, "AllocatedMB" : 2250, "AllocatedVCores" : 9, "AllocatedContainers" : 9, "AvailableMB" : 0, "AvailableVCores" : 2, "PendingMB" : 1250, "PendingVCores" : 5, "PendingContainers" : 5, "ReservedMB" : 0, "ReservedVCores" : 0, "ReservedContainers" : 0, "ActiveUsers" : 0, "ActiveApplications" : 5 }{ "name" : "Hadoop:service=ResourceManager,name=JvmMetrics", "MemNonHeapUsedM" : 65.38923, "MemNonHeapCommittedM" : 65.9375, "MemNonHeapMaxM" : 214.0, "MemHeapUsedM" : 63.52308, "MemHeapCommittedM" : 148.5, "MemHeapMaxM" : 222.5, "MemMaxM" : 222.5, "GcCount" : 31, "GcTimeMillis" : 3987, [...]And as with HDFS, when querying the JMX endpoint you can specify MBeans with the qry parameter:
$ curl <resourcemanagerhost>:8088/jmx?qry=java.lang:type=MemoryTo get only the metrics from part two of the series, you can also query the ws/v1/cluster/metrics endpoint:
$ curl http://<resourcemanagerhost>:8088/ws/v1/cluster/metrics { "clusterMetrics": { "appsSubmitted": 10, "appsCompleted": 0, "appsPending": 4, "appsRunning": 5, "appsFailed": 1, "appsKilled": 0, "reservedMB": 0, "availableMB": 0, "allocatedMB": 2250, "reservedVirtualCores": 0, "availableVirtualCores": 2, "allocatedVirtualCores": 9, "containersAllocated": 9, "containersReserved": 0, "containersPending": 5, "totalMB": 2250, "totalVirtualCores": 8, "totalNodes": 1, "lostNodes": 0, "unhealthyNodes": 0, "decommissionedNodes": 0, "rebootedNodes": 0, "activeNodes": 1 } }Third-party tools
Native collection methods are useful for spot checking metrics in a pinch, but to see the big picture requires collecting and aggregating metrics from all your systems for correlation.
Two projects, Apache Ambari and Cloudera Manager, offer users a unified platform for Hadoop administration and management. These projects both provide tools for the collection and visualization of Hadoop metrics, as well as tools for common troubleshooting tasks.
Apache Ambari
The Apache Ambari project aims to make Hadoop cluster management easier by creating software for provisioning, managing, and monitoring Apache Hadoop clusters. It is a great tool not only for administering your cluster, but for monitoring, too.
Installation instructions for multiple platforms can be found here. Once installed, configure Ambari with
ambari-server setupMost users should be fine with the default configuration options, though you might want to change the Ambari user from the default root user. You should be aware, Ambari will install and use the PostgreSQL database package by default; if you already have your own database server installed, be sure to "Enter advanced database configuration" when prompted.
Once configured, start the server with:
service ambari-server startTo connect to the Ambari dashboard, point your browser to <AmbariHost>:8080 and login with the default user admin and password admin.
Once logged in, you should be met with a screen similar to the one below:
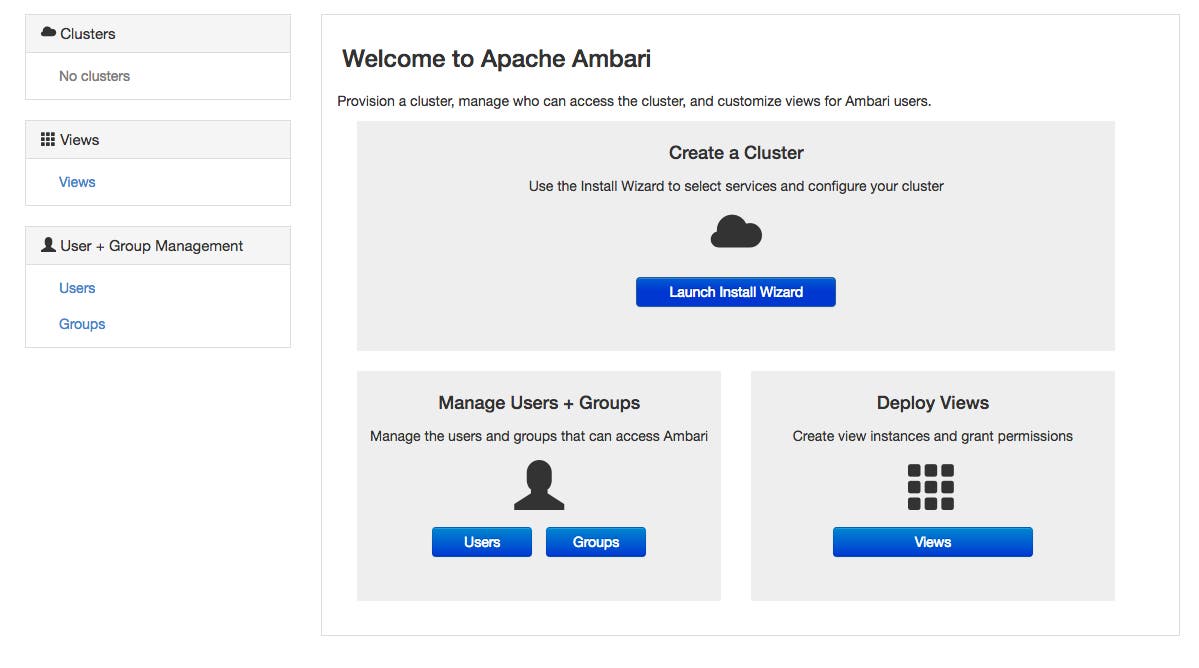
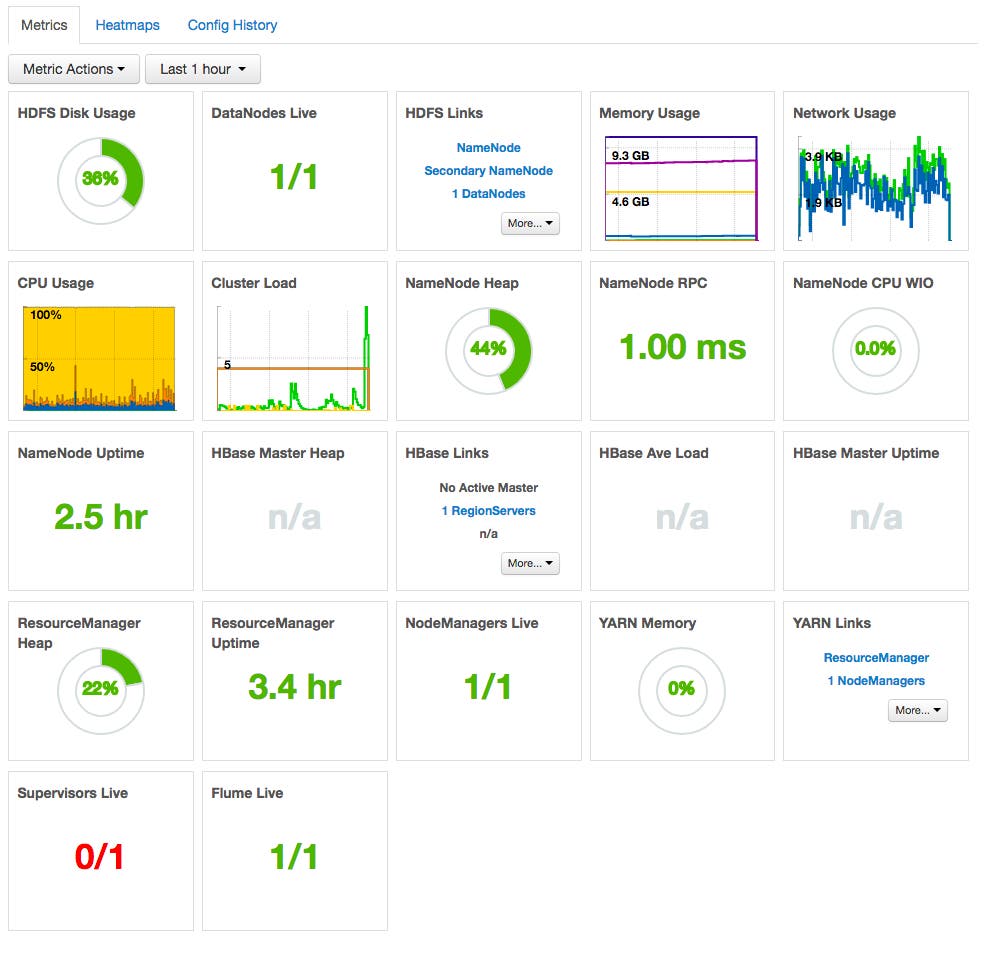
To get started, select "Launch Install Wizard". On the series of screens that follow, you will be prompted for hosts to be monitored and credentials to connect to each host in your cluster, then you'll be prompted to configure application-specific settings. Configuration details will be specific to your deployment and the services you use. Once you're all set up, you'll have a detailed dashboard like the one below, complete with health and performance information on your entire cluster, as well as links to connect to the web UIs for specific daemons like the NameNode and ResourceManager.
Cloudera Manager
Cloudera Manager is a cluster-management tool that ships as part of Cloudera's commercial Hadoop distribution and is also available as a free download.
Installation instructions for multiple platforms can be found here. Once you've downloaded and installed the installation packages, and set up a database for Cloudera Manager, start the server with:
service cloudera-scm-server startThen, continue installation of the Cloudera Manager through its webUI. To connect to the Cloudera Manager dashboard, point your browser to <ClouderaHost>:7180 and login with the default user admin and password admin.
Once logged in, complete the configuration steps on the next few screens.
On the series of screens that follow, you will be prompted for hosts to be monitored and credentials to connect to each host in your cluster, then you'll be prompted to configure application-specific settings. Configuration details will be specific to your deployment and the services you use. Once you're all set up, you'll have a customizable dashboard like the one below, complete with health and performance information on your entire cluster.

Collecting ZooKeeper metrics
There are several ways you can collect metrics from ZooKeeper. We will focus on the two most popular, JMX and the so-called "four-letter words". Though we won't go into it here, the zktop utility is also noteworthy for providing a useful top-like interface to ZooKeeper.
Using only the four-letter words, you can collect all of the native ZooKeeper metrics listed in part 2 of this series. JMX coverage is nearly as complete.
Collecting ZooKeeper metrics with Jmxterm
ZooKeeper randomizes its JMX port on each run, making it a bit more complex to connect to ZooKeeper with JMX tools. To set a static port for ZooKeeper's JMX metrics, make sure to add the following lines to your zkEnv.sh, usually located in /usr/share/zookeeper/bin (on *NIX):
-Dcom.sun.management.jmxremote -Dcom.sun.management.jmxremote.port=9999 -Dcom.sun.management.jmxremote.local.only=false -Dcom.sun.management.jmxremote.authenticate=false -Dcom.sun.management.jmxremote.ssl=false -Djava.rmi.server.hostname=<HOST IP>These settings will open up port 9999 for JMX connections, without authentication or SSL enabled (for simplicity). To enable password authentication, see "To Set up a Single-User Environment" here.
Using JMX with an MBean browser like JConsole or Jmxterm, you can collect all of the metrics listed in part 2 (except zk_followers, for which you'll need the four-letter words). Below is a walkthrough using Jmxterm:
Connect to ZooKeeper's JMX port
/usr/share/zookeeper/bin# java -jar /opt/datadog-agent/agent/checks/libs/jmxterm-1.0-DATADOG-uber.jar --url localhost:9999Switch to the org.apache.ZooKeeperService domain
$>domain org.apache.ZooKeeperService #domain is set to org.apache.ZooKeeperServiceList the beans and select the first MBean from the output
$>beans #domain = org.apache.ZooKeeperService: org.apache.ZooKeeperService:name0=StandaloneServer_port-1 org.apache.ZooKeeperService:name0=StandaloneServer_port-1,name1=InMemoryDataTree $>bean org.apache.ZooKeeperService:name0=StandaloneServer_port-1 #bean is set to org.apache.ZooKeeperService:name0=StandaloneServer_port-1 $>info #mbean = org.apache.ZooKeeperService:name0=StandaloneServer_port-1 #class name = org.apache.zookeeper.server.ZooKeeperServerBean # attributes %0 - AvgRequestLatency (long, r) %1 - ClientPort (java.lang.String, r) %2 - MaxClientCnxnsPerHost (int, rw) %3 - MaxRequestLatency (long, r) %4 - MaxSessionTimeout (int, rw) %5 - MinRequestLatency (long, r) %6 - MinSessionTimeout (int, rw) %7 - NumAliveConnections (long, r) %8 - OutstandingRequests (long, r) %9 - PacketsReceived (long, r) %10 - PacketsSent (long, r) %11 - StartTime (java.lang.String, r) %12 - TickTime (int, rw) %13 - Version (java.lang.String, r) # operations %0 - void resetLatency() %1 - void resetMaxLatency() %2 - void resetStatistics()Get metric values
$>get AvgRequestLatency #mbean = org.apache.ZooKeeperService:name0=StandaloneServer_port-1: AvgRequestLatency = 1;The 4-letter word
ZooKeeper emits operational data in response to a limited set of commands known as "the four letter words". You can issue a four letter word to ZooKeeper via telnet or nc.
The most important of the 4-letter words is the mntr command.
If you are on your ZooKeeper node, you can see all of the ZooKeeper metrics from part 2, including zk_followers, with mntr:
echo mntr | nc localhost 2181 zk_version 3.4.5--1, built on 06/10/2013 17:26 GMT zk_avg_latency 0 zk_max_latency 0 zk_min_latency 0 zk_packets_received 70 zk_packets_sent 69 zk_outstanding_requests 0 zk_server_state leader zk_znode_count 4 zk_watch_count 0 zk_ephemerals_count 0 zk_approximate_data_size 27 zk_followers 4 - only exposed by the Leader zk_synced_followers 4 - only exposed by the Leader zk_pending_syncs 0 - only exposed by the Leader zk_open_file_descriptor_count 23 - only available on Unix platforms zk_max_file_descriptor_count 1024 - only available on Unix platformsCollection is only half the battle
In this post we've covered a few of the ways to access Hadoop and ZooKeeper metrics natively and with cluster-management tools. For production-ready monitoring, you will likely want a comprehensive monitoring system that ingests Hadoop performance metrics as well as key metrics from every other technology in your data-processing stack.
At Datadog, we have developed HDFS, MapReduce, YARN, and ZooKeeper integrations so that you can start collecting, graphing, and alerting on metrics from your clusters with a minimum of overhead. You can easily correlate Hadoop performance with system metrics from your cluster nodes, or with monitoring data from related technologies such as Kafka, Cassandra, and Spark.
For more details, check out our guide to monitoring Hadoop performance metrics with Datadog, or get started right away with a free trial.
Acknowledgments
Special thanks to Ian Wrigley, Director of Education Services at Confluent, for graciously sharing his Hadoop expertise for this article. _
Source Markdown for this post is available on GitHub. Questions, corrections, additions, etc.? Please let us know.

