Christophe Nasarre
Previously in this series, we presented a high-level overview of Datadog’s .NET continuous profiler and discussed CPU and wall time profiling. This third part covers exceptions and lock contention profiling, with related sampling strategies. When an application throws too many exceptions, or its threads are waiting too long on the same locks, the impact on the performance is not as straightforward as CPU consumption but could be noticeable.
Throwing too many exceptions usually increases the CPU consumption. For example, consider when TryParse methods were introduced to replace Parse methods in .NET: to detect an error, catching a formatting exception is always more expensive (both in CPU and latency) than checking a Boolean. Behind the scenes, the runtime is spending many CPU cycles to ensure that catch and finally blocks are well executed. I’ve written at length about value types and exceptions in .NET profiling on my personal blog.
If we know how many exceptions are thrown per type and per message, and from where in the code, we can avoid throwing too many.
When we add parallel processing to our algorithms, we usually use locks to protect access to shared data structures. The latency of these parallel algorithms is impacted by the time spent waiting for these locks. Most monitoring platforms show the number of lock contentions, but not how long they lasted, nor from where in the code.
The rest of this post describes how we built the .NET profiler to show full-detailed information about exceptions and lock contentions, with a negligible impact on the profiled application.
Show me the thrown exceptions!
We need to fetch details on the exceptions before uploading the corresponding exception samples to the backend. How do we get those attributes?
When an exception is thrown, the CLR calls our ICorProfilerCallback::ExceptionThrown implementation with the ObjectID corresponding to the exception object. The ExceptionProvider::OnExceptionThrown method returns all the information we need (exception type, thread ID, etc). The ICorProfilerInfo::GetClassFromObject method is called to get the ClassID corresponding to the class of the exception instance. If the class name is not already cached, it is computed by the FrameStore. You can read my blog post on modules, assemblies, and types to learn how to get a type name from a corresponding ClassID.
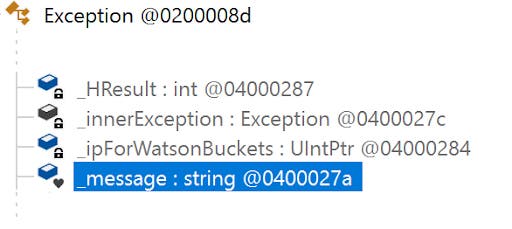
Getting the exception message requires additional work. The System.Exception class defines the _message field as a string.

To get the value of a given ObjectID, as this post explains in detail, we need to call ICorProfilerInfo2::GetClassLayout with the ClassID of its type. The returned array of COR_FIELD_OFFSET lists the fields defined by a type, but not the fields defined by its parents. This means that we need to know the ClassID of the System.Exception class, which is harder than one may expect. The idea is to look inside the metadata of the assembly that implements System.Exception. Our ICorProfilerCallback::ModuleLoadFinished implementation uses the given ModuleID to detect either mscorlib for .NET Framework or System.Private.CoreLib for .NET Core. At the same time, we use ICorProfilerInfo3::GetStringLayout2 to get pointers to a string's buffer and length—these are needed to read the value of the string stored in the _message exception field.
Next, follow the steps in ExceptionsProvider::LoadExceptionMetadata to get the offset of this field:
Call
ICorProfilerInfo::GetModuleMetaDatawith theModuleIDofmscorliborSystem.Private.CoreLibto get theIMetaDataImport, allowing us to access the metadata.Look for the metadata token definition corresponding to
System.ExceptionwithIMetadataImport::FindTypeDefByName.Get the corresponding
ClassIDwithICorProfilerInfo2::GetClassFromTokenAndTypeArgs.As expected,
ICorProfilerInfo2::GetClassLayoutgives us the array of fields definition.The metadata token definition of the
_messagefield given byIMetaDataImport::FindFieldallows us to match itsCOR_FIELD_OFFSETin the array, returned byGetClassLayout.
Listen to lock contention CLR events
Even if many synchronization primitives are available, the .NET runtime provides observability only on the Monitor, Enter, and Leave helpers used by the lock(var key = new ...) {} pattern. Each time a thread waits for entering a locked section, a counter is incremented. The .NET Framework updates the .NET CLR LocksAndThreads, Contention Rate / Sec, and Total # of Contentions performance counters. For .NET Core, the monitor-lock-contention-count counter is available via dotnet-counters. There is no visibility on the duration of the contentions.
The CLR emits two events when a thread faces lock contention: ContentionStart, before the thread starts to wait; and ContentionStop, when the thread can access the lock.
Some profiling features might not be available because event payloads are slightly different from one runtime flavor to another. For example, for .NET Framework (as opposed to .NET Core) the lock duration is not provided by the ContentionStop event, so we need to compute it ourselves by keeping track, per thread, of the timestamp of the ContentionStart event.
Thanks to a contribution we made to the .NET runtime, the ObjectID of the lock and which thread is holding it is available in the ContentionStart event since .NET 8. This allows us to represent which thread is responsible for the wait.
Since .NET 5, it is possible for a profiler to listen synchronously to the CLR events via the ICorProfilerCallback10::EventPipeEventDelivered method. The ClrEventParser class is responsible for extracting meaningful fields from the payload based on the event ID and keywords. In this case, only the duration is passed to the ContentionProvider::OnContention method.
Listening to CLR events is not yet supported for older versions of the .NET runtime, but some unexploited workarounds exist:
.NET Core 3.1: The EventPipe mechanism could be used to receive the events.
.NET Framework: Events are sent via ETW. (I’ve also written a blog series about this.)
In both cases, events are received asynchronously. This will break how we associate the span ID to the current thread’s context, which is used for Code Hotspots.
Sampling of exceptions and lock contention events
Remember that continuous profiling implies seeking to minimize impact on the profiled application. If exceptions or lock contentions spike, tens of thousands of events might need to be processed over a very short period of time. With the cost of stack walking, generating the .pprof file, and other factors, application performance would severely deteriorate. This is why we sample these events.
The algorithm behind the sampling is inherited from the adaptive sampler of Datadog’s Java Exception Profiler. Since there is a risk of having too many events generated—for example, if the developer is using exceptions for control flow—the number of events need to be limited somehow. Because we want to avoid doing any work (like walking the stacks) or use any resources (i.e. memory and CPU) if an exception is not to be sampled, reservoir sampling becomes tricky. Instead, we use the idea of a discrete PID controller to control the subsampling and quickly get as close to an acceptable sample rate as possible.
This technique was also used in the OpenJDK allocation profiler to which Datadog contributed. However, in the case of allocation profiling, it is the distance between samples in allocated memory that is adjusted, and we use the amount allocated since the last sample is recorded to aid in the normalization of a sample's weight.
These limits can be changed via environment variables for exceptions (DD_INTERNAL_PROFILING_EXCEPTION_SAMPLE_LIMIT with 500 as default) and lock contention (DD_INTERNAL_PROFILING_CONTENTION_SAMPLE_LIMIT with 3000 as default). The 500 default value for exceptions might seem small, but—usually—the code paths that generate exceptions are not that different, nor are the thrown exceptions.
For exceptions, at least one occurrence per type is kept. This is particularly important in case of rare and unexpected exceptions that should not be missed, especially if it is the last uncaught exception that crashes the application. In that case, since we flush a last profile before exiting, the faulty exception is recorded.
The lock contentions are treated differently by dispatching them into duration buckets: 0 to 9 ms, 10 to 49 ms, 50 to 99 ms, 100 to 499 ms, and greater than 500 ms. Unlike for exceptions, a bucket may end up empty.
Final step: the upscaling!
We sample exceptions and lock contention events to avoid performance impact, but this leads to a different problem: the cumulative count and duration of these events will be far from the reality. We use the term upscaling to describe the process of estimating real numbers based on sampled ones.
Let’s start with an example with thrown exceptions:

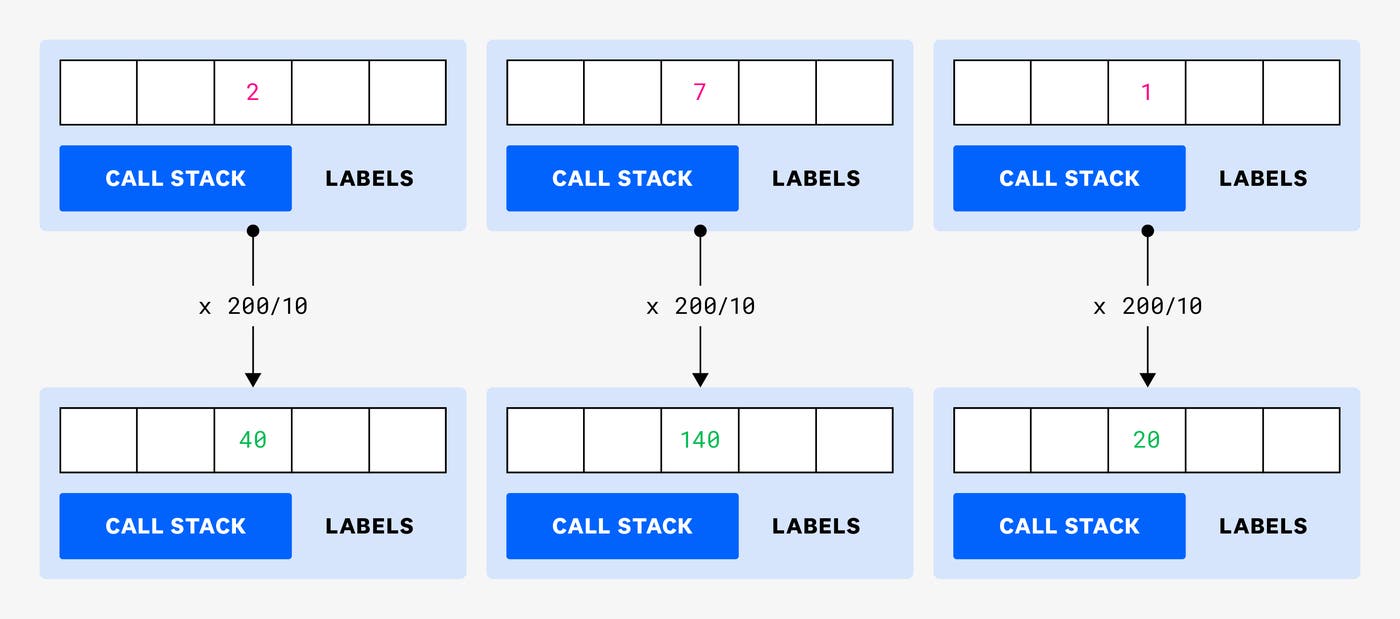
The InvalidArgumentException was thrown 200 times and sampled 10 times in 3 different contexts. (These contexts could be different based on—for example—their call stacks, thread ID, or error message.) In that case, the same proportional ratio is applied to each sample: the total number of exceptions divided by the number of sampled exceptions, 200/10: an upscaling factor of 20.
This method provides a cumulative count of exceptions equal to the exact number of thrown exceptions. Since exceptions are usually raised from the same call sites, the statistical distribution is often good. If the statistical distribution of exception contexts is good, the resulting distribution will also be good.
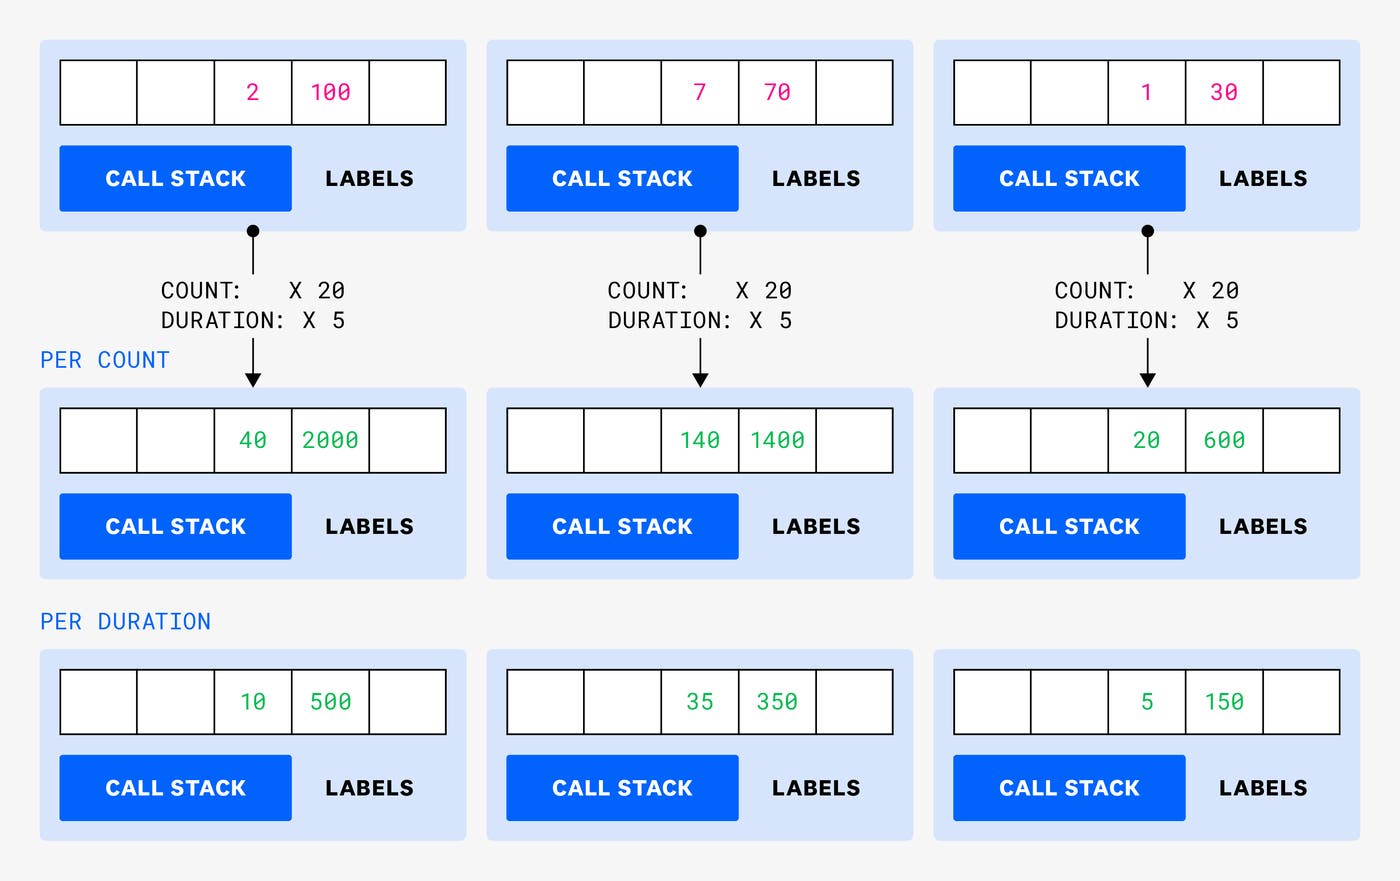
The idea is the same for lock contention:

This time, we need to decide how the proportional ratio will be computed: is it based on the counts or on the durations? If we were to calculate by count, we would use the total number of events divided by the number of sampled events (200/10=20). If we were to calculate by duration, we would use the total duration divided by the sampled duration (1000/200=5). Since the duration is more important to troubleshoot, we decided to use 5 as the upscaling factor. This means that the lock contention count will probably not be accurate, but again, it is the duration of lock contention events that impacts latency, not their frequency.
Conclusion
In this third part of our series on looking under the hood of Datadog’s .NET continuous profiler, we have explained how exceptions and lock contention profiling are implemented to get exception messages and how long threads are waiting for locks. We also discussed how we upscale sampled values to provide estimates of what really happens in a profiled application.
In the next post in this series, you will see how we sample allocations and keep track of the live objects after garbage collection.

