
Christophe Nasarre
The first part of this series introduced the high level architecture of the Datadog .NET continuous profiler. I discussed its initialization and the impact of the .NET runtime (CLR) version to figure out which CLR services to use.
The goal of the profiler is to collect different kinds of profiling samples: CPU, wall time, exceptions, lock contention, etc. Each sample contains a call stack, a list of labels for the context (e.g. current thread, span ID) and a vector of values (e.g. the lock duration or the number of CPU cycles).
In this post, I present our implementation of CPU and wall time profiling. In addition to defining these kinds of profiling, I dive into the details of:
How the application threads are monitored and sampled.
An internal example where the CPU profiler was used to reduce our CPU consumption.
How stack walking is implemented both in Linux and Windows.
CPU and wall time profilers
When you think of profiling, you’re probably thinking of CPU profiling: finding blocks of code that burn a lot of cycles. The objective of wall time profiling is different: to find slow methods, regardless of how the time is spent. A method could be executed by a thread that is not fully scheduled on a core by the OS—it could, for example, be waiting for I/O or on a lock. Wall time helps you figure out why a request was slow.
You could use Event Tracing for Windows (ETW) or the Linux perf tool to get a sampled view of what the threads are doing. (I’ve written about using the ETW Kernel provider to build a profiler on my personal blog.) However, the impact of these tools on the whole system is incompatible with a production environment. Additionally, these tools require high user privileges.
For wall time, you could use the native .NET profiling API's enter/leave hooks but, again, the performance impact on the application is not acceptable for a 24/7 production environment.
The solution is to sample threads at a certain frequency: this means selecting a thread, looking at its call stack, and assigning a duration to the sample. The rest of this post details how we sample threads for both CPU and wall time profiling. The related performance optimizations done by the Datadog .NET profiler are also covered.
Thread sampling
The CPU and wall time profilers only look at threads managed by the .NET runtime. The managed threads wrap OS threads created by the thread pool, Task instances, async/await calls, or explicit instances of the Thread class. We are notified of the managed threads’ lifetimes via ICorProfilerCallback’s ThreadCreated, ThreadDestroyed, ThreadAssignedToOSThread, and ThreadNameChanged methods. The first two callbacks allow us to store the list of the managed threads we want to sample in the ManagedThreadList class.
Pitfall: In an early implementation, the .pprof file generation was written in C# and required reverse P/Invoke calls from some native worker threads with unexpected effects. The CLR detects when a native thread is calling a managed method, sees it as a managed thread, and notifies us via the ThreadCreated callback. Since we are only interested in sampling real managed threads (i.e., started from managed code), we had to explicitly check this situation to avoid sampling our own native threads. We removed the C# code, so this is no longer a problem.
The StackSamplerLoop class is responsible for sampling threads, getting their call stacks, and adding the corresponding raw samples to the CpuTimeProvider and WallTimeProvider. These providers are registered to the SamplesCollector, which is in charge of regularly retrieving the providers’ samples and adding them to the exporter. Then, every minute, the exporter uploads the profile containing all collected samples to the Datadog backend. The implementation of the exporter is written in Rust and shared with other Datadog profilers such as the Datadog PHP profiler, Ruby profiler, and Linux native profiler.
Special native threads
Beyond the managed side of the world, some native threads could have an impact on the performance of a .NET application. The obvious ones are the threads created by the garbage collector in server mode; during background garbage collection, these threads compete for CPU with the application’s threads.
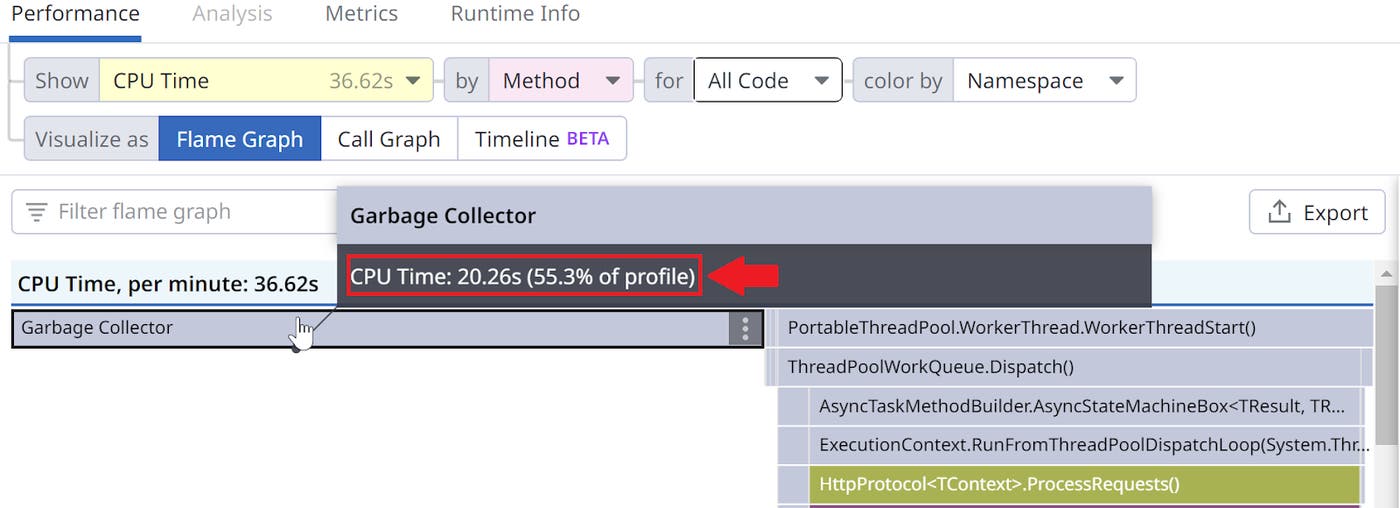
The problem is to identify these threads—but, unfortunately, the .NET profiling API doesn’t help. Since .NET 5, these threads are named ".NET Server GC" and ".NET BGC". Every minute, we compute the CPU consumption of these threads and display the total at the top of the flame graph under the Garbage Collector frame:
CPU profiling
When you use a CPU profiler, you are only interested in knowing what your threads were doing while running or ready to run on a core (i.e. CPU-bound code). Every ten milliseconds, we look for some number of these "runnable" threads from the ManagedThreadList introduced earlier (skipping up to 64 non-runnable threads). In the case of server machines with a large number of cores, this should ensure that most running threads are captured.
We also want to know how much CPU time was consumed by a sampled thread. The IsRunning function returns true if the given thread is running on a core with its CPU consumption. It has two different implementations: one for Windows, based on NtQueryInformationThread; and one for Linux, based on parsing /proc/self/task/<tid>/stat. The duration associated with a CPU sample is the difference between the current CPU consumption of the thread and the previous CPU consumption we recorded for that same thread.
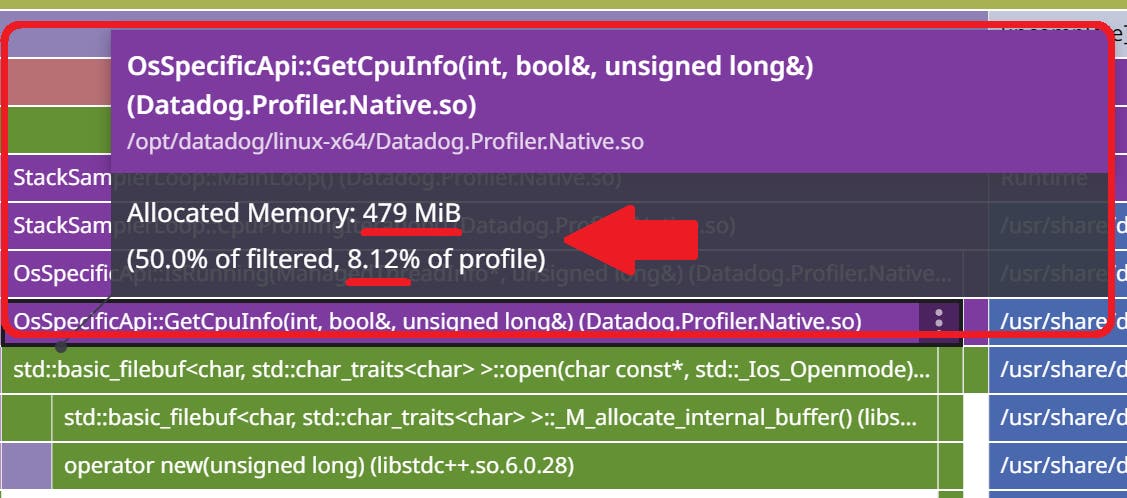
Since our .NET profiler is written in C++, we used the Datadog native profiler to measure its performance. When we ran a test application with both profilers enabled, the code path shown in the following flame graph was responsible for more than 8% of the allocated memory: almost 500 MB!
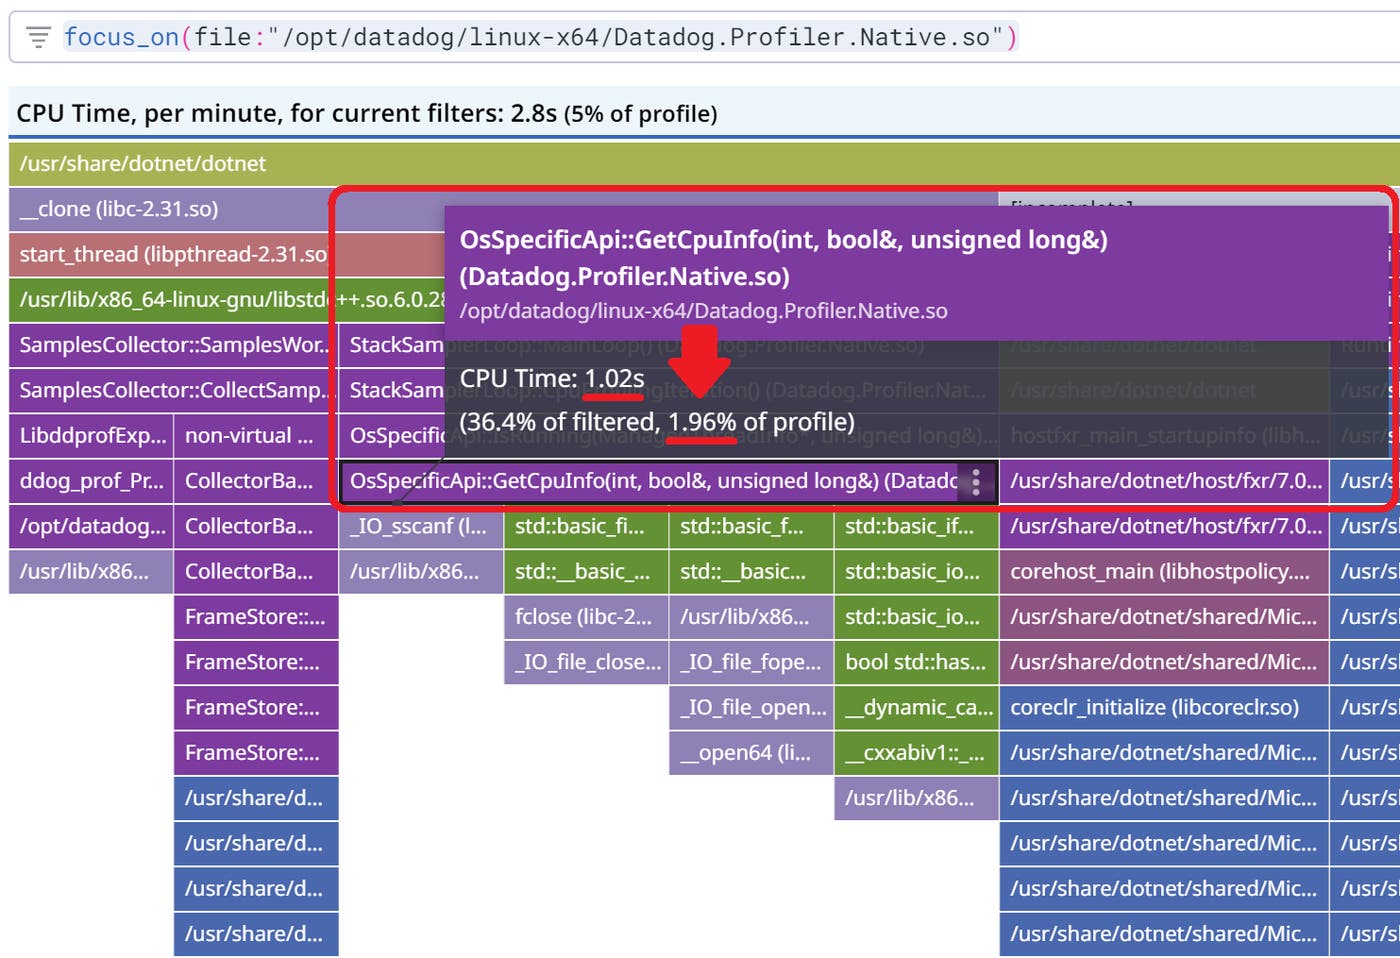
The impact on CPU accounted for almost 2% of the total CPU usage:
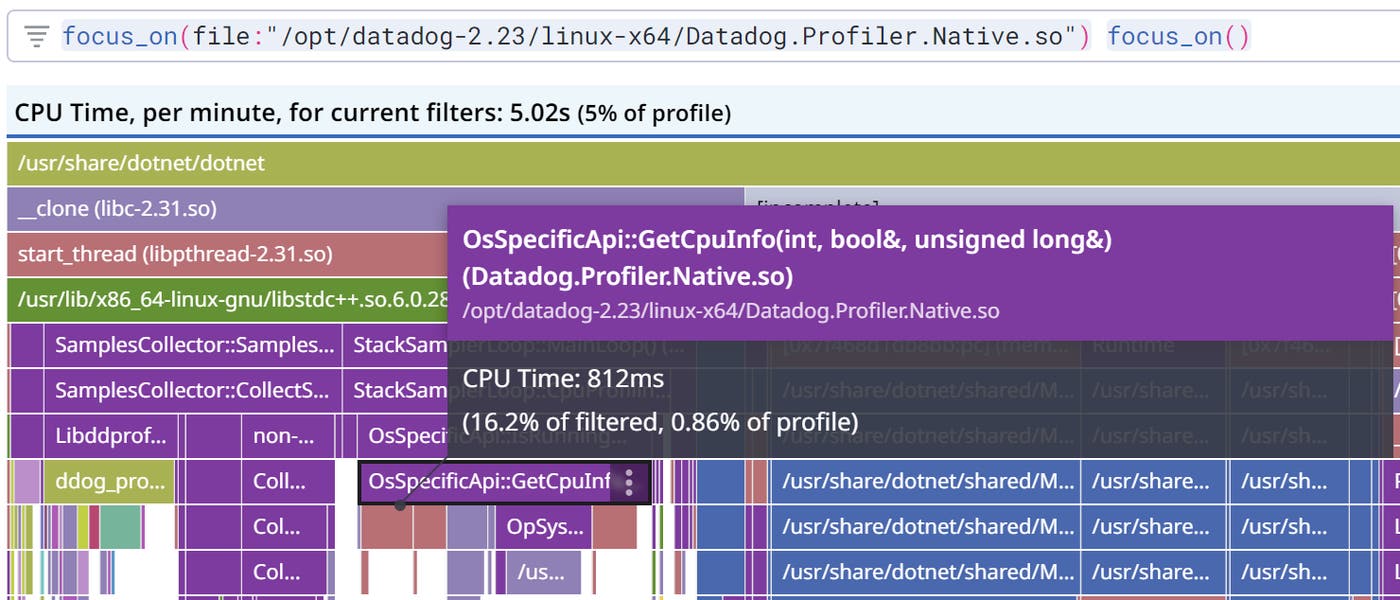
The initial Linux implementation to read from /proc/... relied on std::ifstream and std::getline. This high-level C++ class is using a 8 KB buffer that is allocated and deleted each time a thread is sampled. The fix was to use a more low level C implementation, which allowed for no allocation at all and less CPU consumption.
Wall time profiling
At Datadog we use wall clock profilers together with the distributed tracer to help you figure out why some requests are slow: Code Hotspots. When the tracer knows that a thread is processing a request, it notifies the profiler of the corresponding span ID. To limit the number of expensive P/Invoke calls, the tracer will call the profiler only once per thread to get the memory location where the span ID will be directly written, without any additional P/Invoke calls needed.
When an application runs a lot of threads, the probability of any thread processing a request getting sampled decreases—especially for short requests. So, in addition to the initial five threads, we sample an additional group of ten threads associated with a span.
The duration between two consecutive samples of the same thread is reported as the duration of the second sample. This means that if more threads are running, the wall time samples will have a longer duration: five threads have a duration of 10 ms (i.e., the wall time sampling period), 10 threads have a duration of 20 ms, and so on. We are interested in these wall time samples for a high-level view of what each thread is doing on a regular basis. This can help pinpoint threads waiting on I/O, for example. In a forthcoming post, I will discuss how these wall time samples are used in the timeline view.
Pitfall: Of all the profiler types, the wall time profiler is the most impactful in terms of fixed CPU consumption because around 30,000 samples are taken per minute. As explained in the troubleshooting documentation, you can reduce the profiler's impact on CPU usage by disabling the wall time profiler (i.e. setting DD_PROFILING_WALLTIME_ENABLED=0). This is particularly important for small configurations like containers. In the case of configurations with less than one core, the profiler simply disables itself. It is possible to override this one core threshold to a smaller value by setting the DD_PROFILING_MIN_CORES_THRESHOLD environment variable to a value less than one, such as 0.5 for half a core. This is not recommended because the constant CPU cost of the profiler becomes proportionally larger as the number of cores shrinks. It will probably start to impact the application performance simply because, to run, it competes with the application threads.
Stack walking
Once a thread is sampled, the next step is to walk its stack to build its call stack (i.e. the list of frames corresponding to method calls). We created three different implementations: Linux, Windows 64-bit, and Windows 32-bit.
Linux
The Linux implementation performs sampling by interrupting threads using signals. Our CollectStackSampleSignalHandler handles the signal and performs stack walking, effectively hijacking the thread. The stack walk is done by the libunwind unw_backtrace2 function, which fills up an array of instruction pointers.
The Linux signal mechanism allows a piece of code to be executed by any thread, thus any thread can walk its own stack.
This requires our signal handler to be installed process-wide, which poses some problems. What if another signal handler is already installed by another library? What if another library tries to install its own handler after we’ve installed ours, or even at regular intervals? These conditions are handled by our ProfilerSignalManager class which reinstalls our handler if needed and calls the existing handlers, if any.
We also made open source contributions to libunwind that improved stack walking performance and added support for a special signal handler case.
Windows (32-bit and 64-bit)
The 32-bit implementation of the stack walker relies on the ICorProfilerInfo2::DoStackSnapshot method, which walks the stack and executes a callback for each frame with the instruction pointer of the corresponding method.
The 64-bit implementation is a custom stack walker that uses RtlLookupFunctionEntry and RtlVirtualUnwind.
Interestingly, both implementations require that the walked thread is suspended (unless it is the current thread).
Pitfall: On Windows, this required suspension could trigger a deadlock situation. For example, the suspended thread could have acquired a lock that is needed by the walking code. This is exactly what happens with the Windows loader lock (i.e. when a .dll gets loaded, its DllMain entry point is executed under that lock), or with a lock within the malloc code. To deal with this kind of situation, the StackSamplerLoopManager creates a watcher thread at the beginning of the application that wakes up every second to check if such a deadlock situation exists—and, in that case, stops the stack walk and resumes the thread. On Linux, the same deadlock situation happens but on the same thread: before the signal handler runs, the code might have acquired a lock used by the signal handler. To avoid this situation, we identified the functions related to these deadlocks; these functions are dynamically trampolined thanks to the LD_PRELOAD mechanism. Our replacement functions are simply checking they are not recursively called.
Symbolization
Unwound stack traces contain instruction pointers, which need to be mapped to method metadata or symbols to be useful. This mapping process, known as symbolization, occurs outside of the signal handler. For each instruction pointer, if ICorProfilerInfo::GetFunctionFromIP is successful, it means that it was a managed method. (I've also written about how the assembly, namespace, type and method names are computed).
Note that as of today, native frames (i.e. P/Invoke calls) are not shown.
Sample context
In addition to the call stack, we use labels to add context to each sample:
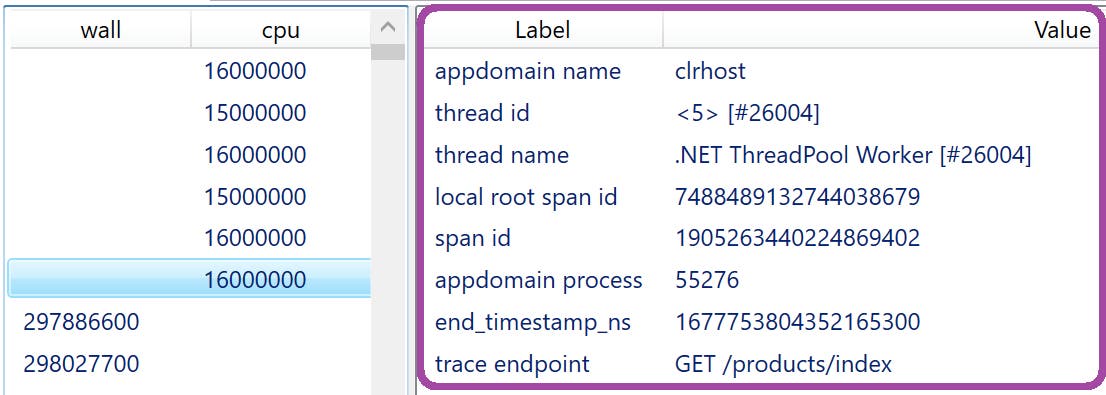
Let’s see what these labels mean, and how the provided context can be helpful:
appdomain name: The name of the appdomain in which the sample was taken. This could be interesting in the case of IIS, where different services are running in the same OS process; names would resemble
/LM/W3SVC/1/ROOT-1-133222433809582730.thread id: This value uses format
<xxx> [#yyy], wherexxxis an ID internal to the profiler, andyyyis the OS thread ID. Both IDs are needed to uniquely identify a thread because when a thread ends, the OS could assign its ID to a new thread. This means that during a profile, the same OS thread ID might appear in different unrelated samples.thread name: If a thread is not named,
Managed thread (name unknown) [#yyy]is used. In addition to explicitly named threads,.NET Threadpool Workeris also used by the CLR to run async methods.local root span id, span id: These IDs are used by Code Hotspots, a feature that allows users to see the samples recorded during a specific trace.
appdomain process: OS process ID of the service. This allows users to filter profiles by a given process ID retrieved from logs.
trace endpoint: The HTTP endpoint associated with the sample.
Conclusion
In this second part of our series on looking under the hood of Datadog's .NET continuous profiler, we have explained CPU and wall time profiling, as well as how we implemented these in our profiler for both Linux and Windows. We covered how we measure the CPU impact of the garbage collector, dove into the process of stack walking across different platforms, and discussed how labels add helpful context to each sample. Lastly, we detailed how we used our own profiler to reduce our CPU consumption.
In the next post in this series, you will see how we implemented exception and lock contention profilers. We will also explain the mechanisms used to compute accurate count and duration based on sampled values.
