Christophe Nasarre
In Part 1 of this series, I presented a high-level overview of the architecture, implementation, and initialization of Datadog’s .NET profiler, which consists of several individual profilers that collect data for particular resources. I went on to discuss profiling CPU and wall time in Part 2 and exceptions and lock contention in Part 3, alongside detailed explanations of stack walking across different platforms and upscaling sampled data.
This fourth and final part covers memory usage profiling—why it’s useful, how our profiler does it, and what challenges we faced.
What can memory usage profiling do for users?
Before I explain how we implemented memory usage profiling, here’s what we built—from the users’ perspective:
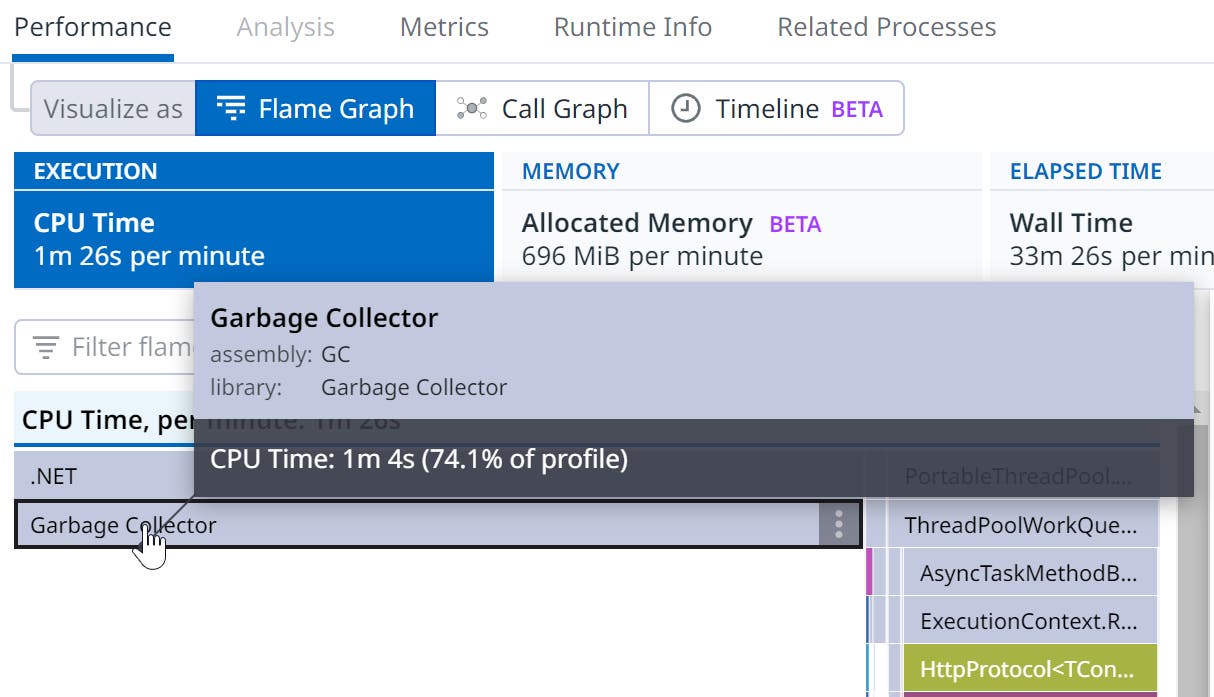
With Datadog’s .NET memory profiling capabilities, you can identify when their application is causing high CPU consumption due to excessive garbage collection by the runtime. To pinpoint which parts of your code are responsible for the most memory allocation, you can switch to the Allocated Memory profile type to see which endpoints allocate the most, in addition to which types are most commonly allocated. You can also view a sample of objects that stay in memory after garbage collection. From here, you can further optimize their allocations or investigate possible memory leaks.
Next, I’ll explain how we make all this happen: how we monitor garbage collection, allocations, and surviving objects.
Measuring the garbage collector’s impact on CPU
How does the profiler monitor garbage collector activity? This information is derived from events emitted by the CLR during the different phases of each garbage collection and documented in another of my blog posts. I explained how to get these events in the third part of this series.
To get the CPU consumption, we need to dig into the internals of the .NET garbage collector. In server garbage collection (server GC) configurations, the CLR starts two threads per heap (i.e., per core) so that each heap is processed with high priority in parallel during garbage collections. Since .NET 5, these threads are named .NET Server GC and .NET BGC.
Each time a profile is sent to the Datadog backend, the CPU consumption of these threads is retrieved from the operating system, and a sample is added with a native call stack containing a single frame called Garbage Collector. Interestingly, unlike the other data collection methods presented, the push model (which is based on received events or runtime notifications) does not work. There is no event from which samples would be created (like for exceptions or lock contentions) nor a dedicated thread (like for wall time and CPU), so we need to get notified when to compute the garbage collector’s CPU consumption as one sample (i.e., every minute from the exporter in our architecture). This is, therefore, a pull model.
In versions before .NET 5, these CPU consumption details are not available. Even if the GCCreateConcurrentThread CLR event is emitted each time a background thread is created during the CLR startup, its payload does not contain the thread ID, so it cannot be used to identify garbage collector threads.
Tracking allocations
There are a number of ways to know what is allocated in a .NET application, though some of them significantly impact performance. We could receive a notification for each allocation, calling ICorProfilerCallback::ObjectAllocated to notify the profiler that memory within the heap has been allocated for an object—but this is expensive. The garbage collector cannot rely on fast path allocation code, and it would slow down the application.
We could also use GCSampledObjectAllocation events or the ICorProfilerCallback::ObjectsAllocatedByClass method to get statistics per allocated type, but for both strategies, again, the garbage collector cannot use the fast path, and no call stack per allocation site is available.
For continuous production profiling, we chose another approach: listening to the AllocationTick event, which is emitted every allocated 100 KB. The AllocationTick event payload contains interesting information about the last allocated object crossing the threshold:
ClassIDand type name: In the case of generics, the type name has the suffix'xx, wherexxis the number of generic parameters. We use the .NET profiling API to rebuild the type name based on itsClassID.- Address in memory where the object is allocated: This is used to track the object’s lifetime—more on this in the next section.
- Size and total allocated size since the last
AllocationTickevent: Behind the scenes, the CLR keeps track of three independent thresholds depending on where the objects are allocated: small object heap (SOH), large object heap (LOH), and pinned object heap (POH). TheAllocationKindfield provides0for SOH,1for LOH, and2for POH.
Since the events are received synchronously, we know that the current thread is the one responsible for the last allocation, and we can simply walk the stack of the current thread to get the corresponding allocation call stack.
This information gives a sampling of allocations every 100 KB (per SOH/LOH/POH).
Tracking surviving objects
The AllocationTick event payload provides the address where the object is allocated, but this is not enough to monitor its lifetime in the managed heap. Recall that during the compacting phase of garbage collection, an object can be moved in memory, so its address will change. To keep track of an object in C#, you can create a Weak handle around it with GCHandle.Alloc. The CLR updates the handle’s state, garbage collection after garbage collection: if it is no longer referenced (the Weak handle does not count as a reference root), then its IsAllocated property returns false. This is a perfect way to monitor the lifetime of a sampled allocation.
I added this feature, used by the LiveObjectsProvider, to .NET 7’s ICorProfilerInfo13 profiling API:
- For each
AllocationTick, aWeakhandle is created from the given address and added into the list of monitored objects with its creation time. - After each garbage collection, the handles corresponding to objects that are no longer referenced are removed from the list and destroyed. The remaining handles will be stored in the next generated profile.
Memory leaks in .NET can be hard to find due to false positives. For example, if your application stores some objects in a global cache that is refreshed on a regular basis, just looking at the number of live objects per type name can be misleading, as they won’t change even if different instances are stored there. However, by keeping track of each live object’s age—the difference between its creation time and now—it becomes possible to discern between a refreshed cache (the age grows and then goes back to 0 before growing again) and a real memory leak (the count and the age grow forever).
Pitfall: When the
AllocationTick event is received, the address in the payload is the place in memory where the object will be allocated, not where it is already stored. This means that passing the allocation address into ICorProfilerInfo.CreateHandle will crash, because the object isn’t at the address yet. For this method to work, it requires the MethodTable that corresponds to the type of the allocated object. Thus, we would need to defer tracking after allocation. One solution would be to have a separate queue of allocated objects that are transformed into Weak handles before the next garbage collection starts, so that the address still points to the allocated object. This would add complexity to the provider implementation, and we prefer to keep things as simple as possible. Fortunately, the missing MethodTable pointer corresponds to the ClassID field of the AllocationTick payload. The next piece of the puzzle is that the address of an object in the managed heap points to the memory where the MethodTable should be stored. For more details, see Microsoft’s developer blog post. The LiveObjectsProvider patches this memory with the ClassID before calling ICorProfilerInfo.CreateHandle.
Upscaling issues
Like in exception and lock contention profiling, we want to upscale sampled values to estimate real values—but here, complications arise. We know the number of allocations and the corresponding size per type. The obvious algorithm is the same as the one used for lock contention profiling, but this time, we use size instead of duration. The AllocationTick event payload provides both total and per-allocated-object sizes.
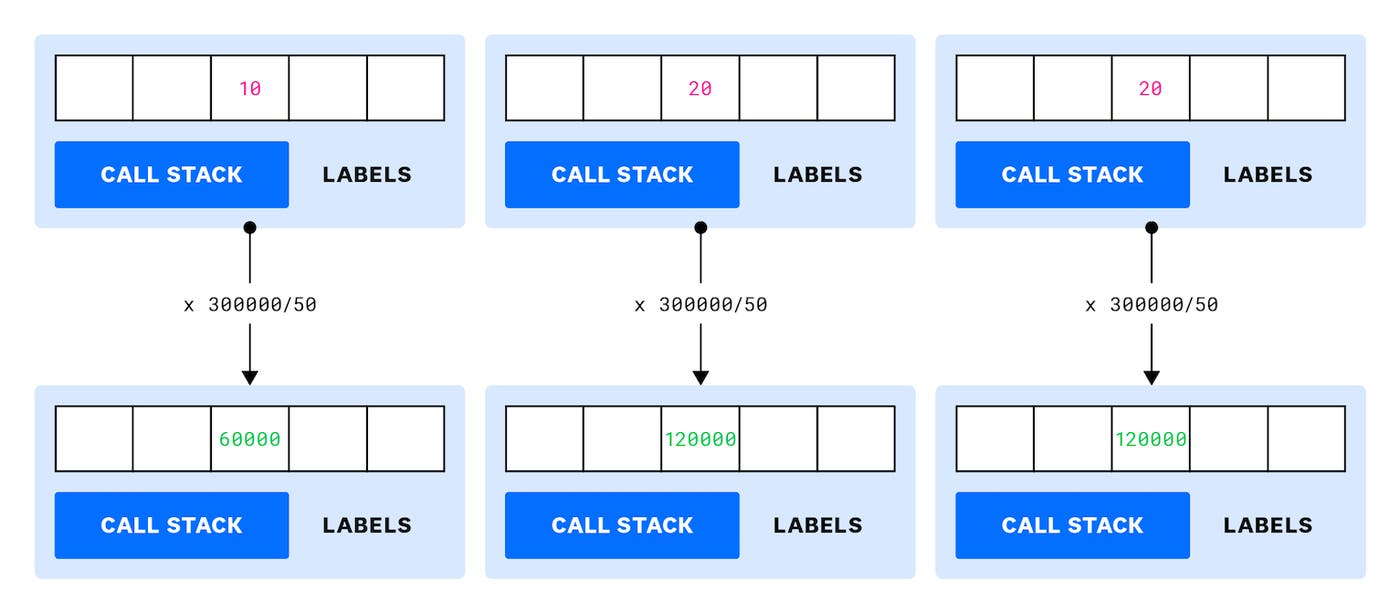
The upscaling ratio is the total allocated size divided by the sampled allocated size.
The main difference between this algorithm and the one used for exceptions and lock contention is that it relies on the good statistical distribution of the allocations based on a fixed 100 KB threshold. To validate this assumption, we wrote an allocation recorder based on the ICorProfilerCallback::ObjectAllocated callback and an allocation simulator. We tested a few .NET applications (desktop and web-based) with different workloads, and the results were not good: the orders of magnitude and the relative values between types were mostly unrelated to the real allocations.
After discussing with our runtimes experts, we realized that the Go and Java profilers use a different approach: instead of using a fixed threshold, they compute a new threshold based on a Poisson process each time an allocation is sampled. (Explaining the mathematical details behind this warrants its own blog post.) Through this approach, the statistical distribution is more representative of the real allocations, and the upscaling algorithm uses some exponential computations that lead to much better results. Partnering with Microsoft, we tried to implement this change in the CLR for .NET 8, but it was too late. We hope to implement it for .NET 9.
Upscaling for live objects is even more complicated, for two main reasons:
- The number of weak handles should be limited to reduce the impact on the garbage collector. If the sampled live objects are beyond this limit (1024 today), what trimming algorithm should be used without breaking a good statistical distribution?
- For memory leaks, the number of leaking instances should become more and more important relative to the other allocated types—again, breaking the statistical distribution and preventing us from upscaling accurately.
Due to these issues, the current implementation of both allocation and live heap profiling do not upscale the sampled values. Things might change in the future when the allocation sampling distribution will allow more realistic upscaling.
Conclusion
In this fourth part of our .NET profiler series, I have explained how we are able to show the impact of allocations on an application’s performance. The CPU consumption of the garbage collector is directly retrieved from the OS and shown directly in the profiler’s flame graph, allowing you to detect situations where the application is allocating a lot of objects. Allocations are tracked continuously—without impacting the application—to identify which part of the code is responsible for these allocations. To monitor objects that are still alive, it was necessary to add specific profiling APIs to .NET. With all this in place, if you suspect memory issues in your application, you can check the garbage collector’s CPU consumption in the CPU flame graph, examine the number of allocations, and look for memory leaks by tracking allocated objects.
This concludes our series on looking under the hood of Datadog’s .NET continuous profiler. Our architecture allows the profiling of CPU and wall time consumption, exceptions, locks contention, and memory allocations—on both Linux and Windows. As you have seen, our technical choices are driven by minimizing the impact on continuously profiled applications while providing information that can be trusted. This journey has included contributing new features in the runtime itself that benefit the whole .NET ecosystem.
The Datadog engineering organization uses our own native continuous profiler to regularly improve both our own product and the profiler itself. I hope that this series has shown how we approach developing a product that not only is helpful for optimizing applications, but also invaluable for troubleshooting production issues.
Further reading
- CPU profiling with kernel events
- Thread lock contention
- Exceptions profiling
- Building your own .NET memory profiler in C# - Allocations
- Spying on .NET Garbage Collector with .NET Core EventPipes
- Memory Anti-Patterns in C#
- Pro .NET Memory Management: For Better Code, Performance, and Scalability by Konrad Kokosa
