Tim Lehnen
This is a guest post from Tim Lehnen, Director of Engineering for the Drupal Association. This post originally appeared on the Drupal Association website.
Drupal is one of the largest and longest-running open source projects on the web. Keeping Drupal.org and all of its sub-sites and services online and available is no small task. To centralize our monitoring data in one place, we switched from a patchwork of solutions to Datadog for monitoring and alerting.
Complex and evolving infrastructure
Drupal.org is not a single, monolithic entity. The project relies on a complex infrastructure that supports many sites and services, and is continuously evolving to meet the needs of the Drupal community.
The Drupal project infrastructure comprises a combination of VMware hosts, bare metal servers, and cloud instances that are all fronted by a global content delivery network (CDN). These sites and services include project hosting, community forums, the Drupal jobs board, Git hosting, and much more. Many of these systems hook into each other and share data.
The Drupal infrastructure includes:
- 8 production Drupal sites that run on PHP and MySQL (MariaDB)
- Code repositories and code viewing with GitTwisted and CGit
- The Updates.xml feeds that provide update information to Drupal sites around the world
- Automated testing for the Drupal project through DrupalCI, using a Jenkins dispatcher, DockerHub images, and dynamically scaling testbots on AWS
- The Drupal Composer Façade that makes Drupal buildable with the PHP composer tool
- Solr servers for search
- A centralized loghost that uses rsyslog
- Remote backups to rsync.net
- DrupalCamp static archives
- Pre-production infrastructure for development and staging sites
We monitor not only Drupal sites but automation systems, cloud instances, and custom services like the updates system and the Composer Façade.
Ad hoc monitoring misses problems
The variety of sites and services that we manage makes infrastructure monitoring at the service and application level complex. At one point we were using five separate monitoring services to keep track of different parts of the infrastructure. Each monitoring service produced its own alerts, in different channels and in different formats.
Using so many systems meant that we had redundant monitoring and alerts for some services. And for other systems, we overlooked monitoring entirely. The gaps and redundancies of the ad hoc monitoring systems---combined with the administrative overhead of managing several accounts---left us in a place where it was difficult to separate signal from noise.
Centralized monitoring tracks everything
We got rid of our ad hoc system and standardized on Datadog for centralized monitoring. We use our Puppet tree to automatically configure the Datadog Agent for all the hosts in our infrastructure. Instead of generating alerts from many independent services, we pipe them all into Datadog and rely on it as our central authority of record for the current state of our infrastructure.
Datadog provides integrations with services that we use at all levels of the stack, from Jenkins automation, to application performance monitoring with New Relic, to monitoring Fastly CDN delivery and error rates. We have used more than a dozen integrations, which allows us to quickly and easily observe all systems, applications, and services. When issues arise, Datadog is integrated with Slack, IRC, and OpsGenie to generate the appropriate alerts for our team.
Building insight over time
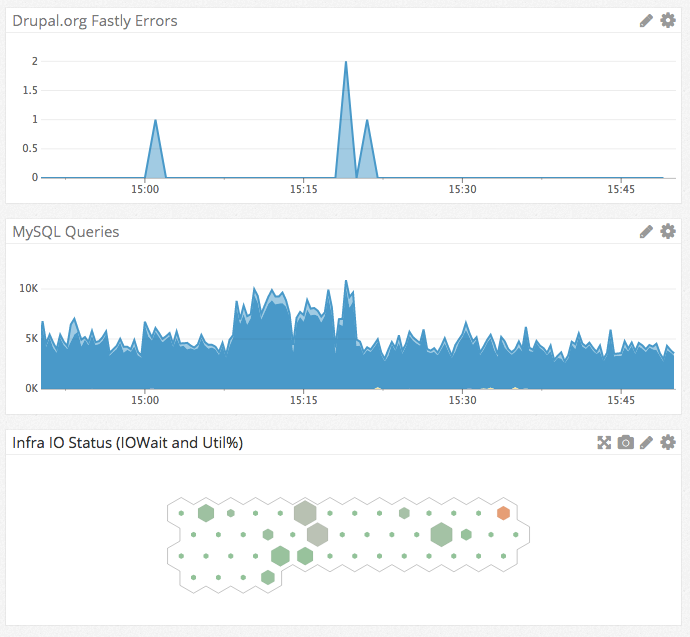
In the example below, you can see how Datadog dashboards give us an at-a-glance picture all the way from CDN errors that an end user might hit, to MySQL activity for non-cached operations, to I/O wait and utilization percentage for resources on disk.

We can explore any metric on the fly, whether it’s collected by the Datadog Agent or a service that integrates with Datadog. We can model traffic patterns, identify potential database deadlocks, find processes that use excessive CPU resources, or anything else that we need to track.
Datadog helps our engineering team ensure that sites and services that the Drupal project depends on are reliable, resilient, and performant. Over time the centralized monitoring and alerts, in combination with the insight we gain from the metrics Datadog provides, will reduce the time and effort we spend maintaining our infrastructure and will increase the uptime and performance of our tools for the open source community.


