Mary Jac Heuman

Kay Dobesh

Miranda Kapin
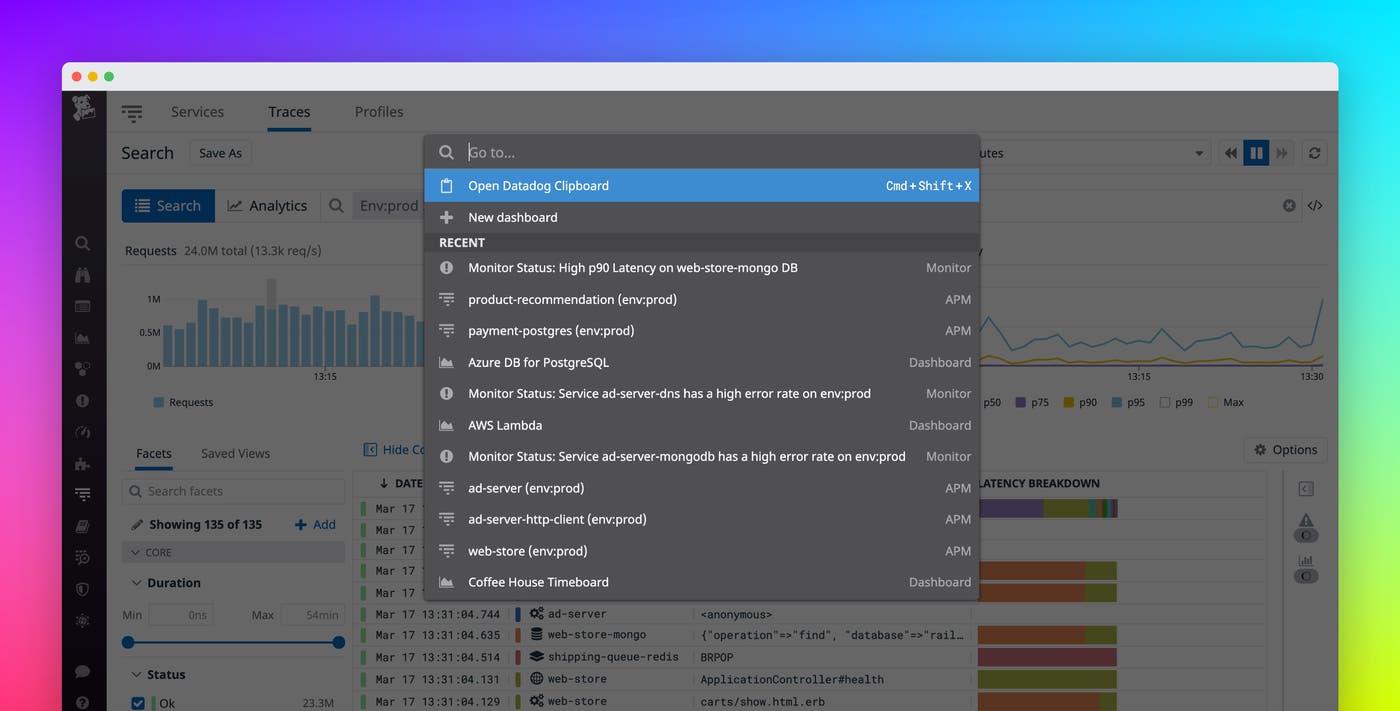
Datadog’s features give you full visibility into every part of your application environment, so it’s likely you have many resources to switch between as part of your troubleshooting and development workflows. For example, you might switch from the host map to investigate a performance issue with your services in APM, or jump between dashboards to correlate metrics and troubleshoot a problem with your CI/CD pipeline. Now, our quick navigation menu makes it easier and faster to navigate between your key resources so that you can track issues and troubleshoot more efficiently.
Use CMD+K to quickly access the quick nav menu
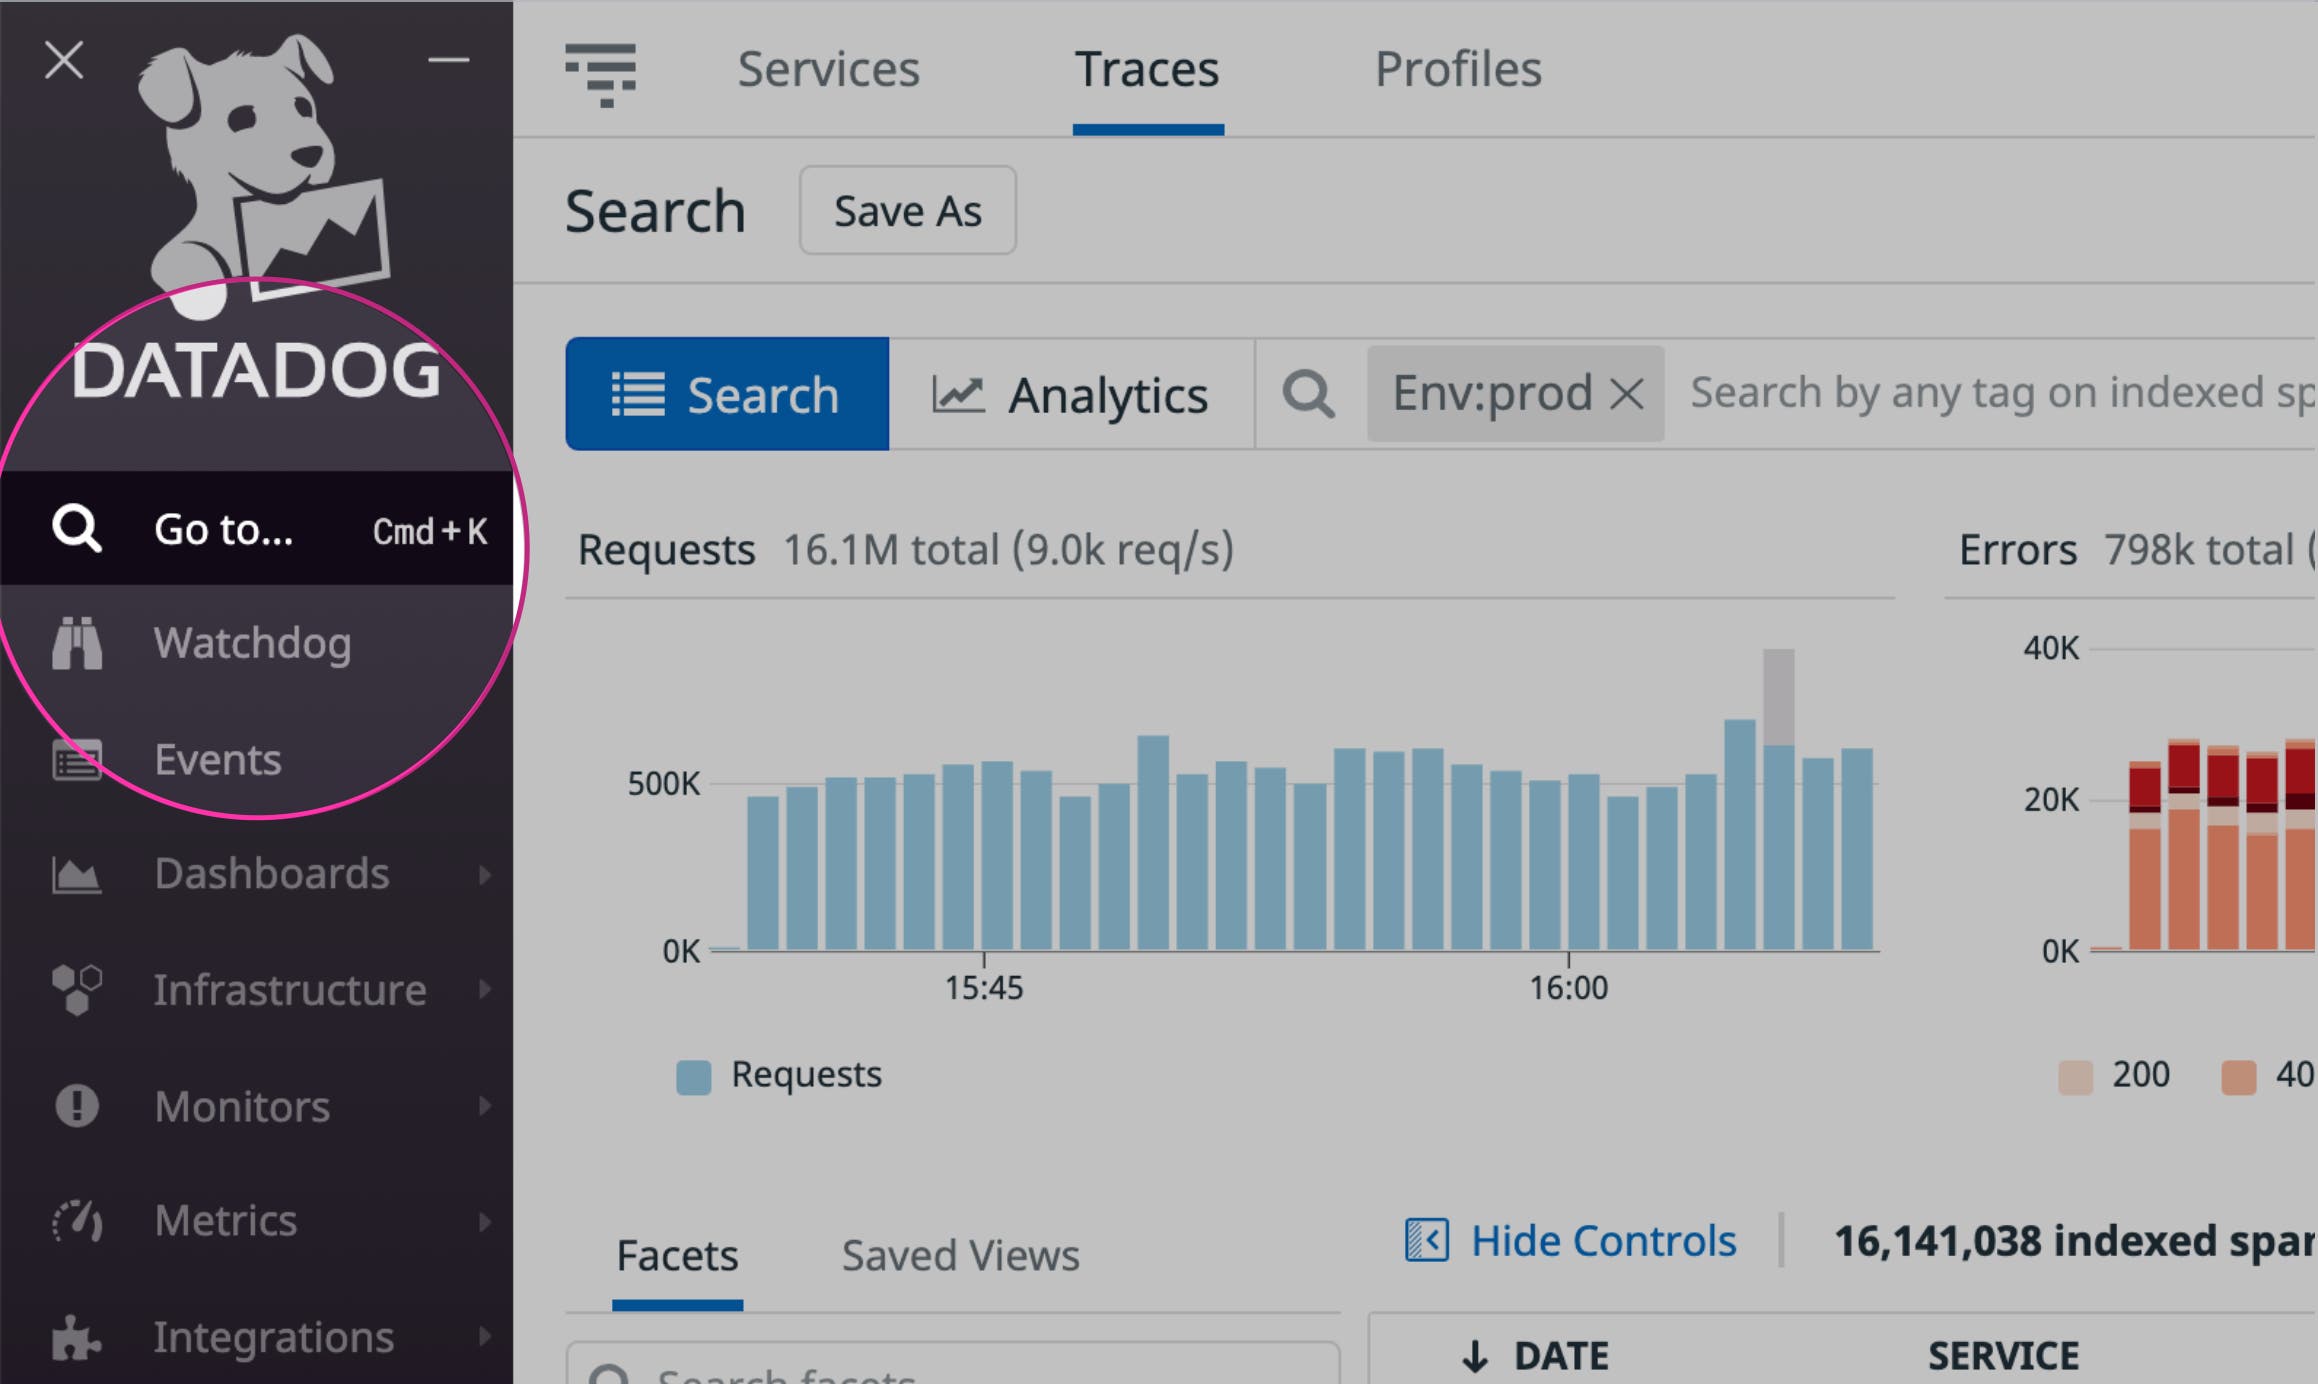
You can access the quick navigation menu from anywhere within Datadog by using the keyboard shortcut cmd+K on macOS and ctrl+K on Windows and Linux. At the top of the menu are shortcuts to access the Widget Clipboard and to create a new dashboard. This makes it easy to use the quick nav menu to seamlessly copy and paste widgets or entire dashboards from different parts of Datadog so you can create, edit, and combine rich visualizations of all your monitoring data.
Find your key resources
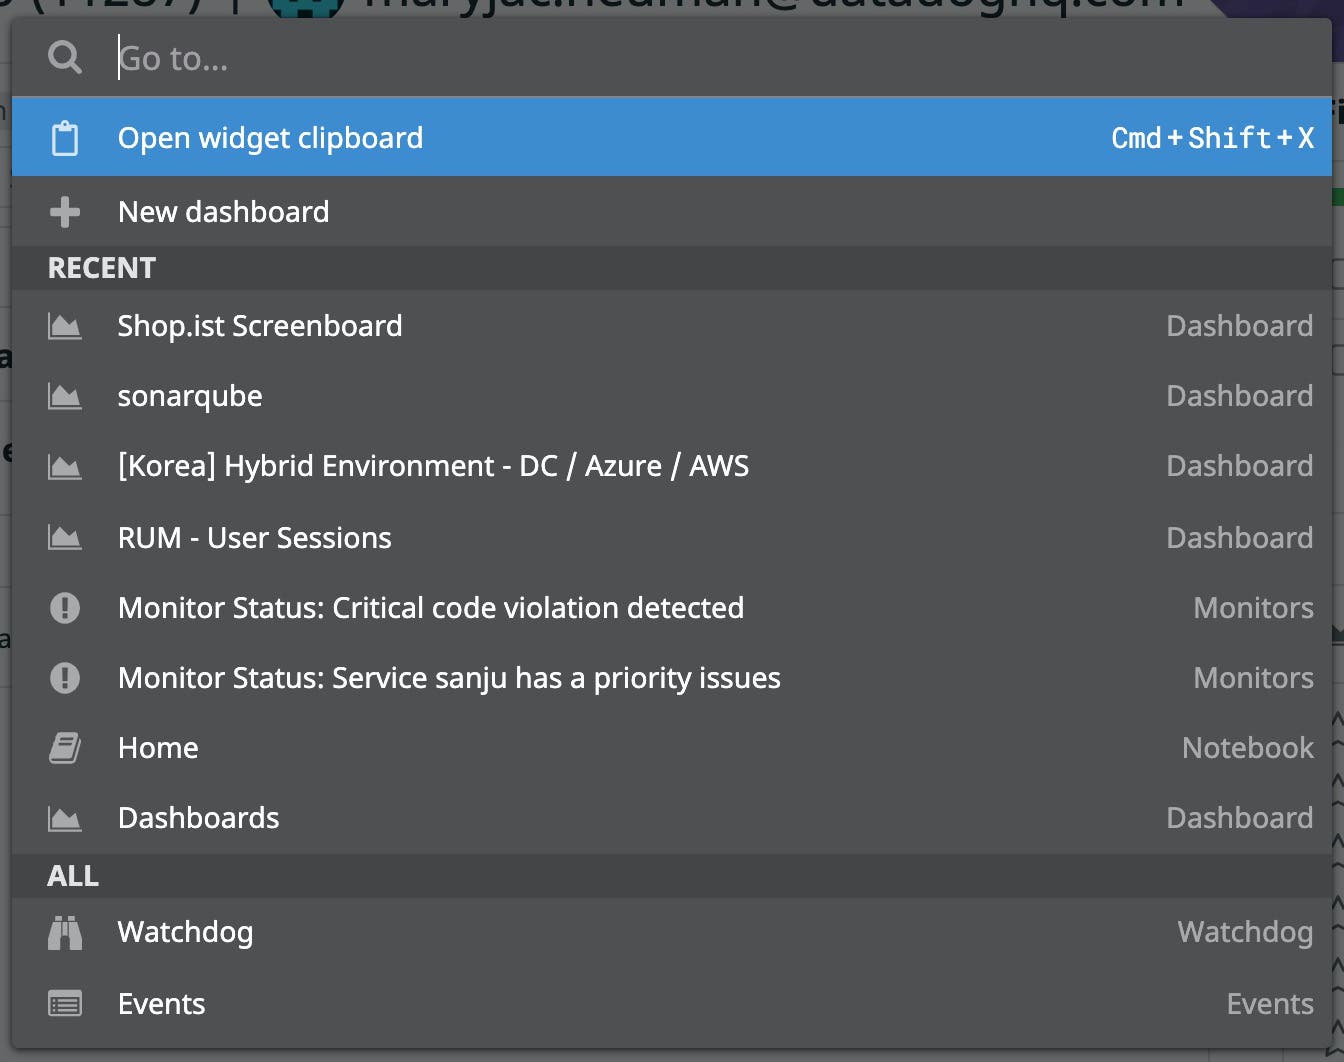
Under RECENT, the quick nav menu lists your most recently visited views within Datadog, including individual dashboards and monitors. This surfaces the parts of Datadog that you rely on most so you have instant access to the specific resources you need to monitor and troubleshoot issues within your environment.
Below are links to all the major features in Datadog, so you can quickly find whatever monitoring data you need at that moment.
Everything you need in one place
To make it easier to find the exact Datadog page you need in the moment, you can use the search bar at the top of the quick nav menu. Datadog filters the list based on your search, updating the results in real time so you can find the page or dashboard you want with just a few keystrokes. This means, for example, you can quickly locate all of the resources related to monitoring a specific service or technology by searching its name.
Quick-navigate between your Datadog resources today
The quick navigation menu is now available everywhere in the Datadog app, so you can start using it to speed up your monitoring workflows today. If you’re not a customer already, start your 14-day free trial.
