


Anjali Thatte

Jordan Obey
As organizations bring more AI and LLM workloads into production, the underlying GPU infrastructure that supports these workloads becomes even more critical in ensuring these workloads remain fast, reliable, and scalable. Inefficient GPU resource usage, for instance, can lead to longer runtimes and reduced throughput, negatively impacting overall model performance. Additionally, idle and underutilized GPUs can quickly drive up costs and lead to needless spending.
Datadog GPU Monitoring can help you avoid these issues by providing a centralized view into GPU fleet health and utilization, enabling teams to quickly troubleshoot failures, avoid overprovisioning, and reduce idle GPU spend. With GPU Monitoring, you can detect GPU chip and network failures that impact workload performance, visualize how GPUs are used by each individual workload, and make fast, informed provisioning decisions across your fleet to maximize performance while maintaining cost efficiency.
Monitoring your entire GPU fleet across cloud, and on-prem
Automatically available once you’ve installed our Agent, Datadog GPU Monitoring provides comprehensive visibility into your entire GPU fleet—whether deployed across one of the major cloud providers, hosted on-premises, or provisioned through GPU-as-a-Service platforms like Coreweave and Lambda Labs.
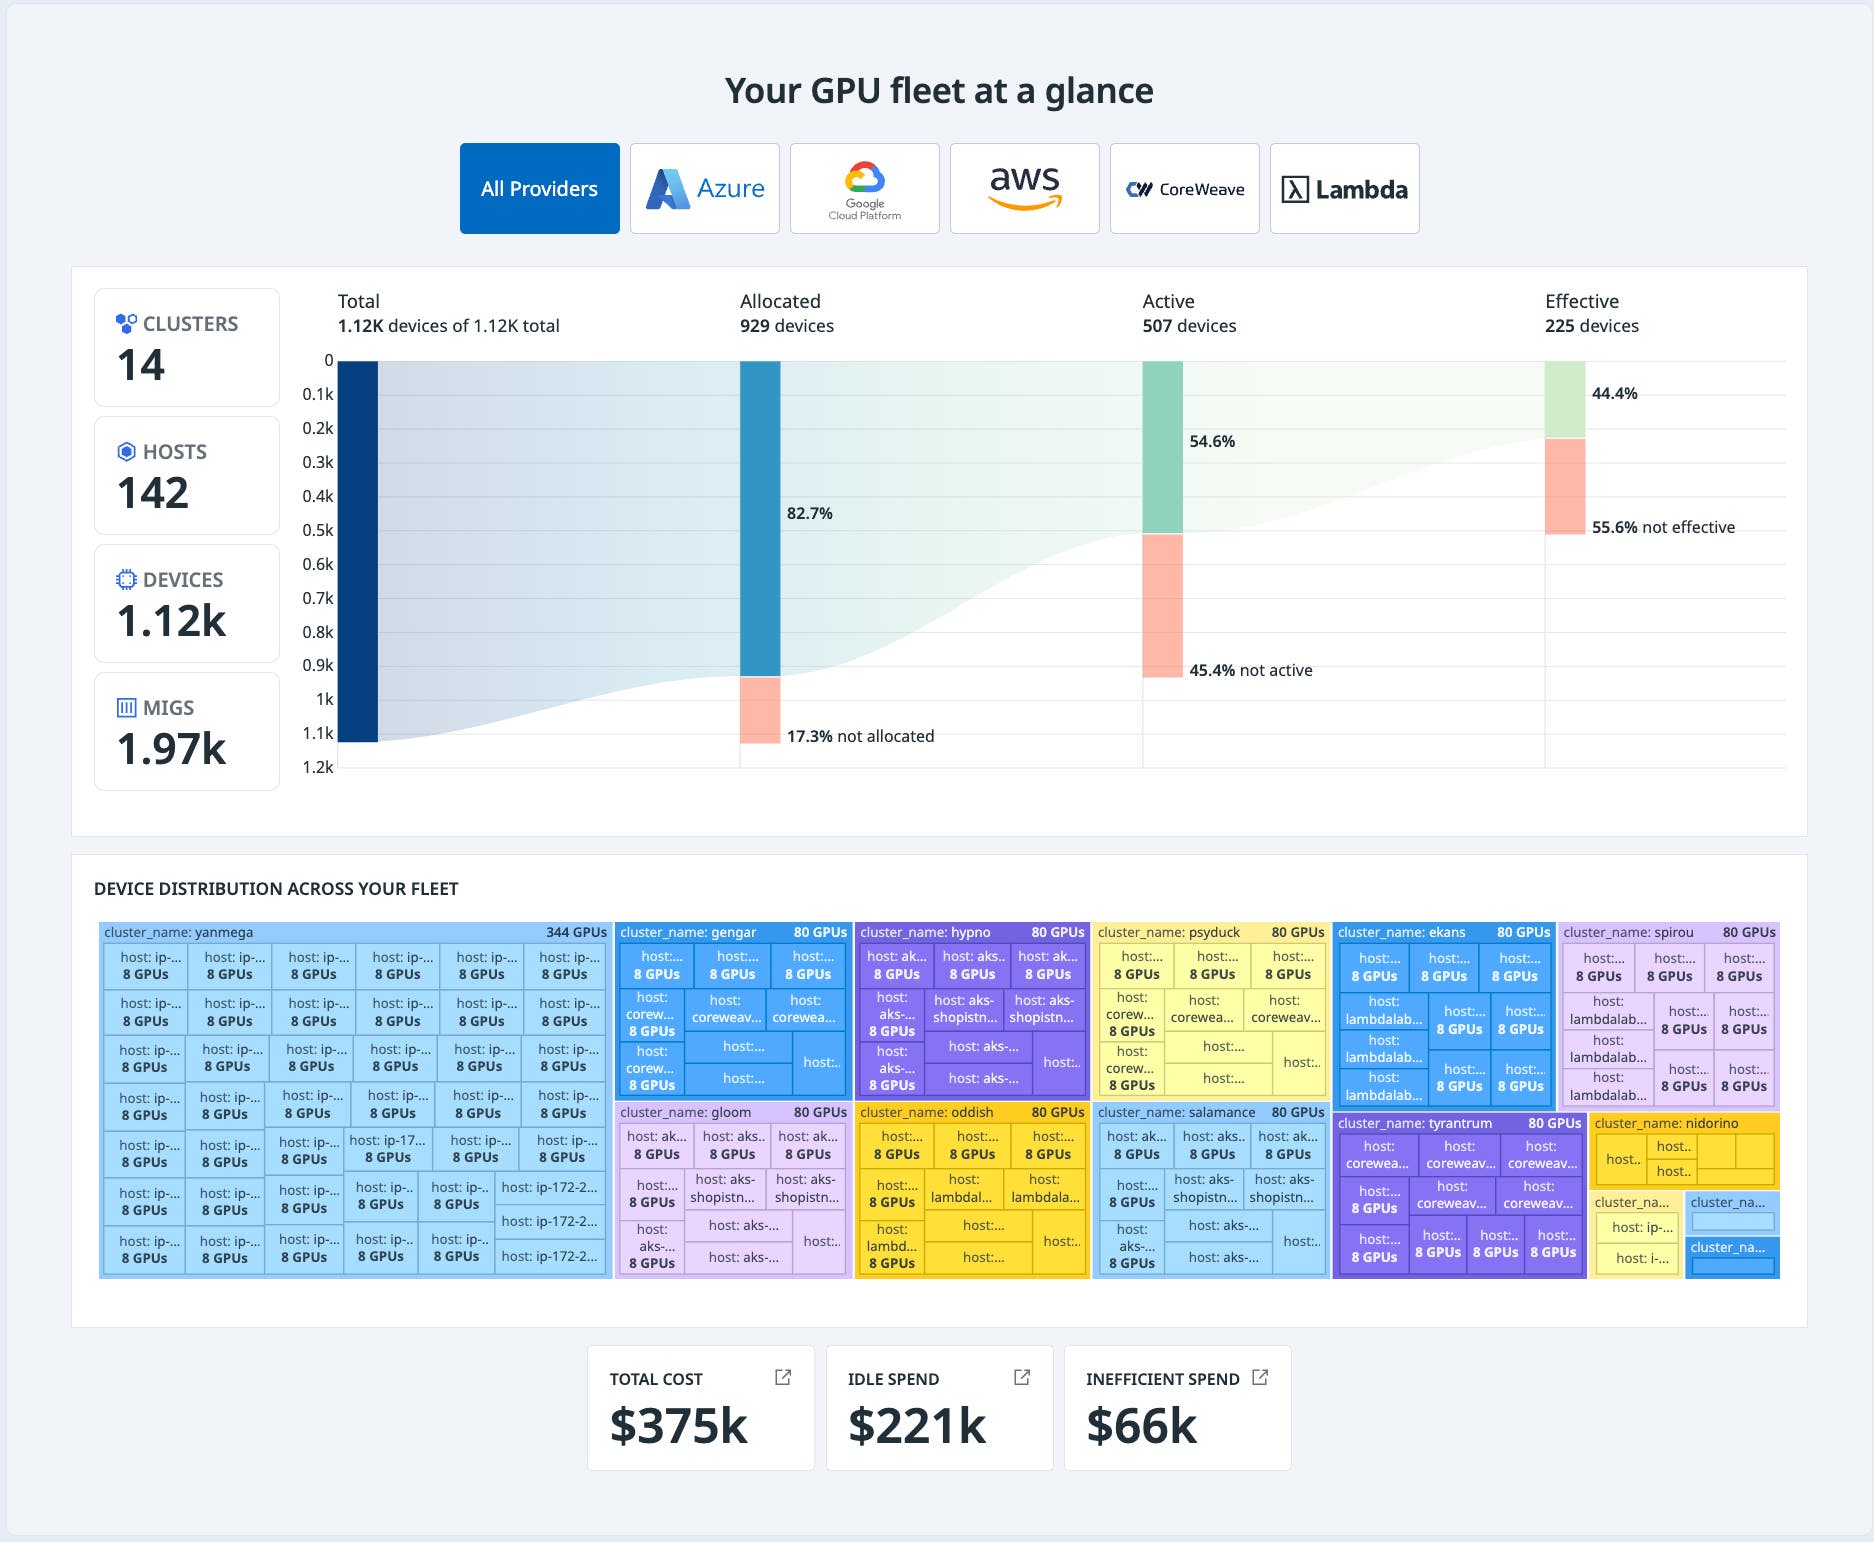
From the GPU Monitoring overview, you can drill down from cluster-level summaries to individual hosts, chips, and Multi-Instance GPU (MIG) slices. This level of visibility means you can quickly identify where performance issues or inefficiencies are occurring within your infrastructure.
Given that GPU represents the highest share of infrastructure costs for AI workloads, understanding how they are used is critical. Datadog helps teams quantify total GPU spend over any time period while highlighting inefficiencies such as idle devices or underutilized GPU cores, so you can make cost-conscious, performance-driven decisions.
Troubleshoot failed AI workloads due to GPU constraints
AI workloads place unique, dynamic demands on GPU infrastructure. Unlike traditional applications, LLM jobs can spike resource usage unpredictably, requiring precise alignment between available GPUs and incoming workloads. Without real-time visibility, teams risk both over-allocating GPUs that sit idle and under-provisioning resources that stall critical jobs.
Datadog GPU Monitoring can help improve the operational efficiency of your GPU fleet by surfacing issues such as resource contention, over-allocation, and unmet workload demands. By giving ML engineering and compute teams real-time insight into availability and saturation, Datadog enables faster root cause analysis and resolution of provisioning-related failures.
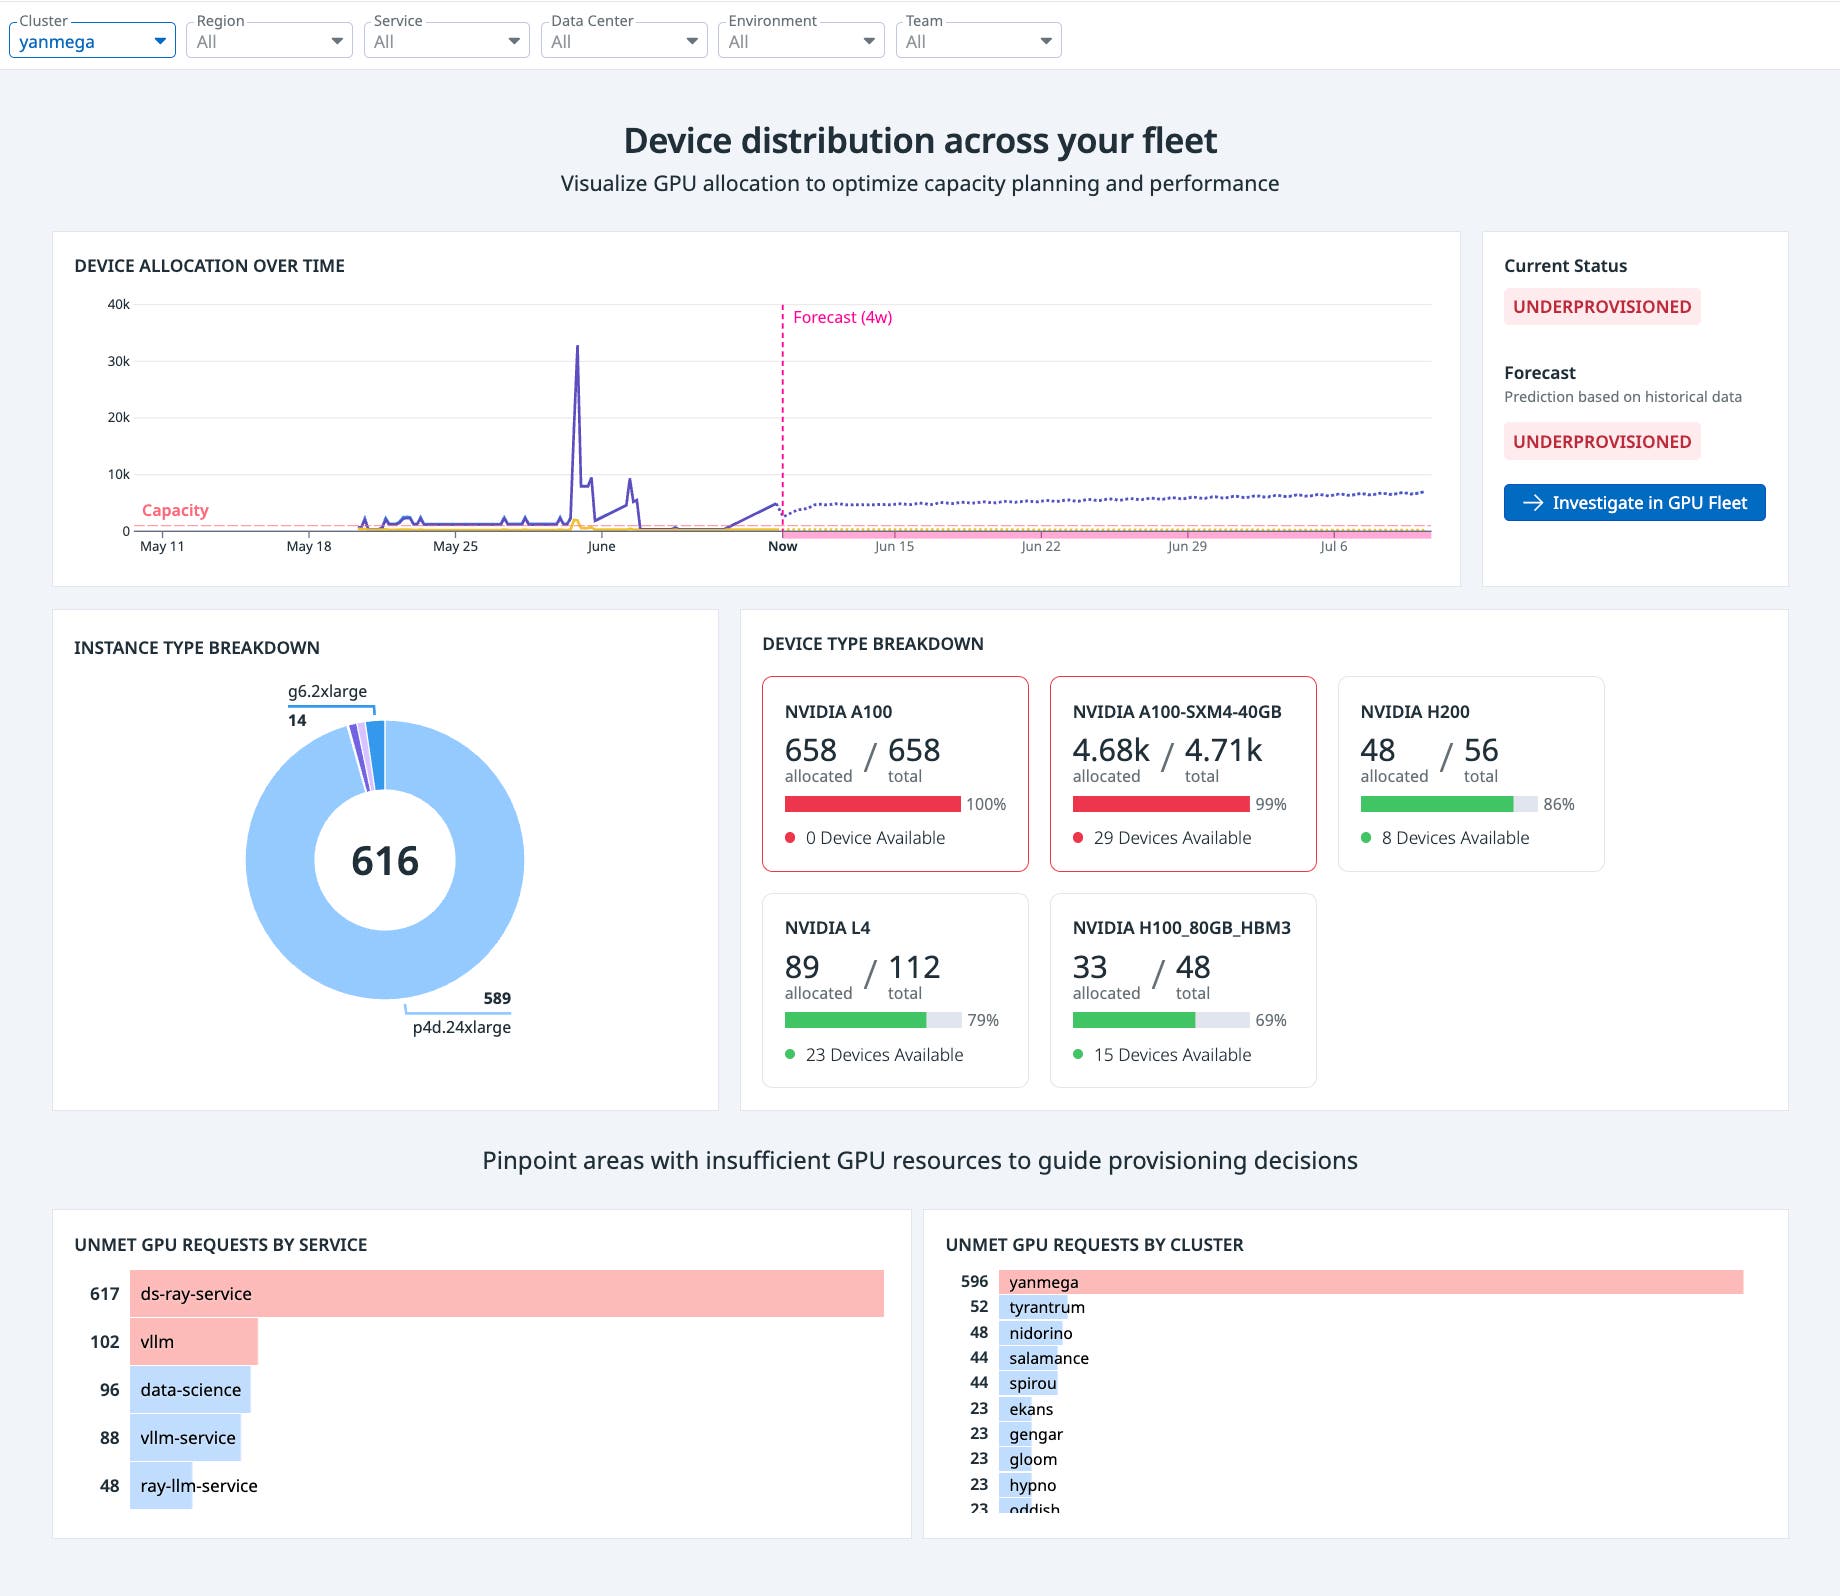
For instance, let’s say Ray services in a training cluster are stuck in a pending state and failing to launch. You open Datadog GPU Monitoring and see a spike in unmet GPU requests tied to those Ray services, concentrated in a cluster called yanmega. Filtering down to that cluster, the overview shows available GPUs—but the A100 pool is fully saturated. Switching to a historical view reveals that allocation requests are consistently hitting the upper limit, and Datadog forecasts a shortfall of some A100 GPUs within the next few days.
Identify and eliminate wasted GPU spend
GPU infrastructure is expensive, and without clear visibility into how resources are used, teams often end up overspending either by leaving GPUs idle or underutilizing active ones. Tracking these inefficiencies across clusters is especially difficult at scale.
Datadog GPU Monitoring helps teams uncover inefficiencies across their GPU infrastructure by tying usage metrics directly to cost. You can see how much each cluster, node, and GPU device is spending, how much of that spend is tied to idle resources, and whether active GPUs are being used efficiently.
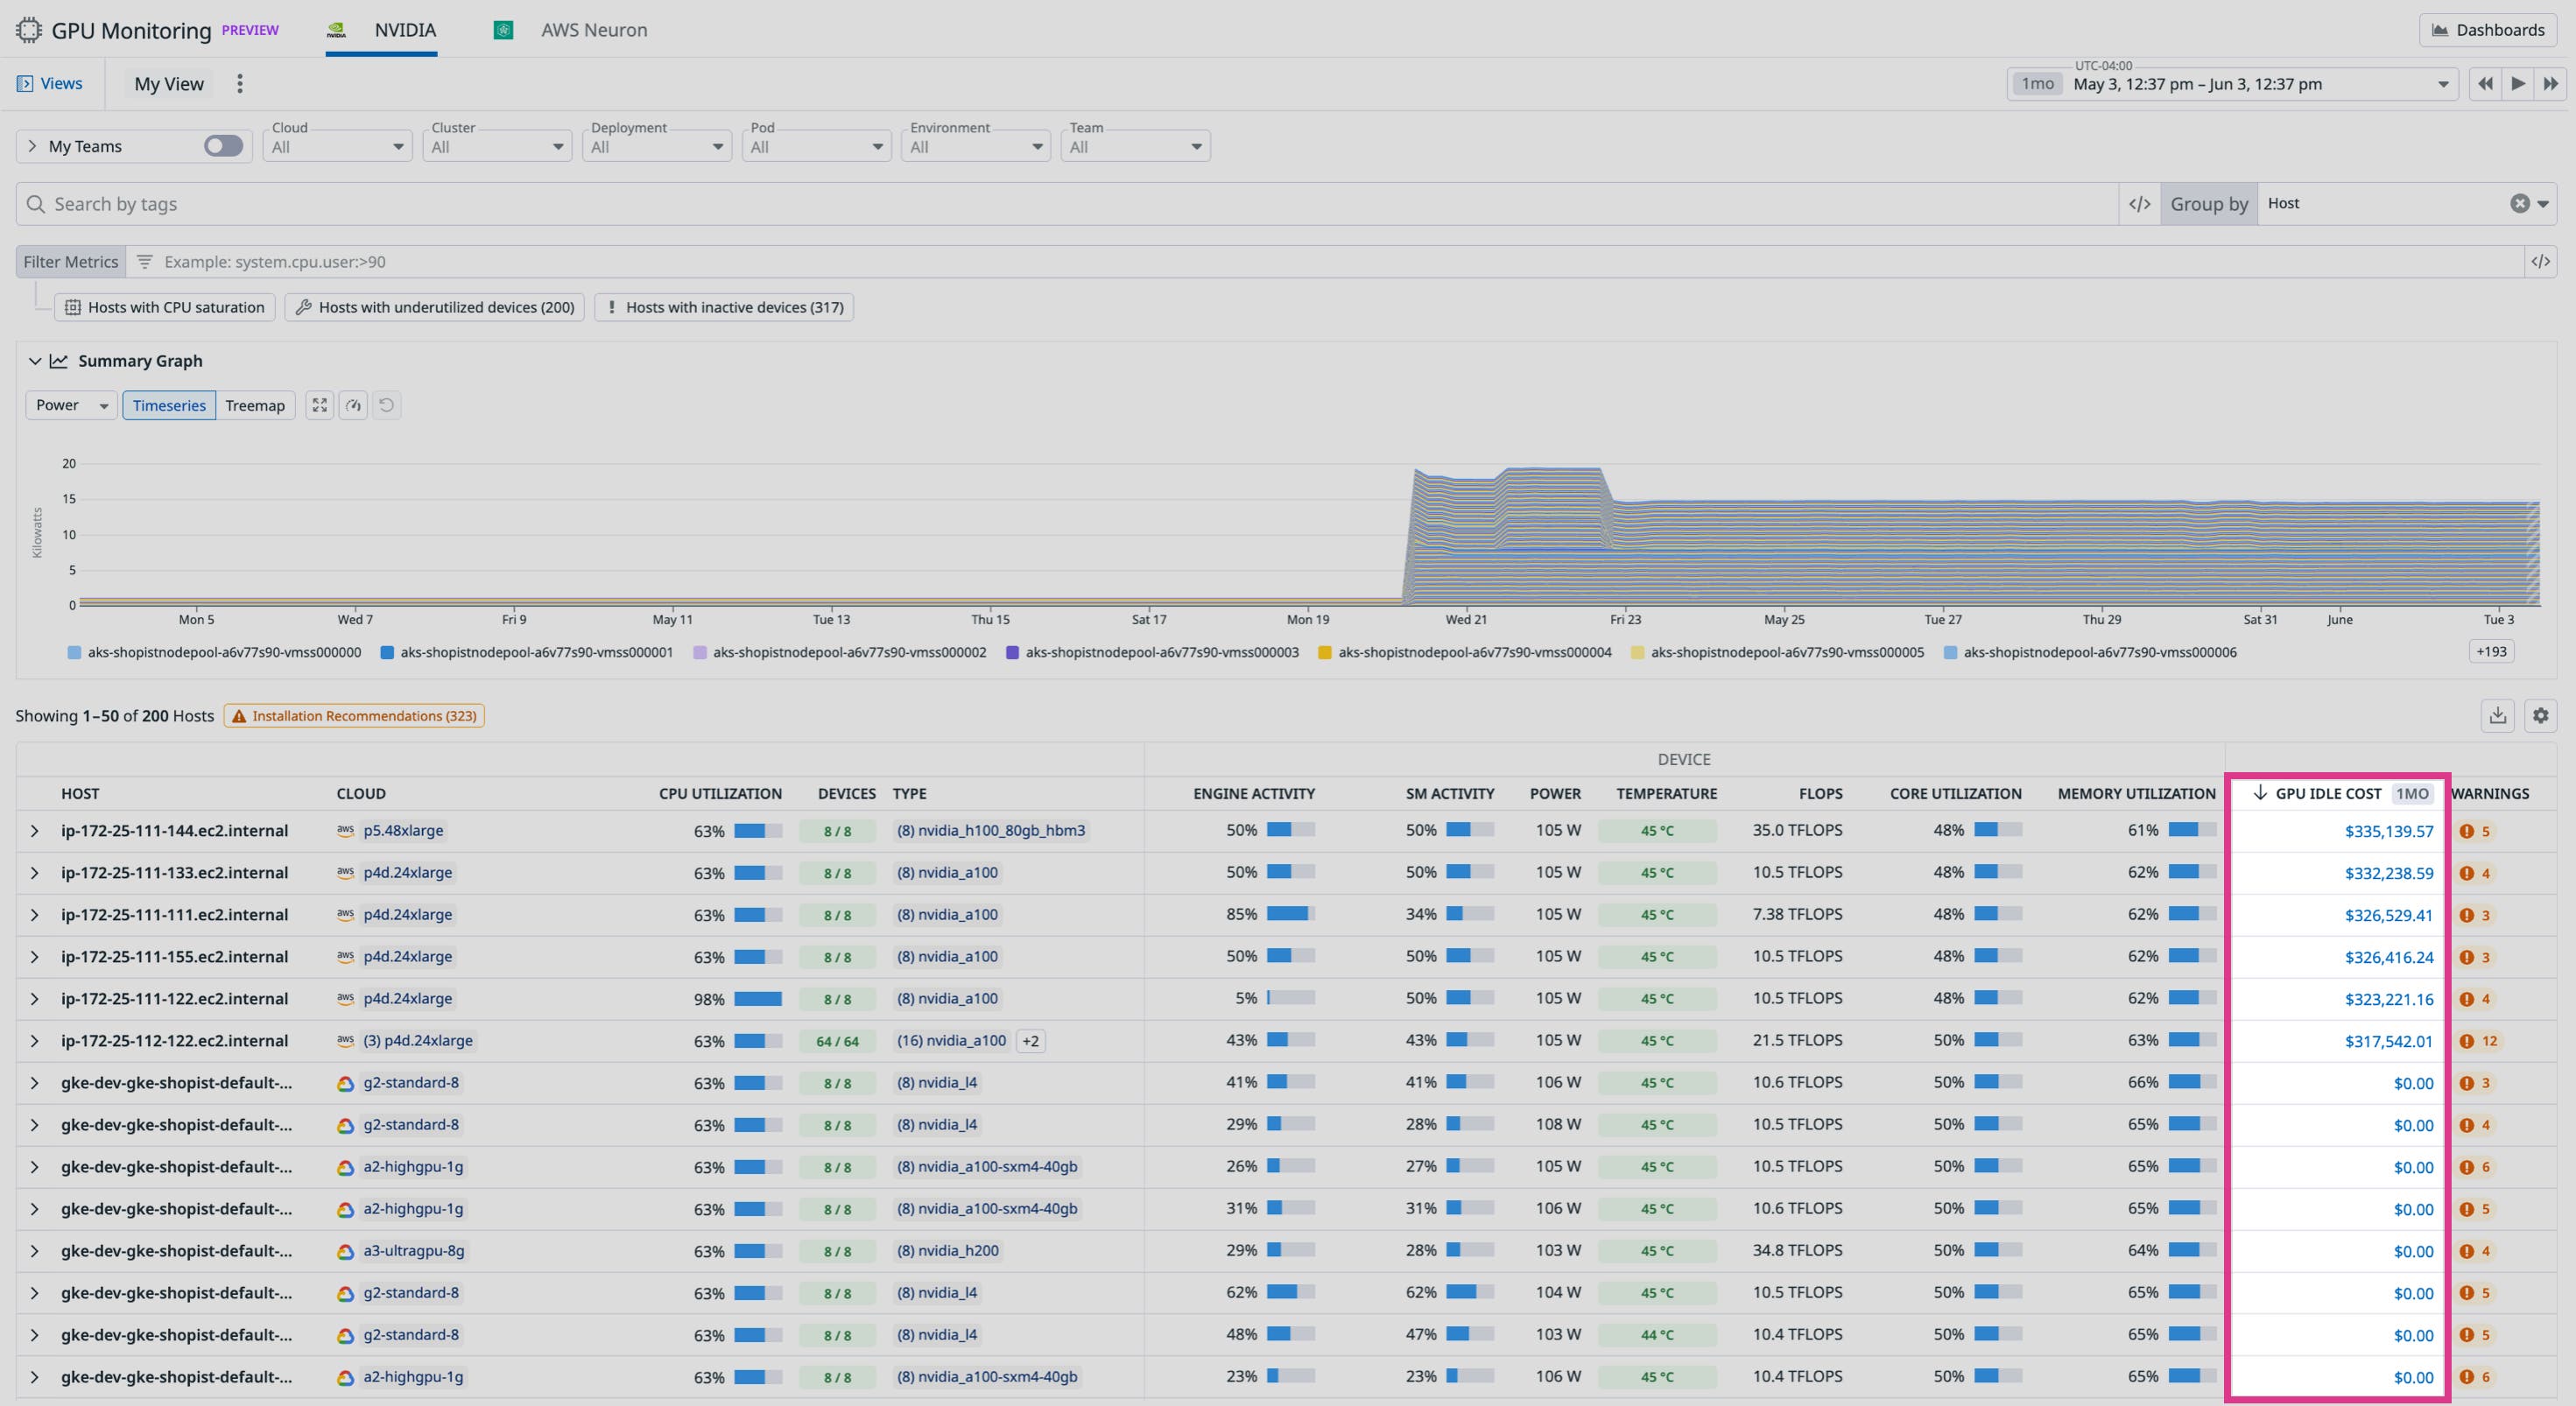
From the Fleet page, you can sort devices, hosts, and clusters by total GPU cost and drill into the most expensive ones to understand what’s driving the spend. Datadog breaks this down into total GPU cost, idle GPU cost, and active-but-inefficient usage. For instance, if a FinOps team flags a spike in GPU costs and asks for help finding optimization opportunities, you can open GPU Monitoring and sort your hosts by total spend.
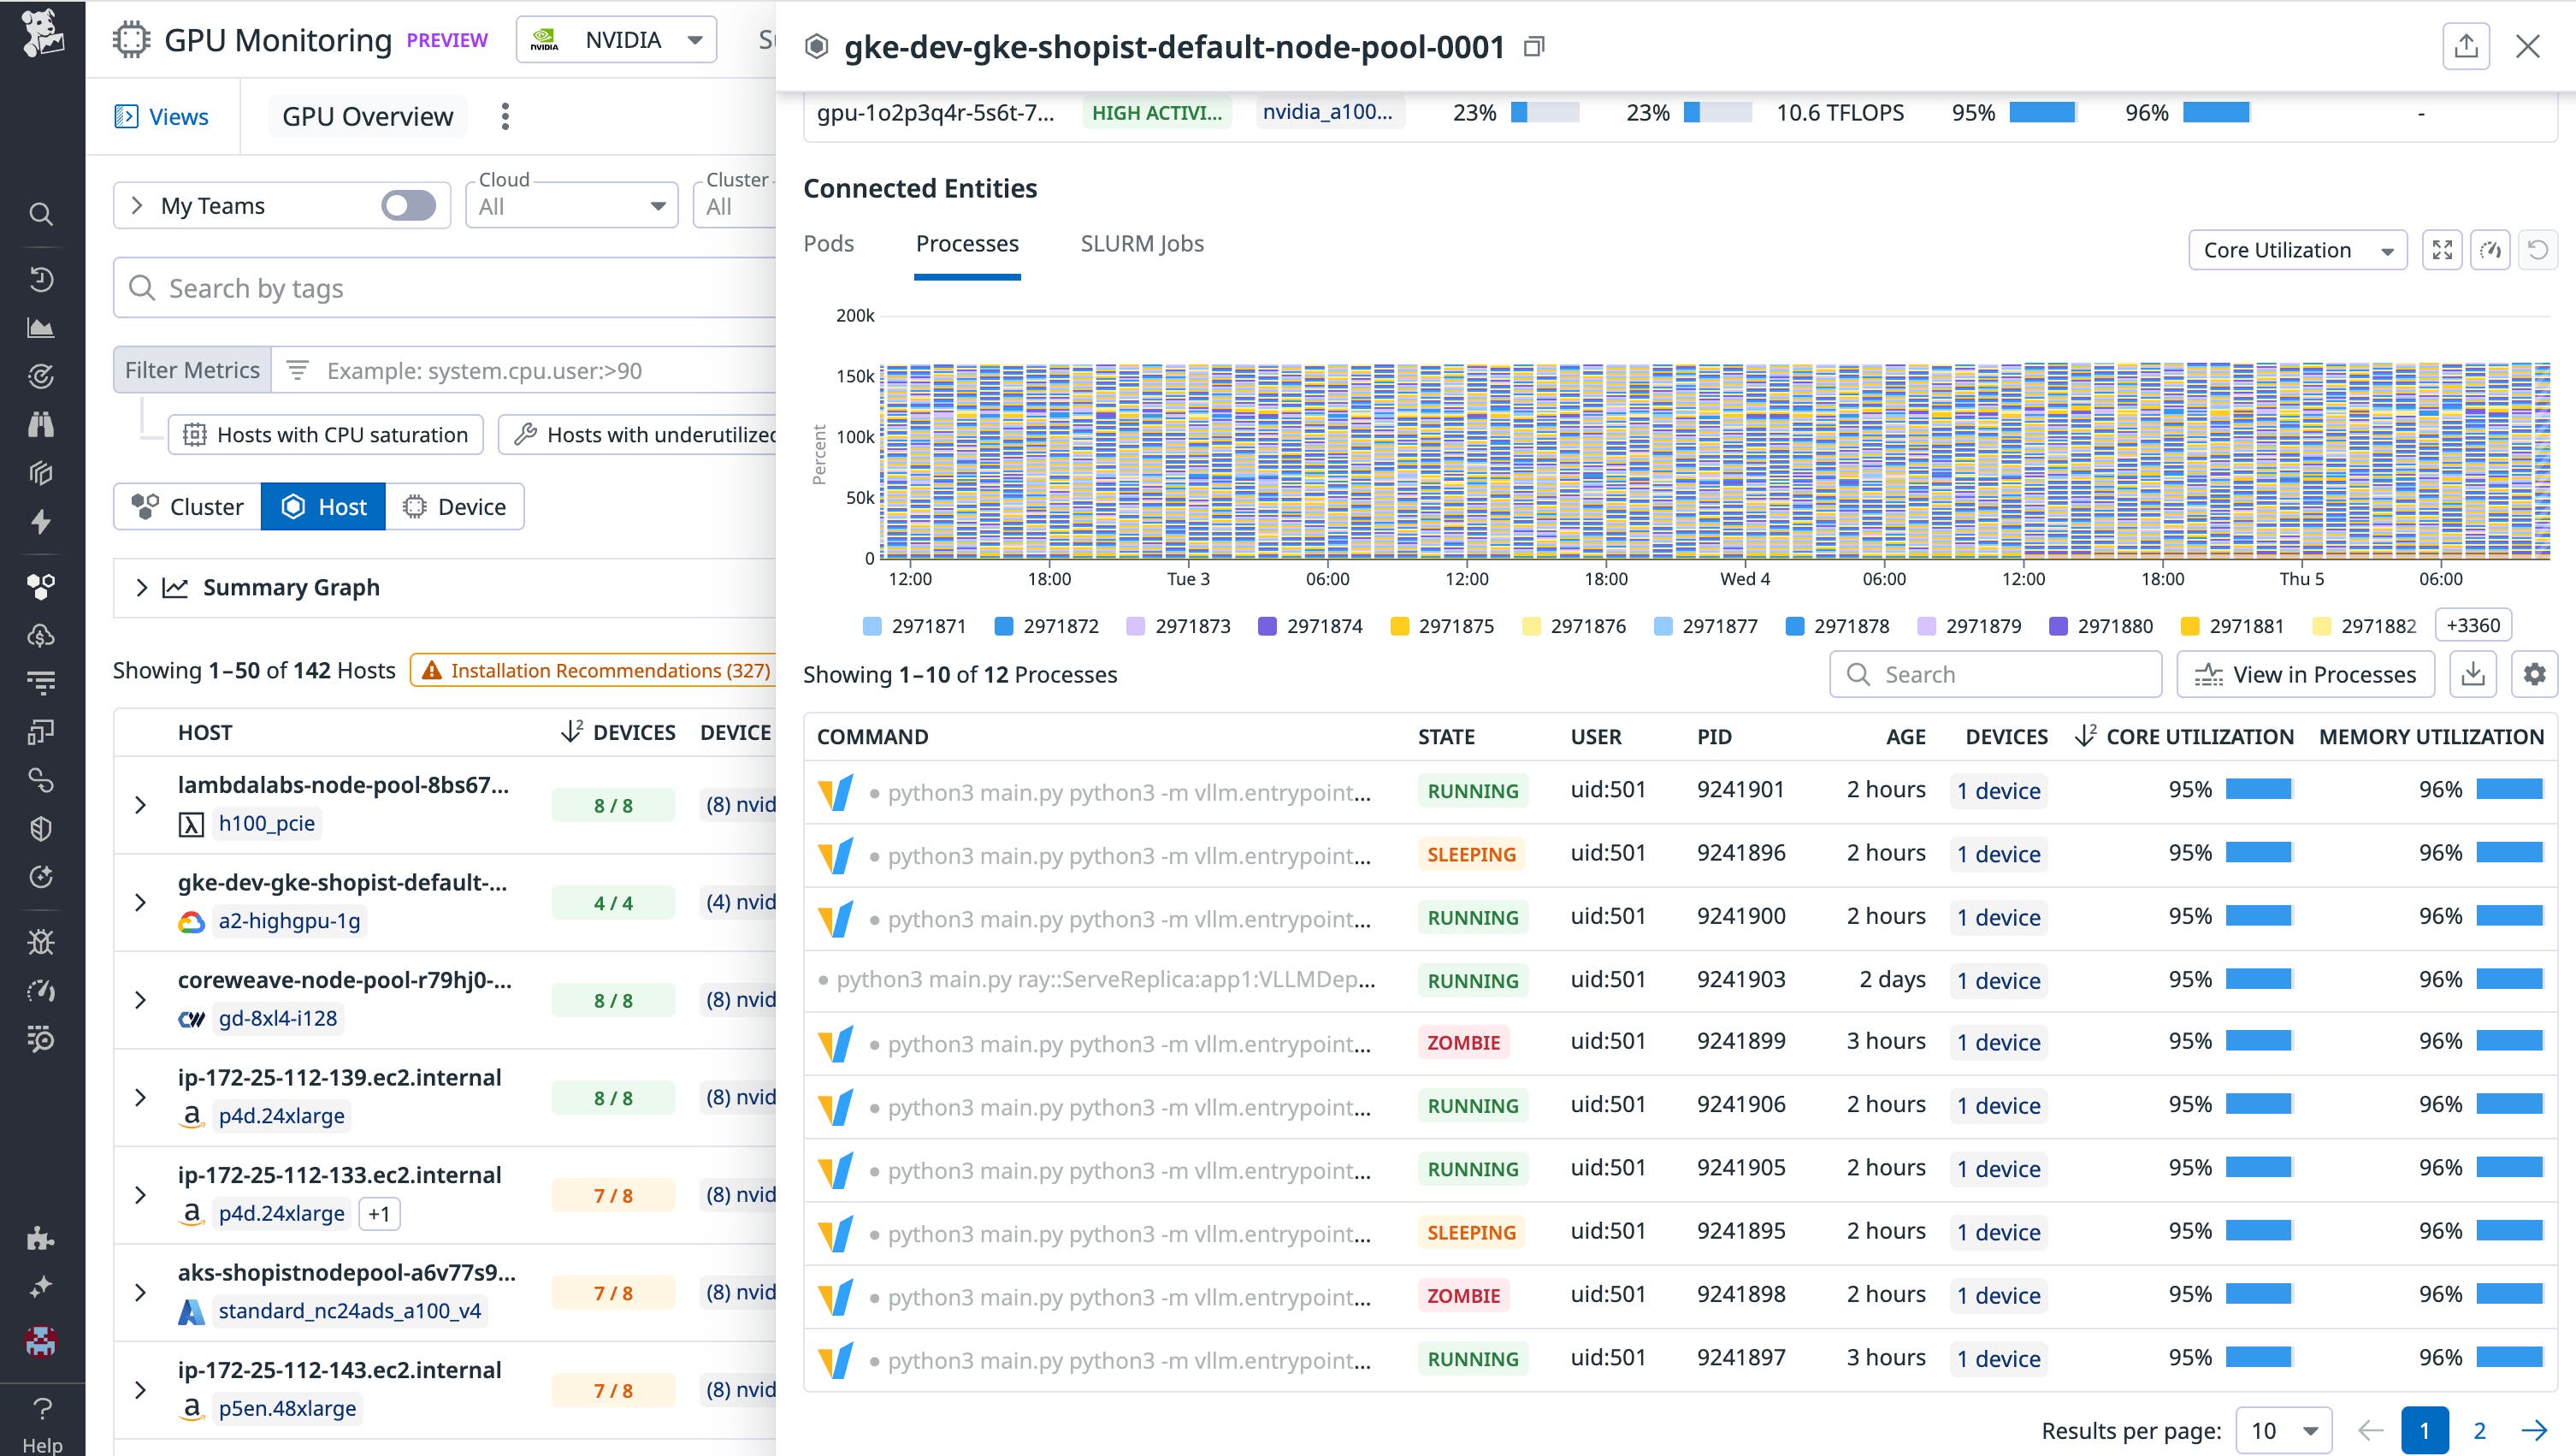
From here you may see that the top cluster shows that 20 percent of GPUs are idle but among the 80 percent that are in use, only 15 percent are utilizing their cores efficiently. That means the majority of the cost is going toward workloads that are running but underutilizing the hardware. Drilling down, you find a pod that’s been reserving eight GPUs over the past two days. GPU memory is in use, but core utilization has averaged only 25 percent. With that insight, you can reach out to the pod owner to consolidate the workload onto fewer devices or shut it down entirely if it’s no longer needed. Datadog also shows other workload inefficiencies like zombie processes and long-running Slurm jobs so we can connect cluster and node level cost to specific resource usage per workload.
This level of visibility helps you connect wasted cost directly to specific workloads, users, or services, enabling teams to take targeted action, improve GPU efficiency, and reduce spend without slowing down critical AI projects.
Detect hardware and networking issues impacting performance
Not all GPU slowdowns stem from provisioning gaps or inefficient workloads. Sometimes the root cause lies in the underlying hardware or network connections that enable data movement between nodes and devices. Datadog GPU Monitoring helps surface these hidden issues by providing telemetry data on both GPU hardware health and GPU-to-GPU or node-to-node communication.
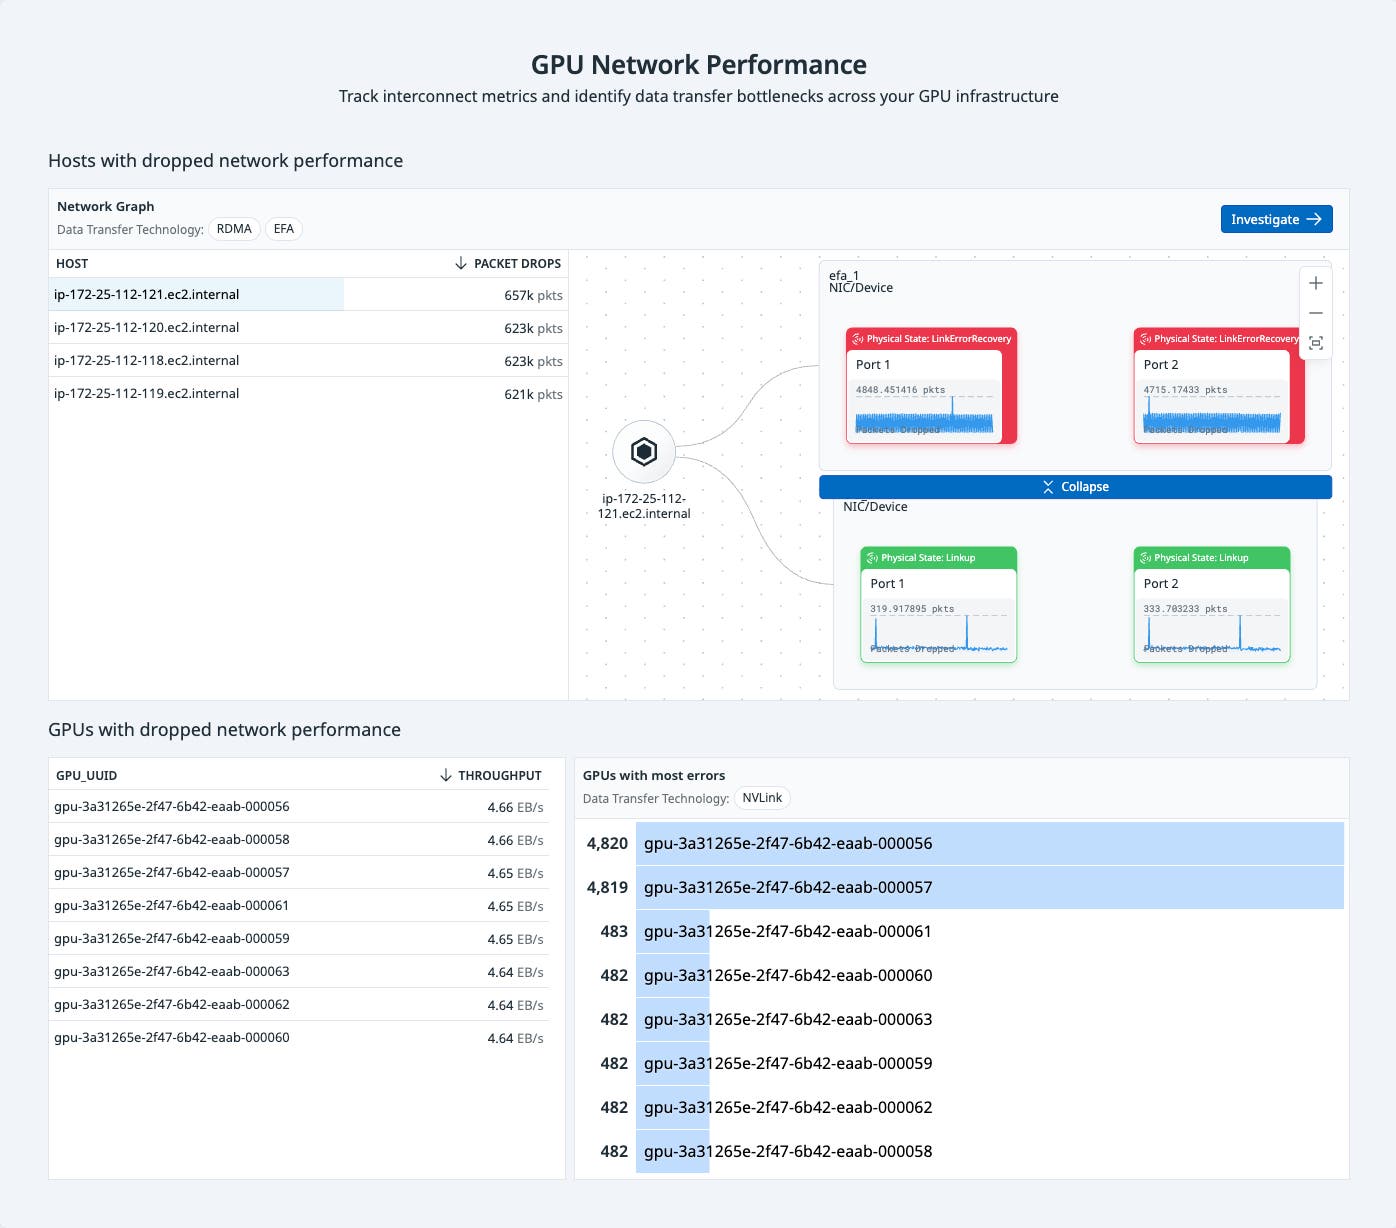
Let’s say your ML team reports that training jobs are taking 12 hours instead of the usual three. They’ve ruled out code or model problems, so you open Datadog GPU Monitoring to investigate possible infrastructure issues. From the Summary page, you check the RDMA, Infiniband, and EFA interconnects between your nodes along with NVLink connections between GPUs within the same host. You notice a subset of hosts showing elevated congestion in the RDMA subnet. One host, in particular, shows the steepest drop in throughput.
Clicking into that host brings up its side panel. There, you see a spike in dropped packets while data was being transmitted. Drilling deeper reveals that Port 1 on Network Interface Card 2 recently went into a Linkdown state and is responsible for the bulk of the packet loss. The associated drop in transmit/receive throughput lines up with the ML team’s reports, indicating a 40 percent throughput reduction tied directly to this port failure.
This kind of issue can severely impact data flow to and from GPUs, leading to GPU data starvation and extended training times. By identifying the degraded port, you can reset the RDMA connection or reroute traffic through a working interface, helping restore workload performance without guesswork.
Datadog GPU Monitoring enables teams to detect and diagnose low-level hardware and networking issues that would otherwise go unnoticed, ensuring that performance bottlenecks don’t derail critical AI workloads.
Get started with monitoring your GPUs today
GPU infrastructure is a critical performance and cost factor as AI and LLM workloads scale, but teams often lack visibility into how resources are used. Datadog GPU Monitoring helps teams detect underutilized or idle GPUs, tie usage directly to cost, and resolve issues like over-allocation, saturation, or hardware degradation.
Teams can troubleshoot failed workloads, forecast GPU shortages, and eliminate waste without slowing down model performance. By surfacing both workload-level inefficiencies and low-level hardware bottlenecks, Datadog enables cost-efficient, high-performing AI infrastructure at scale. To learn more, sign up for a Preview.
Not a Datadog customer? Get started with a 14-day free trial today.


