Alexis Lê-Quôc
We are excited to be part of Docker’s Ecosystem Technology Partner (ETP) program. Docker is a popular open platform for distributed applications to build modern applications with microservices. The promise to run the same code bit-for-bit between environments has turned continuous delivery from an ideal into a reality. Datadog has been supporting Docker since its pre-1.0 days via our Datadog Agent.
How Docker performance monitoring works
To keep deployment and management simple the Datadog Agent is perfectly happy to run in its own container on a host and monitor all of the other containers that run on that host.
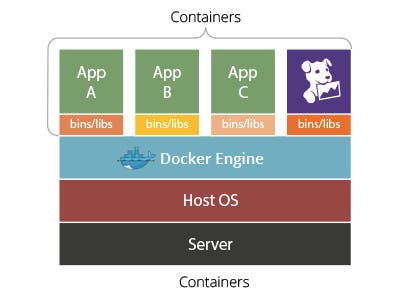
Since Docker uses existing kernel constructs (namespaces and cgroups) in order to run containers, the Datadog Agent uses the native cgroup accounting metrics to gather CPU, memory, network and I/O metrics of the containers every 15 seconds before they are forwarded to Datadog.
Monitor many containers effortlessly with tags
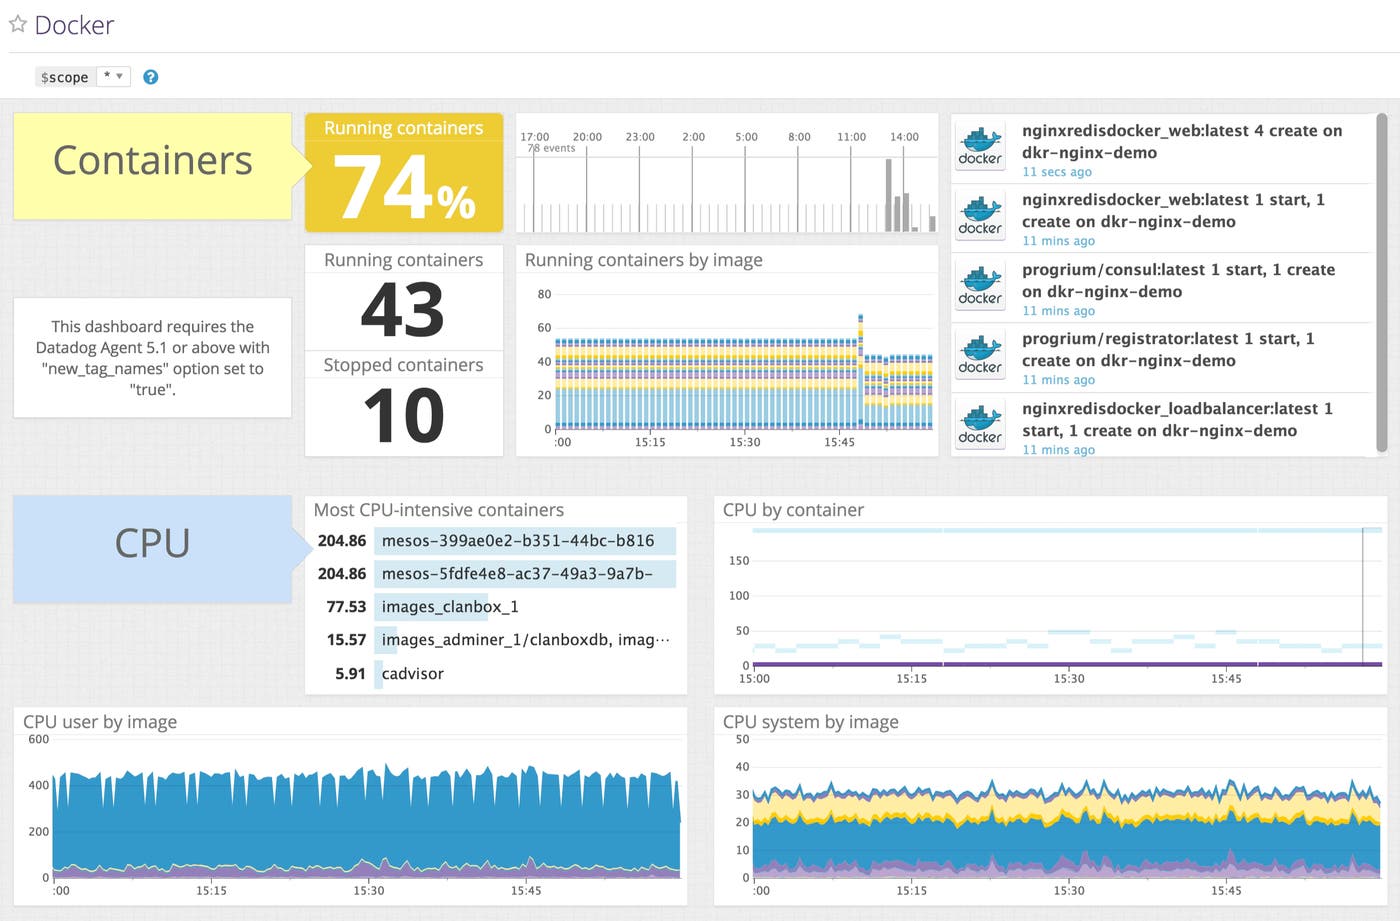
With easy-to-use, lightweight containers, you will likely dial up several times more running containers than the number of underlying hosts in your infrastructure. Datadog allows users to track and monitor all of them using tags.
Tags are the key to monitoring a lot of containers without additional effort. By default, the Agent will monitor your containers and turn the Docker “name”, “image” and “command” attributes into a “tag”.

Graph specific metrics with tags
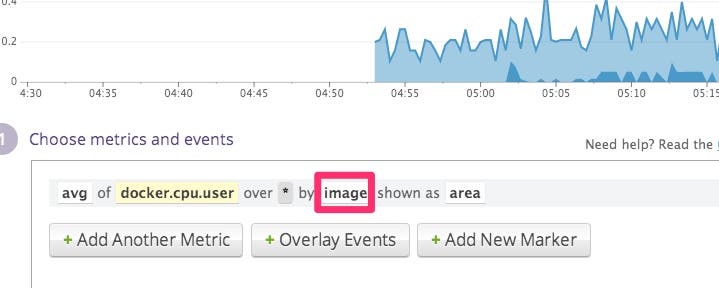
In Datadog, you define the metrics shown in dashboards and graphs based on one or many tags. This allows you to track specific metrics for many containers in aggregate. Using tags, you can easily create a graph for a metric drawn from all containers running a given image.
In the example below, we are showing the amount of CPU consumed, broken down by image.
Alerts
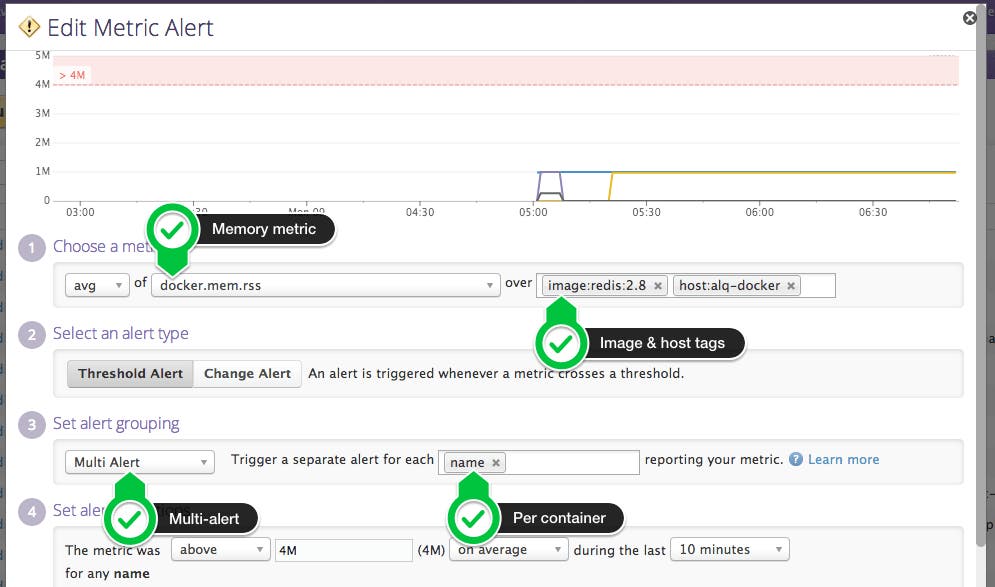
Tags are also very useful to define alerts that span clusters of containers. For instance, let us say that you are running a cluster of Redis containers and you want to be alerted when one of the containers is running out of memory.
Instead of defining one alert per container, you only have to create a multi-alert on the docker.mem.rss metric and Datadog will trigger an alert if any container misbehaves.
You can also mix and match tags to express more complex conditions. For instance, you can monitor all Redis containers running the redis2.8 image with a simple tag selection:
Monitor your containers’ lifecycle
Since containers are designed to be as short-lived (or long-lived) as traditional OS processes, it can be very useful to track particular containers throughout their lifecycles.
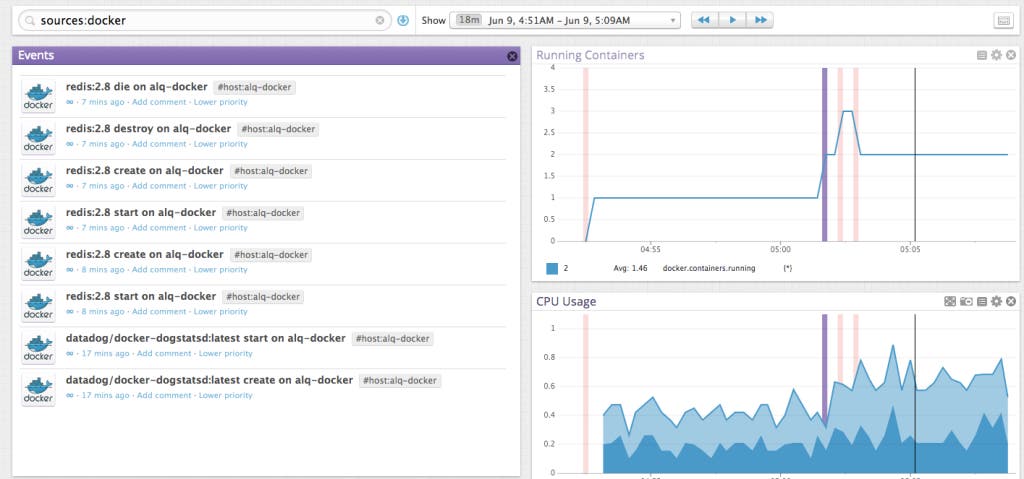
Much like any other meaningful event in your infrastructure, you can search for Docker container create/start/stop/destroy events using the event stream. Simply use “sources:docker” as the search filter.

You can also apply the same search to any timeboard to visualize Docker container events in the context of Docker and non-Docker metrics. In the following example, we overlay containers starting and stopping over memory and CPU metrics.
Explore Docker metrics
To explore the Docker metrics that are available, you can use the Metrics Explorer in Datadog and type “docker” in the first drop-down.
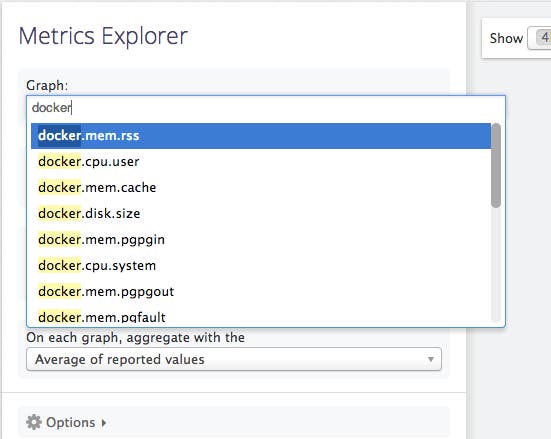
You can find detailed descriptions about all the metrics in Docker’s Runtime Metrics guide.
To monitor Docker in your own environment, sign up for a 14-day free trial of Datadog.
