At Dash 2019, we are excited to share a number of new products and features on the Datadog platform. With the addition of Network Performance Monitoring, Real User Monitoring, support for collecting browser logs, and single-pane-of-glass visibility for serverless environments, Datadog now provides even broader coverage of the modern application stack, from frontend to backend. Read on for details about those releases, as well as numerous other features for monitoring your metrics, traces, logs, synthetic tests, and more.
Serverless Functions
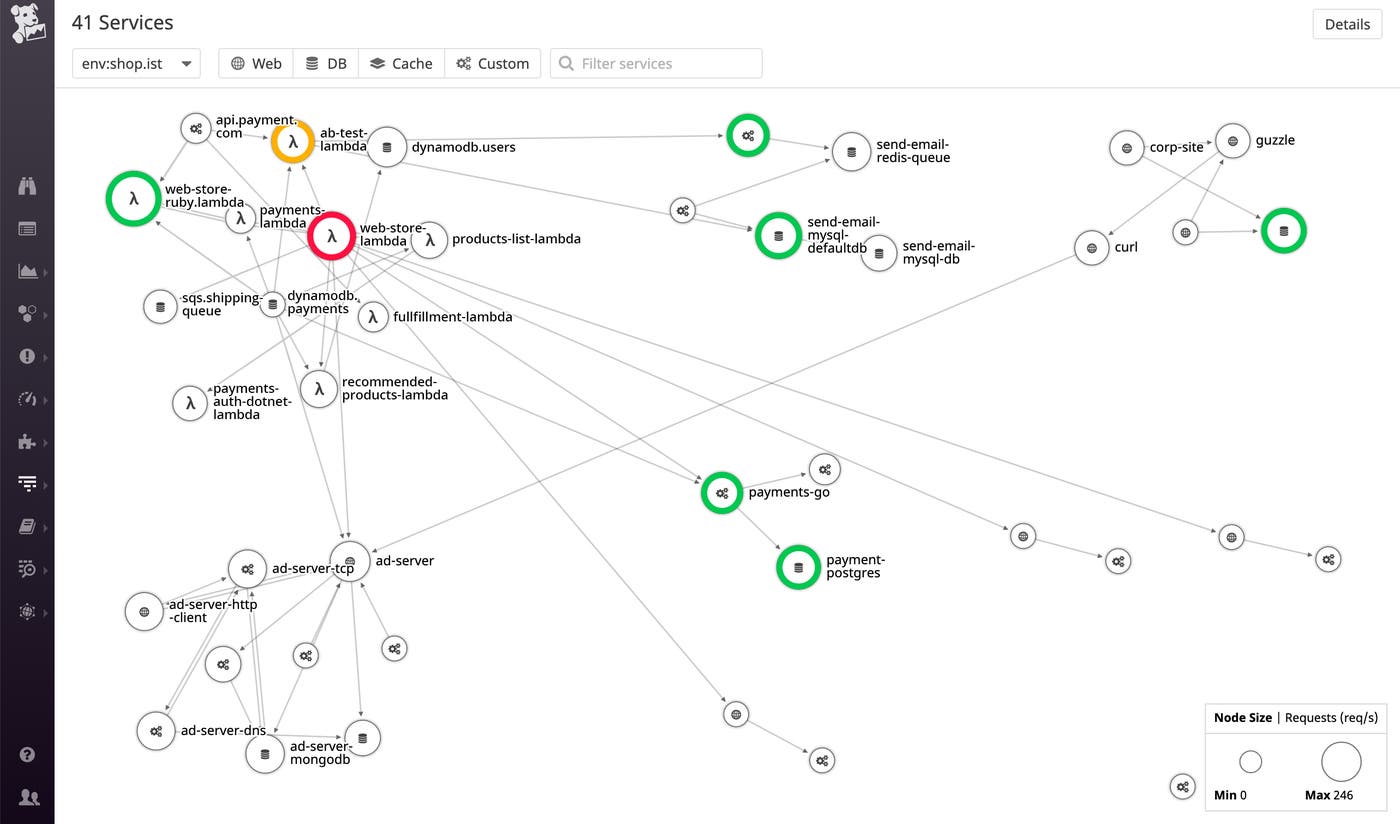
Datadog's Serverless view gives you complete visibility into your code running on AWS Lambda. It provides the same single-pane-of-glass view you've come to expect with Datadog, putting your infrastructure, logs, traces, metrics, dashboards, and alerts all in the same place. Search and filter through each function by cold starts and other metrics; group your Lambda functions by service; visualize Lambda dependencies like API Gateway, DynamoDB, and S3 on the Service Map; and explore full traces of requests involving Lambda, regardless of the origin and destination of those requests. Read more about this product here or get started here.
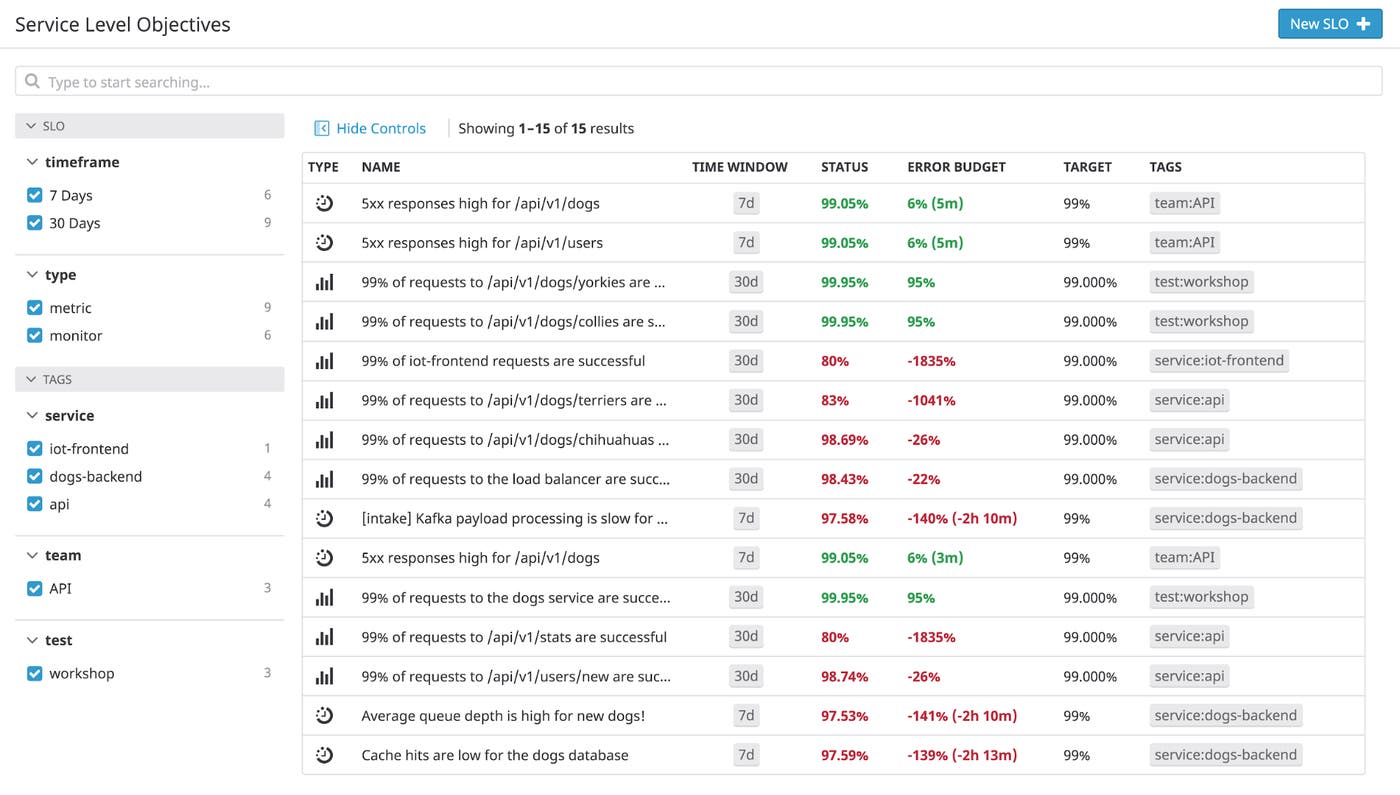
SLOs and SLIs in Datadog
Datadog allows you to easily track SLIs, SLOs, and performance against error budgets in a simple widget that you can embed in your private dashboards or share publicly. To expand your ability to monitor SLOs and SLIs in Datadog, we also announced a new SLO and error budget list view, where you can search, sort, and filter all your SLOs in one place. Learn more about monitoring SLOs in Datadog here.
Browser Logs
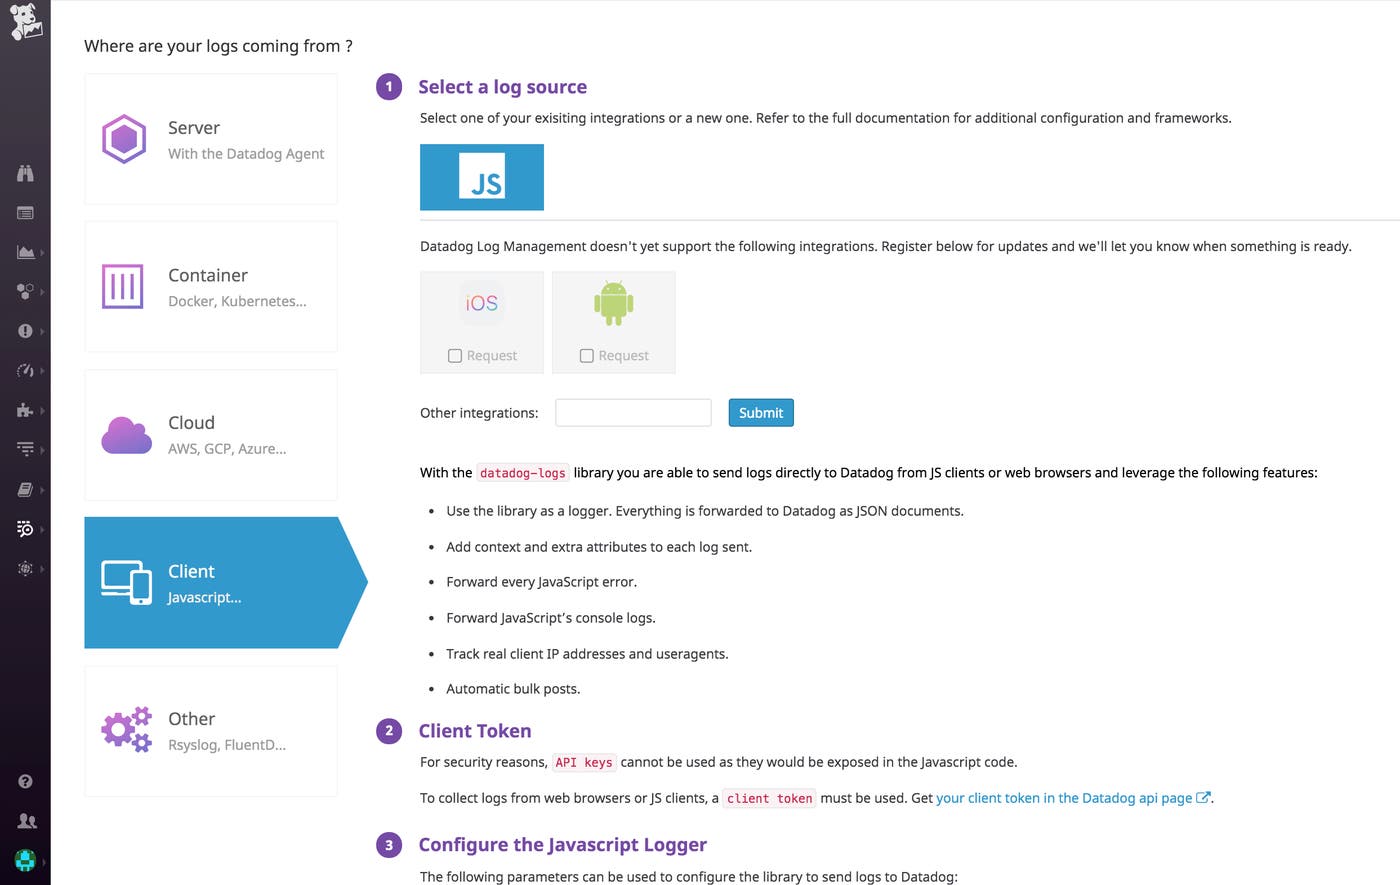
You can now can send logs directly to Datadog from web browsers or other JavaScript clients for full-stack visibility. Using the datadog-logs client-side JavaScript logging library, you can automatically wrap and forward every JavaScript error; and collect, process, and enrich your JavaScript console logs and user agents. Learn more about the JavaScript logging library here and get started here.
Network Performance Monitoring
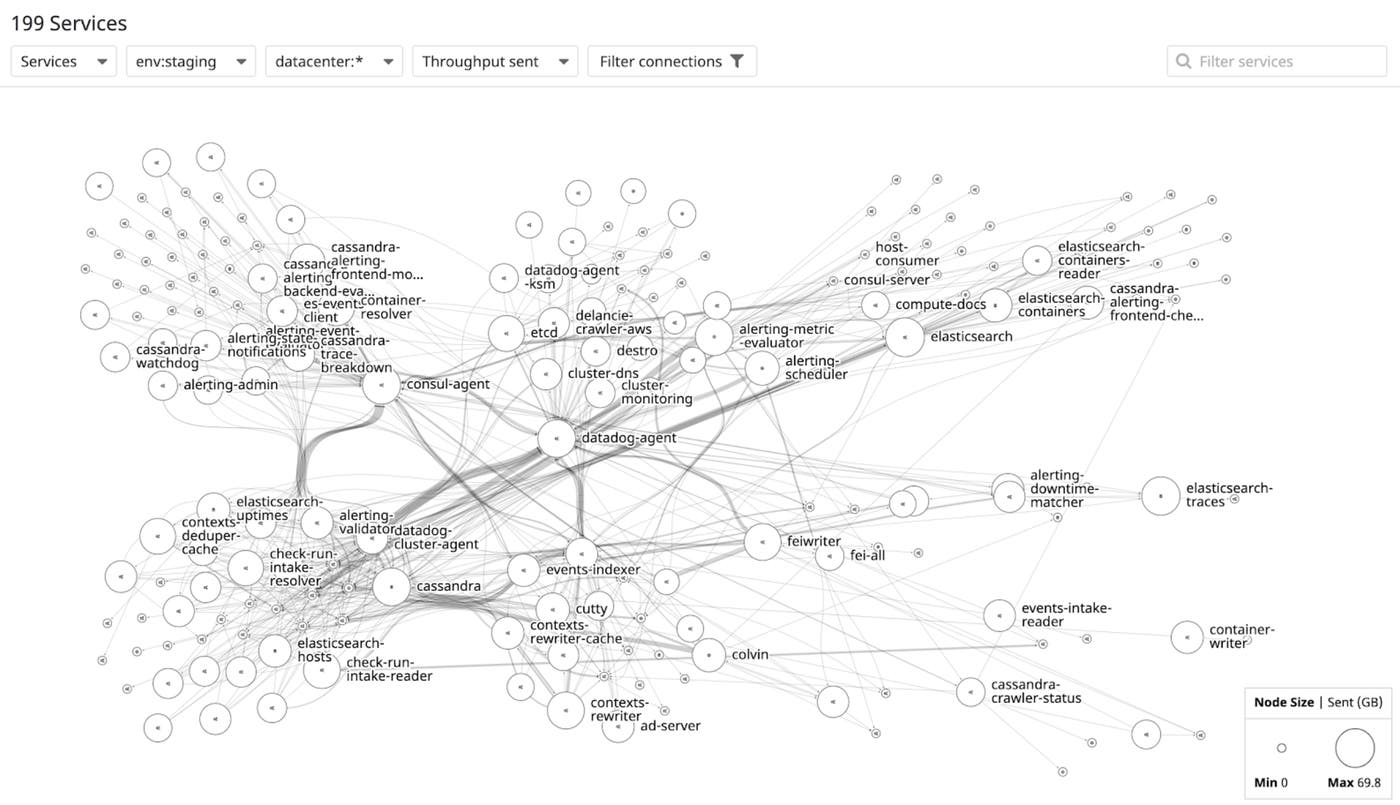
Datadog Network Performance Monitoring enables you to visualize the flow of network traffic in cloud-based or hybrid environments. It allows asymmetric searches and aggregations using any tag in Datadog—so you can track, for instance, if a particular service is sending traffic across availability zones, or if retransmit rates are high for traffic directed at a particular security group. Network Performance Monitoring is compatible with on-premise servers and all major cloud providers, and is extremely lightweight, so you can monitor the flow of network traffic without sacrificing performance. Read our announcement blog post here.
Mobile Application
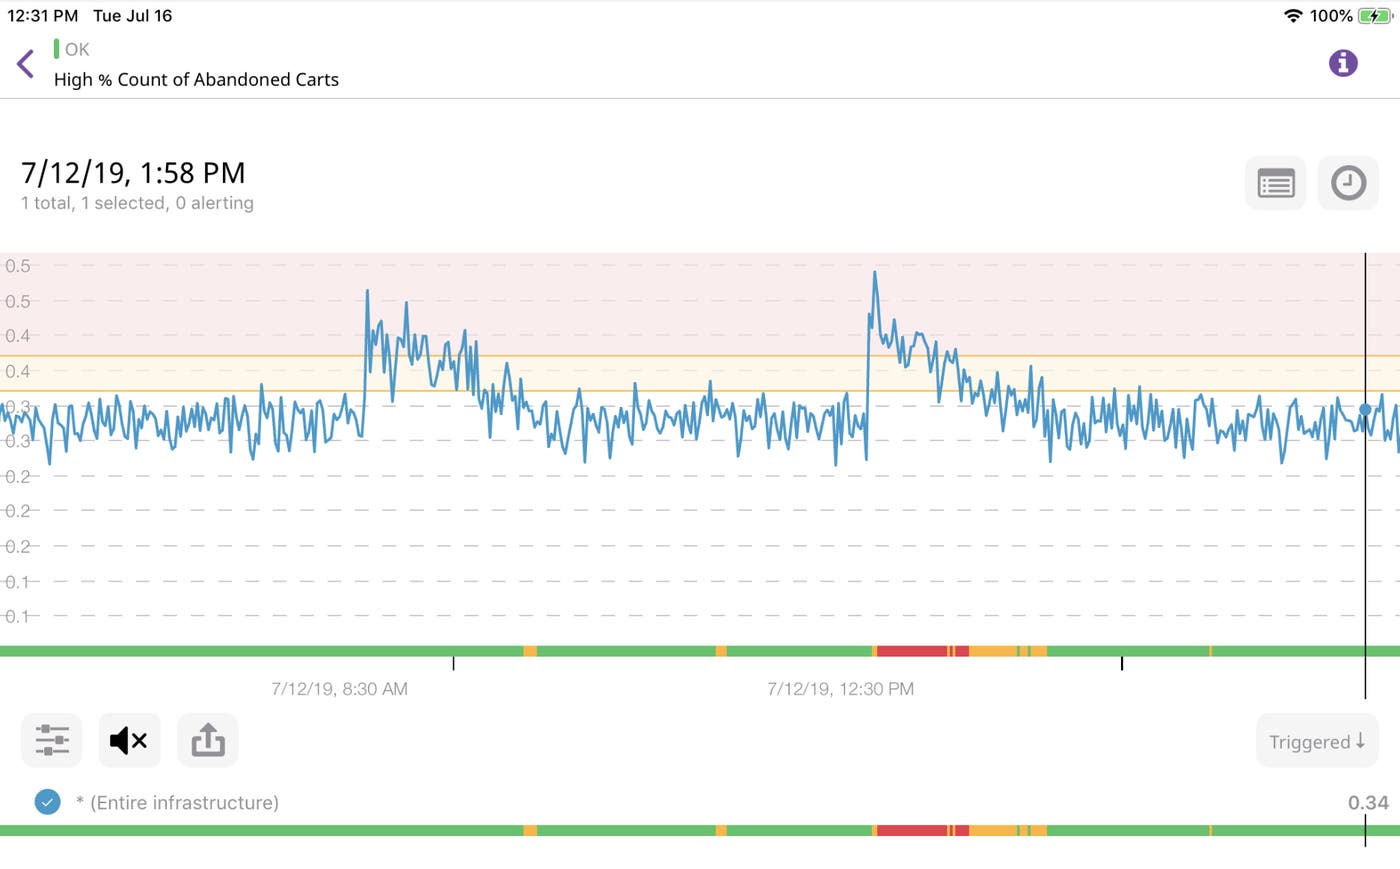
Datadog now offers a mobile app to make it easier to triage issues when you’re on call or on the go. When you receive an alert or a page, you can jump right into the relevant dashboards right from your mobile device. The mobile app is currently in beta, and you can request access here.
Real User Monitoring for mobile applications
Mobile RUM provides visibility into your end users’ experience on your mobile applications. In Datadog, you can correlate data about how your customers are using your mobile applications to the corresponding backend traces, infrastructure-level metrics, and logs when troubleshooting performance issues. Sign up for more information here.
Real User Monitoring
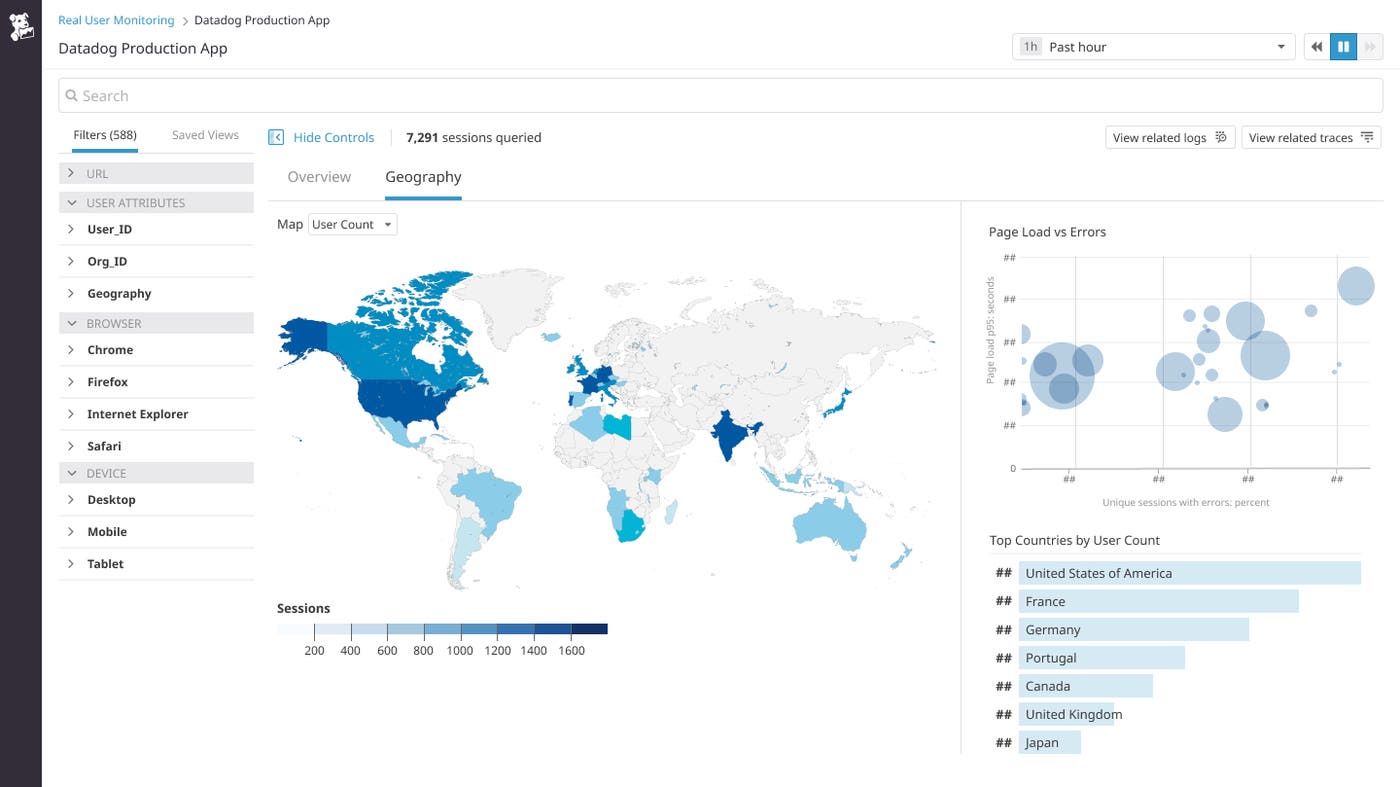
Real User Monitoring (RUM) enables you to visualize and analyze the performance of your frontend applications as seen by your users. Understand how to improve your users' experience by following the latency from the frontend to the backend. Advanced visualizations of real user data, like the one below, allow for quick and actionable insights. Like all other Datadog products, Real User Monitoring data can be correlated with your application traces, infrastructure-level metrics, and logs to quickly troubleshoot performance issues. RUM is generally available, and you can learn more about it in our RUM blog post.
Private locations for Datadog Synthetics
With the availability of private locations within Datadog Synthetics, you can now proactively monitor internal-facing applications or any private URLs that aren't accessible from the public internet. These private locations can also be used to create synthetic data centers in the locations that matter most to you, such as offices, call centers, or warehouses, regardless of whether Datadog hosts synthetic locations there. Setup involves an easy installation of a “synthetic worker” on your infrastructure. Your custom private location then appears on the Datadog Synthetics UI, alongside the other Datadog-hosted locations, and enables the full-stack visibility of your frontend requests with the additional, correlated context of your backend traces, metrics, and logs. Private locations is now generally available, and you can read more about it in our blog post.
Log Rehydration™
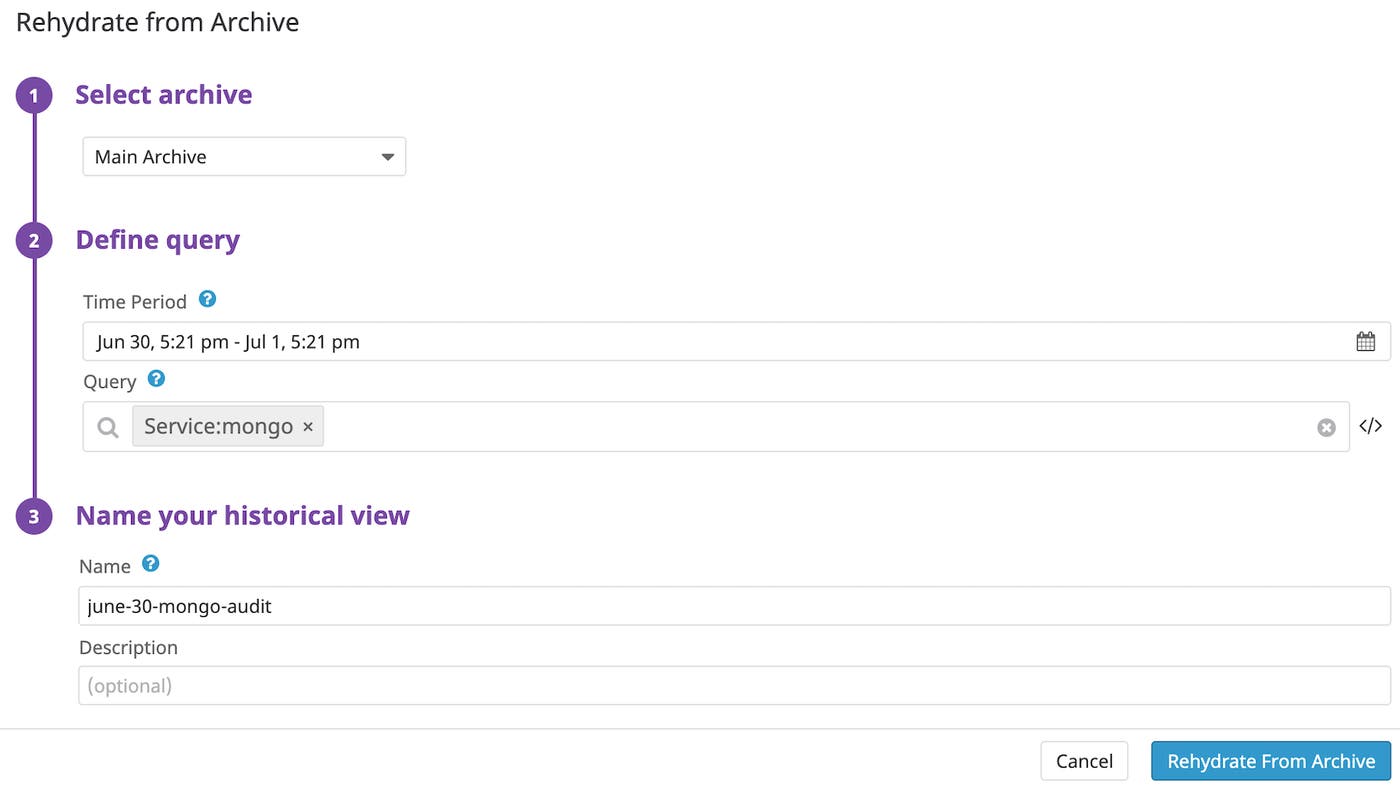
Datadog customers can now reload any archived logs into Datadog on demand using Log Rehydration™. This new capability allows customers to confidently archive significant portions of their logs, knowing that log data can be loaded, indexed, and analyzed quickly if it is needed in the future. This allows customers to dramatically reduce the cost associated with managing high-volume logs that need to be stored for a variety of audit and compliance reasons, but are unlikely to be accessed often. Sign up for access here.
Metrics from Logs
Datadog customers can now generate custom metrics from all ingested logs. Custom metrics are especially useful for summarizing logs from sources that generate a massive volume of data (e.g., web access logs). With this new feature, users can create and update metrics from real-time log streams at ingestion. Since the individual logs have a lower value, users can benefit from summarizing aggregate views in custom metrics that capture number of requests, users, average duration, and the number of errors. These metrics are retained in Datadog and available for 15 months at full granularity, providing analytics for many business and technical uses without the associated costs of log indexing and retention. You can start generating metrics from logs here.

Watchdog for Infrastructure Metrics
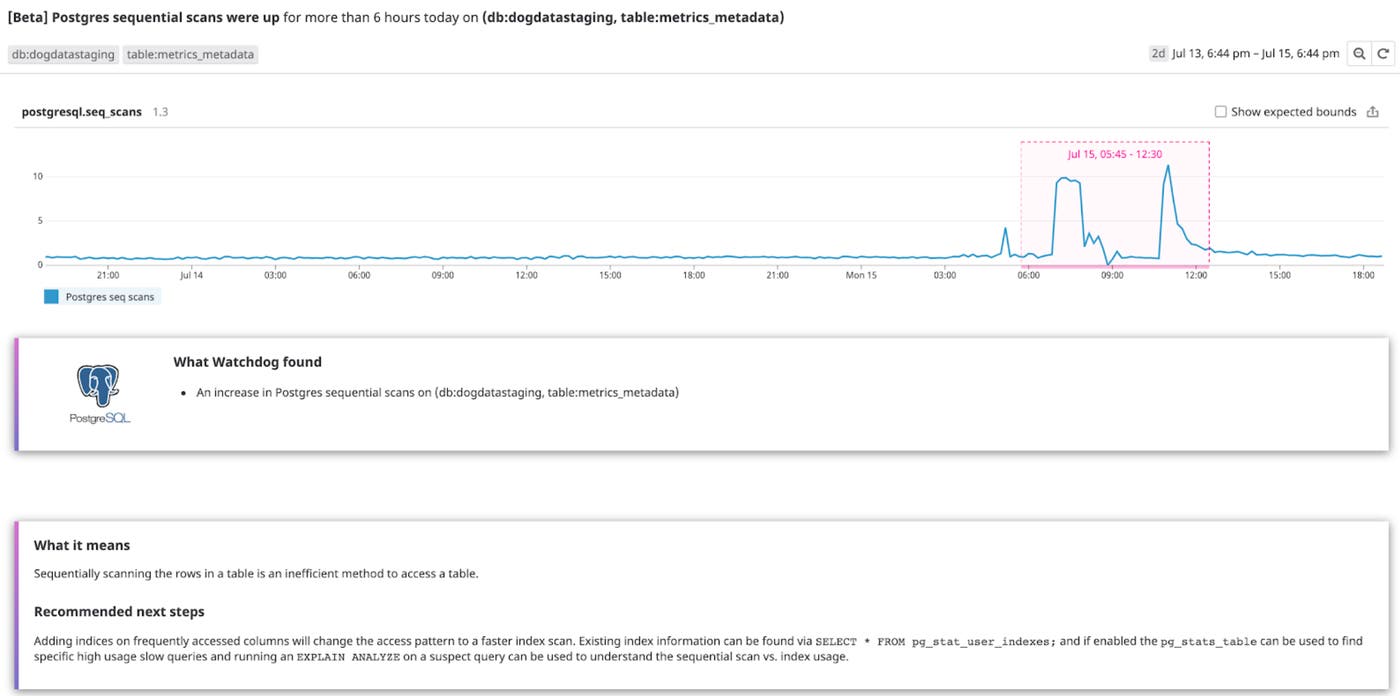
Watchdog now automatically surfaces anomalies within your infrastructure and integration metrics, in addition to your APM metrics. The anomalies are then intelligently grouped into related stories based on tags and the timeframes when they occurred. You can configure alerts based on any of the story types, so you can quickly discover anomalies anywhere in your environment. The interest form for the beta is available here.
Metric Correlation
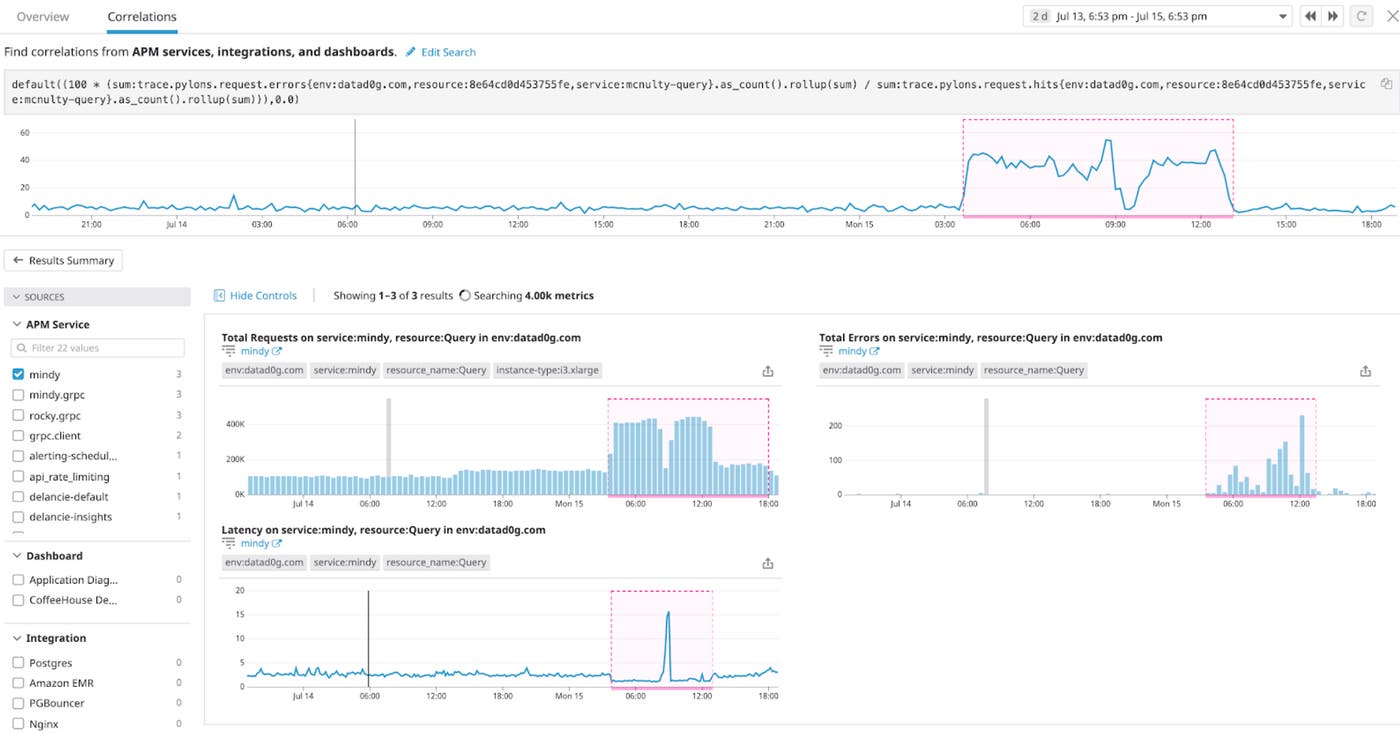
To help reduce the time it takes to understand the root causes or downstream effects of complex issues, Datadog now offers automated metric correlation. Just select any metric exhibiting an unusual trend and Datadog will search for other metrics that show similar patterns. Metric correlation is in beta; you can express interest here.
Metrics without Limits™
Metrics without Limits™ allows Datadog customers to send custom metrics with unlimited cardinality tags, while providing controls to manage and aggregate those metrics before storage. This allows customers to access more of the custom metrics that matter to their business and maintain greater control over which metrics are indexed in Datadog. Sign up for more information here.
Tracing without Limits™
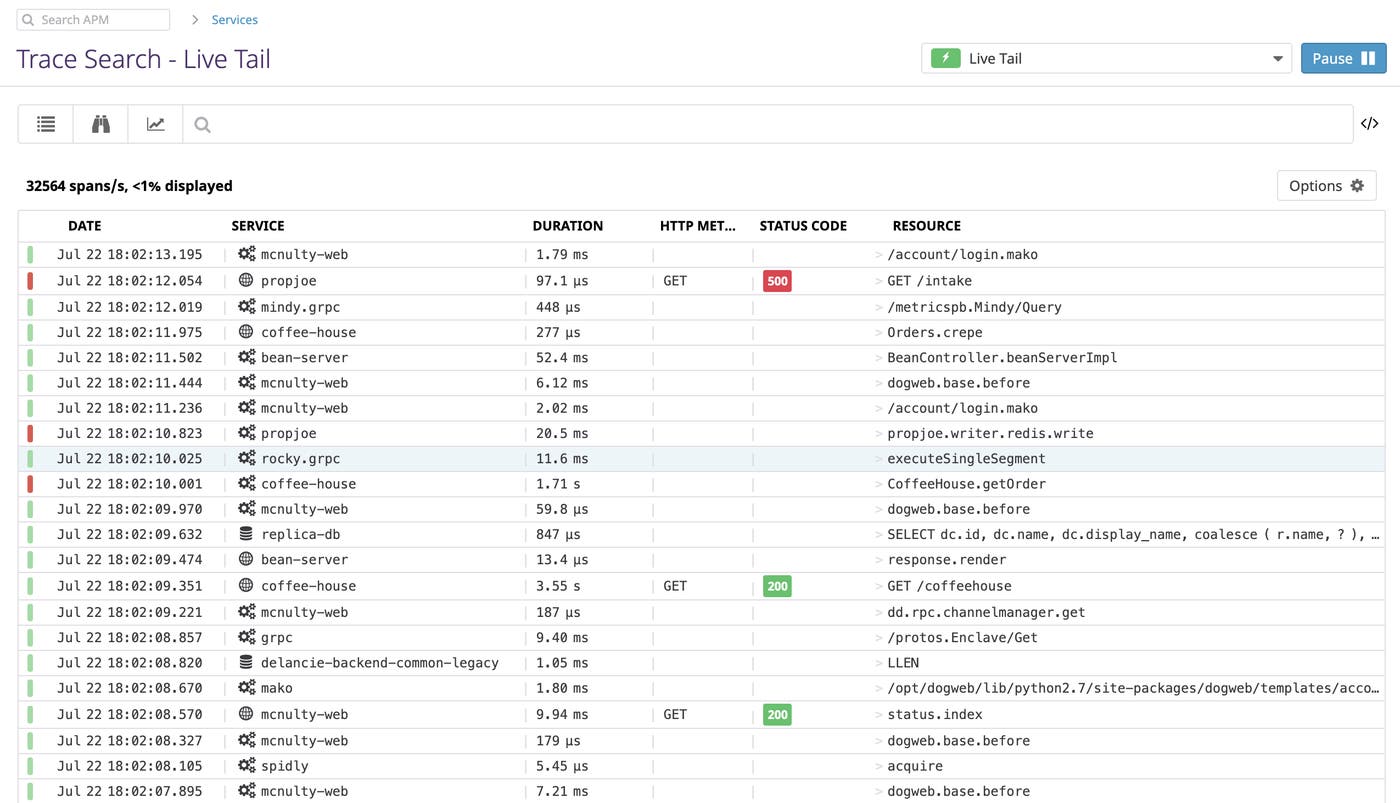
Tracing without Limits enables customers to send all their traces to Datadog, query them live, and retain the most important traces without sacrificing visibility or live-querying capabilities. Traditional APM products sample traces at the start of their lifecycle (head-based decisions), leading to incomplete or missing traces for errors or high-latency requests, when trace data is most valuable for troubleshooting. In the Tracing without Limits approach, Datadog makes tail-based decisions at the end of the trace lifecycle to ensure that engineering teams have all the traces they need for troubleshooting critical application issues. In addition, users are empowered to decide which traces to retain based on business priority so that they can control costs without sacrificing visibility. Sign up for the beta here.
Trace Outliers
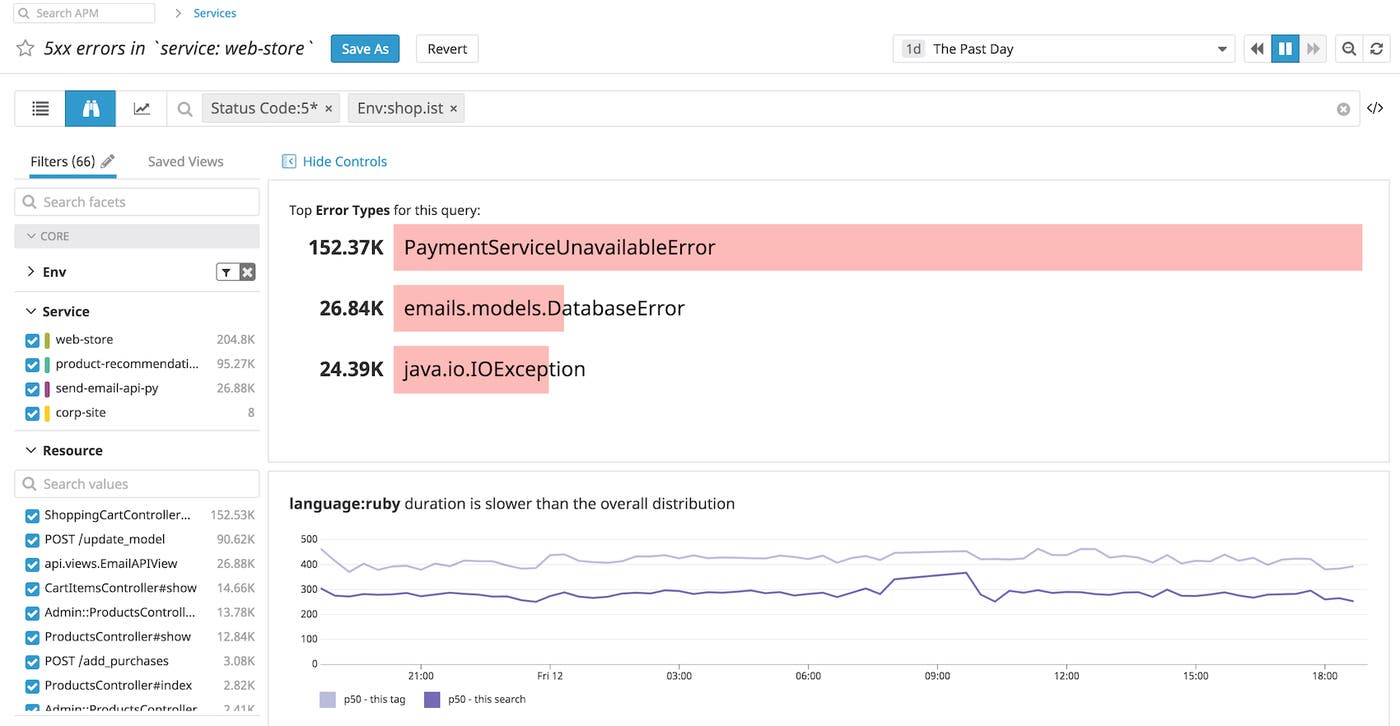
Trace Outliers allows customers to see the top errors without having to click into a single trace. With just one click, Datadog will automatically analyze all incoming traffic to tell customers if there are bad user experiences or suggest what the root cause could be based on tags that are correlated with errors and latency. Sign up for the beta here.
Scale up, speed up
If you weren't able to join us for Dash 2019, stay tuned for videos from the keynotes and technical talks to learn even more about Datadog's newest features and hear how companies like Hulu, Starbucks, and the New York Times are scaling up and speeding up. In the meantime, we hope these new features help you get even better visibility into your applications and infrastructure. If you aren't yet using Datadog, you can sign up for a 14-day free trial here.

