Natasha Goel

Jeremie Ponak

Guilherme Vieira Schwade
The dynamic nature of cloud costs can make it difficult to fully understand your cloud spend and embrace cost ownership at all levels of your organization. To establish cost governance, FinOps teams need a complete view of cloud costs, including allocation by team, service, and product. And DevOps teams need to detect, investigate, and quickly mitigate unexpected costs to minimize overruns, even as they continue to build features and operate their services.
Datadog Cloud Cost Management provides deep visibility that allows teams to understand cloud spend and ensure the cost efficiency of each service. Now, you can use Cost Monitors to proactively detect unexpected cost changes, provide FinOps staff with a complete view of cloud costs, and empower engineers to quickly mitigate cost inefficiencies.
In this post, we'll show you how you can:
- Quickly detect and act on unexpected changes in your cloud costs
- Create monitors that notify you about the most significant cost increases
- Ensure that your cloud resources are tagged properly for complete cost allocation
- Automate your response to increasing costs by triggering orchestrated changes to your cloud environment
Detect and act on unexpected cloud cost increases
As DevOps teams build and operate services, they need to detect and mitigate anomalous cost increases in those services as quickly as possible. But they often don't have time to watch cost management dashboards and analyze cost data to distinguish meaningful changes from ordinary cost fluctuations. Cost Monitors for Datadog Cloud Cost Management help empower teams to own the costs of their services by proactively notifying them when costs increase unexpectedly, so that engineers can investigate and reduce the increase before it causes a significant cost overrun.
Cost monitors can automatically alert you if the difference in your cloud costs—overall, or broken down by team, service, or product—from one period to the next (e.g., month over month) exceeds a specified percentage. You can also configure cost monitors to alert you if the cost goes above or below a dollar amount over a specific period.
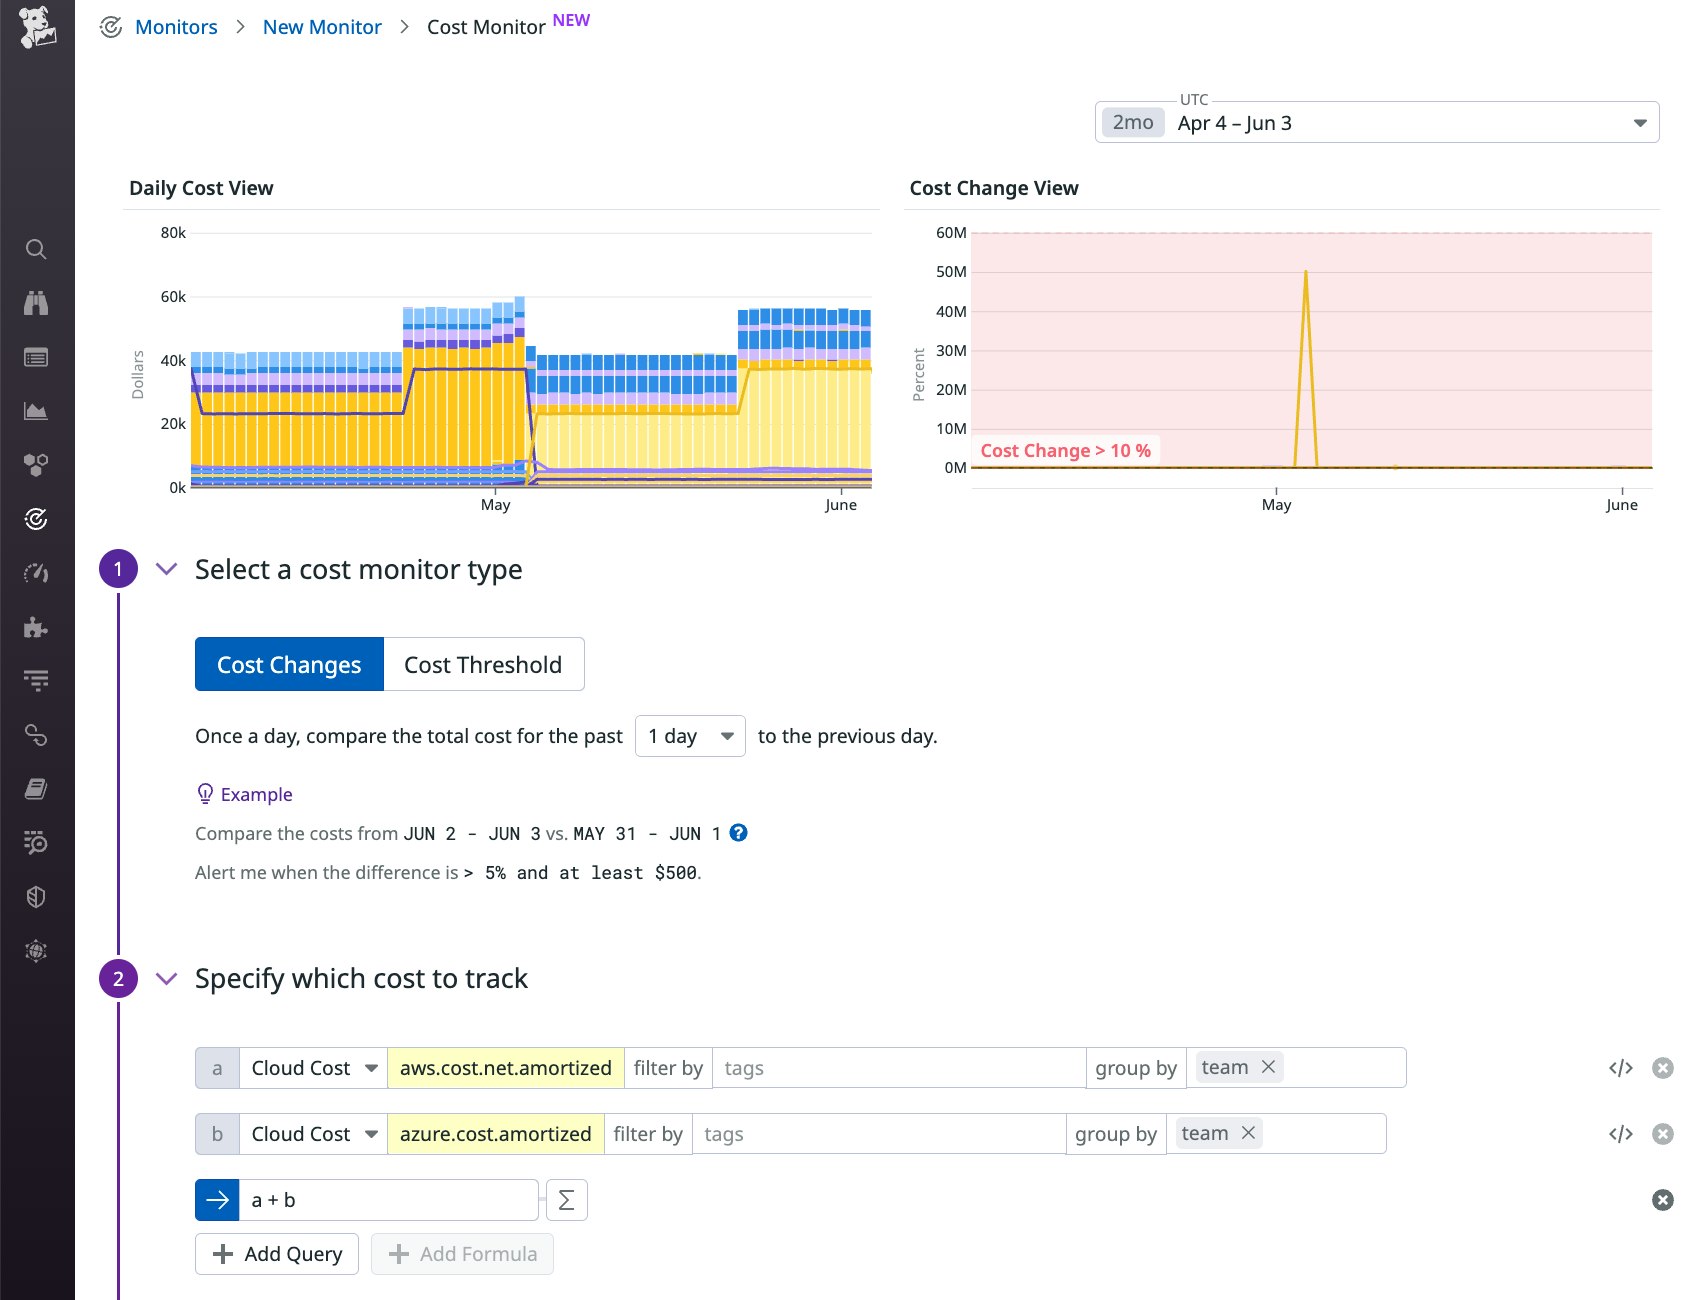
The monitor in the following screenshot tracks each day's combined AWS and Azure costs and triggers an alert if they are 10 percent higher than the previous day's costs. Grouping costs with the team tag allows you to track the costs of each team's resources individually with a single monitor. A monitor like this can use tag variables in its notification message—for example, {{team.name}}—to create a customized notification that displays the name of the team whose cost increase triggered the alert. With this information, the FinOps team can reach out to the appropriate engineering team to determine whether the cost increase is expected or whether it indicates that the team can make changes in their cloud infrastructure to get their spend back within the expected range.
You can also use tags to tailor individual monitors based on the different degrees of cost variance exhibited by different cloud resources. For example, Amazon Route 53 has a relatively static cost for organizations that use a constant number of hosted zones and see stable traffic patterns. Once you've ensured that all your hosted zones use a common tag, you can create a cost monitor to track the cost of those tagged resources and trigger on a small cost fluctuation—say, 5 percent—to quickly find out if a team has added a substantial number of new hosted zones. By leveraging tags to track the cost of specific resources or groups of resources—and tailoring the thresholds based on the anticipated costs for those resources—you can create monitors that are sensitive without being noisy.
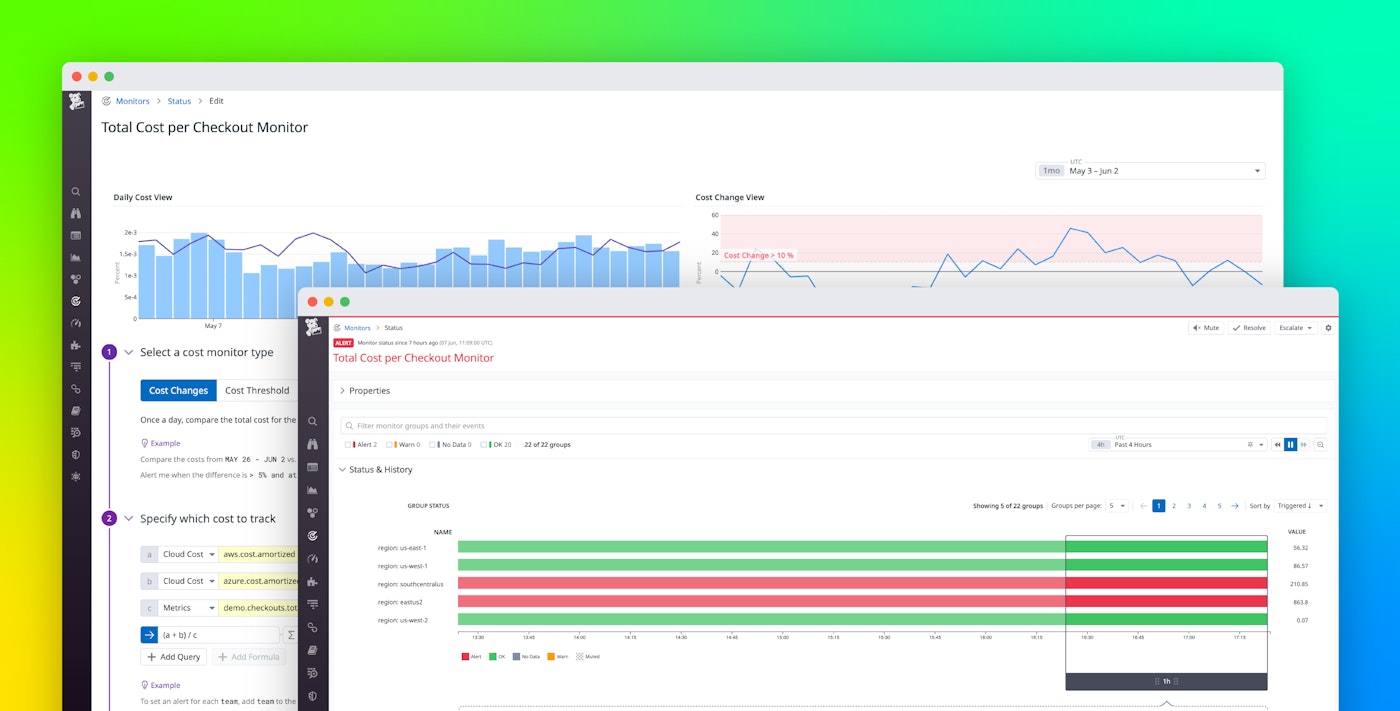
When an alert triggers, the notification message includes a link to the monitor status page where you can find detailed information, such as its history, which can help you determine whether the notification represents an ongoing issue.
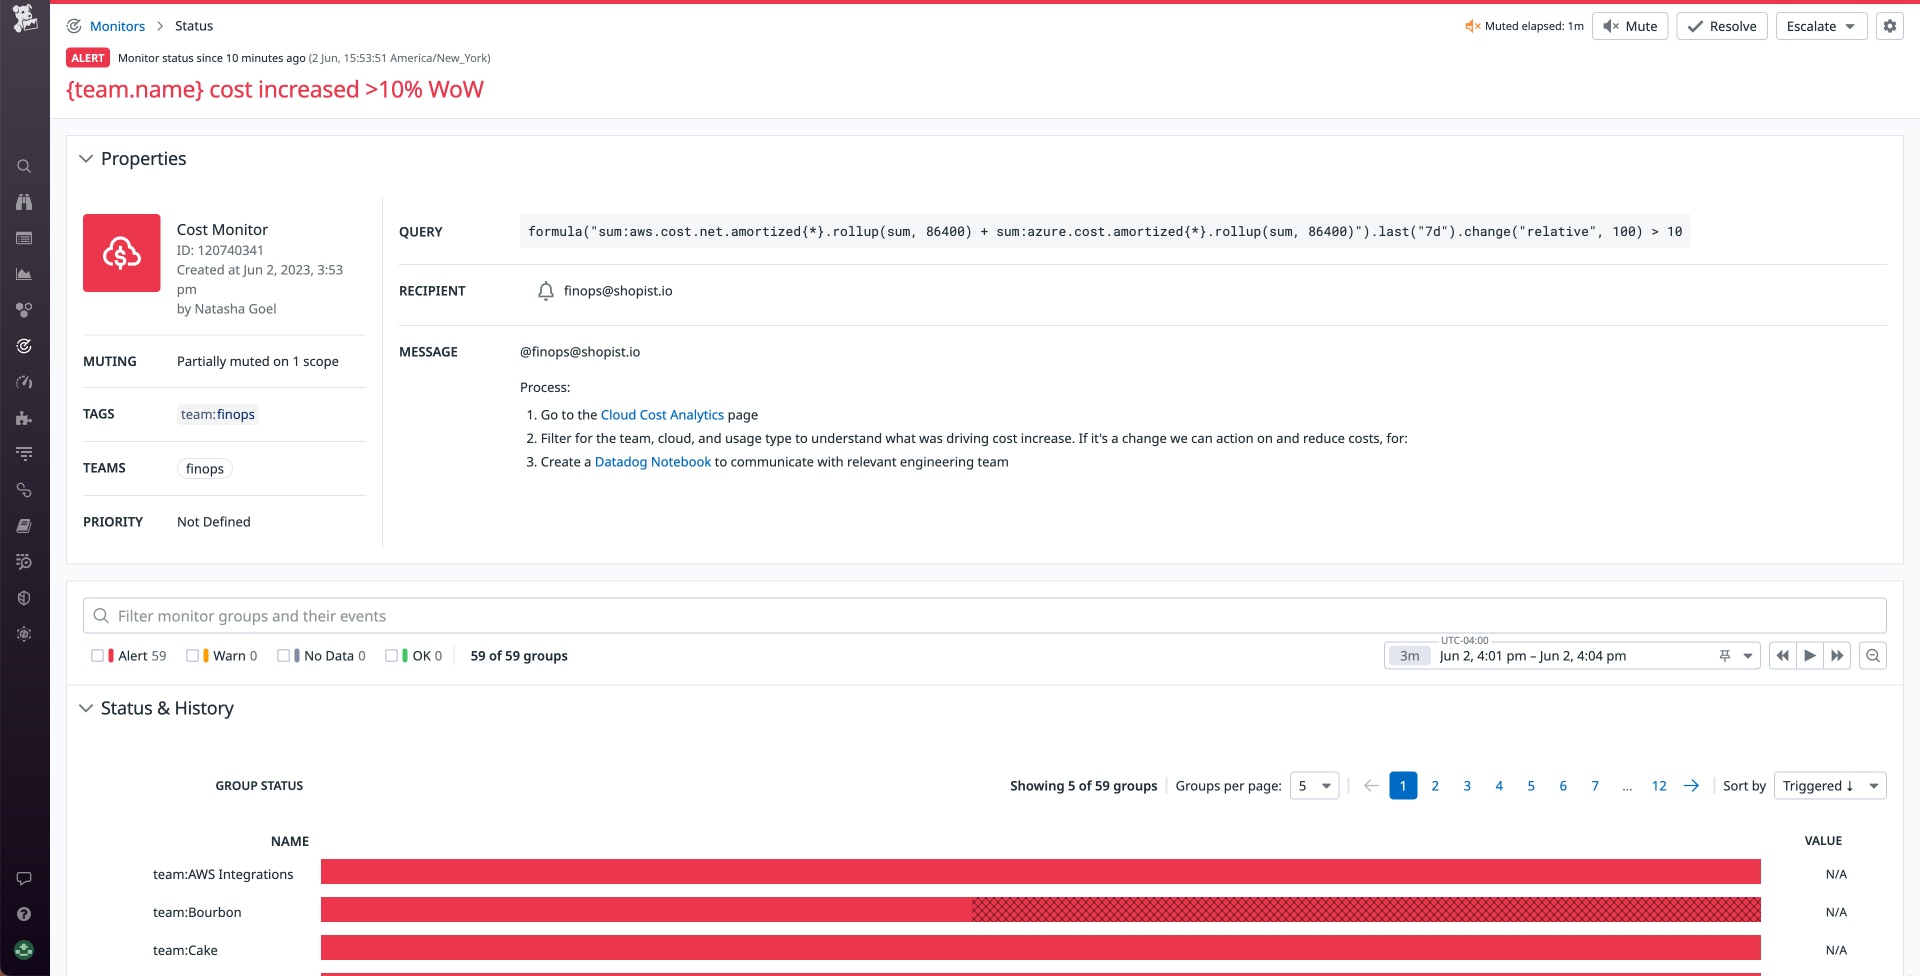
From this page, you can easily escalate the alert to an incident. You can pivot to the Cloud Cost Analytics page to investigate the service's infrastructure and cost information from related services. Alternatively, you can use the buttons on this page to mute or resolve the alert if it doesn't need further investigation. And to prevent alert fatigue, you can also schedule recurring downtime for the monitor to ensure that teams are notified only during working hours.
Focus on significant dollar amounts
For resources that incur a low cost, even large, percentage-based cost changes could end up being small in terms of absolute cost. For example, in the case of a resource that costs $250 per month, an 80-percent cost increase would result in an addition of just $200. But if a resource with a monthly cost of $100,000 were to see an increase of just 20 percent, it would add $20,000 to your cloud bill.
To avoid overly sensitive cost monitors, you can filter out small dollar amounts to alert only on changes that contribute significantly to your cloud costs. The monitor shown below tracks an e-commerce application's AWS cost per checkout, using a custom metric. It will trigger an alert if costs rise by more than 10 percent compared to the previous week, but only if that increase is greater than $100.
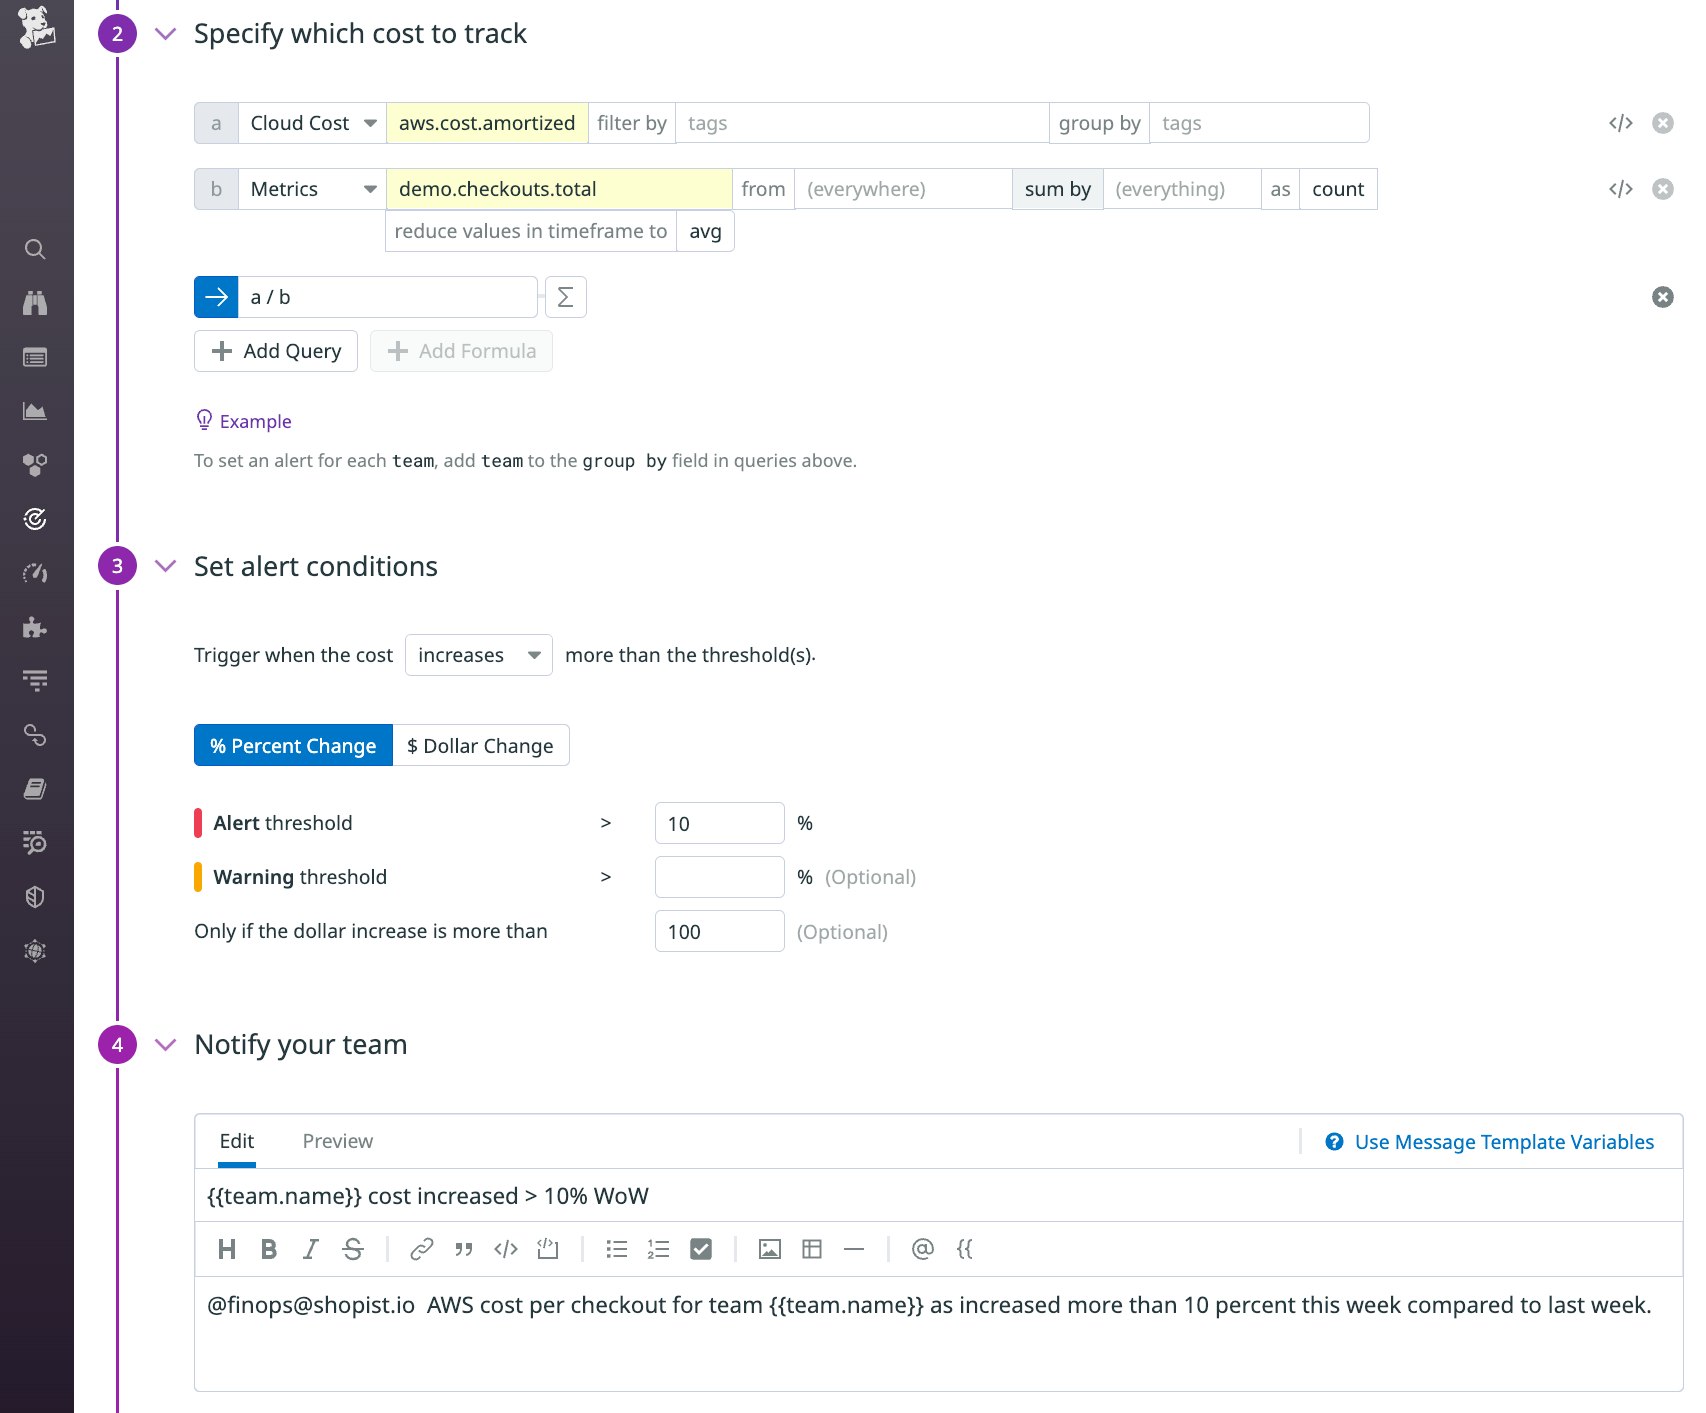
Filtering out small dollar amounts gives you fine-grained control over the behavior of your cost monitors, so your teams can focus on what matters most and account for the typical usage patterns of different types of cloud resources. For example, if you tend to see fluctuations in costs of certain resources (such as serverless invocations or instances in your autoscaling groups) as the rate of requests rises and falls, you can create monitors that filter out small dollar amounts so you can only get notified to meaningful changes to your cloud bill.
Enforce standardized tagging with Tag Pipelines
To monitor cloud costs effectively, you need a complete and detailed view of how different services, teams, and products contribute to your overall spend. Tag Pipelines help you ensure that your cloud resources use standard tags that you can leverage in your monitors so that no resource's cost data slips through the cracks.
If every engineering team in your organization applies meaningful tags to the cloud resources they create, you can allocate based on those tags—for example, to track your cloud spend on different environments such as dev, staging, and production. But if teams don't implement the same set of standard tags—e.g., if one team uses the environment:dev tag while another uses env:dev—it will be difficult to analyze the true costs of your various environments. You can use Tag Pipelines to automatically apply standard tags and prevent gaps in cost allocation and alerting.
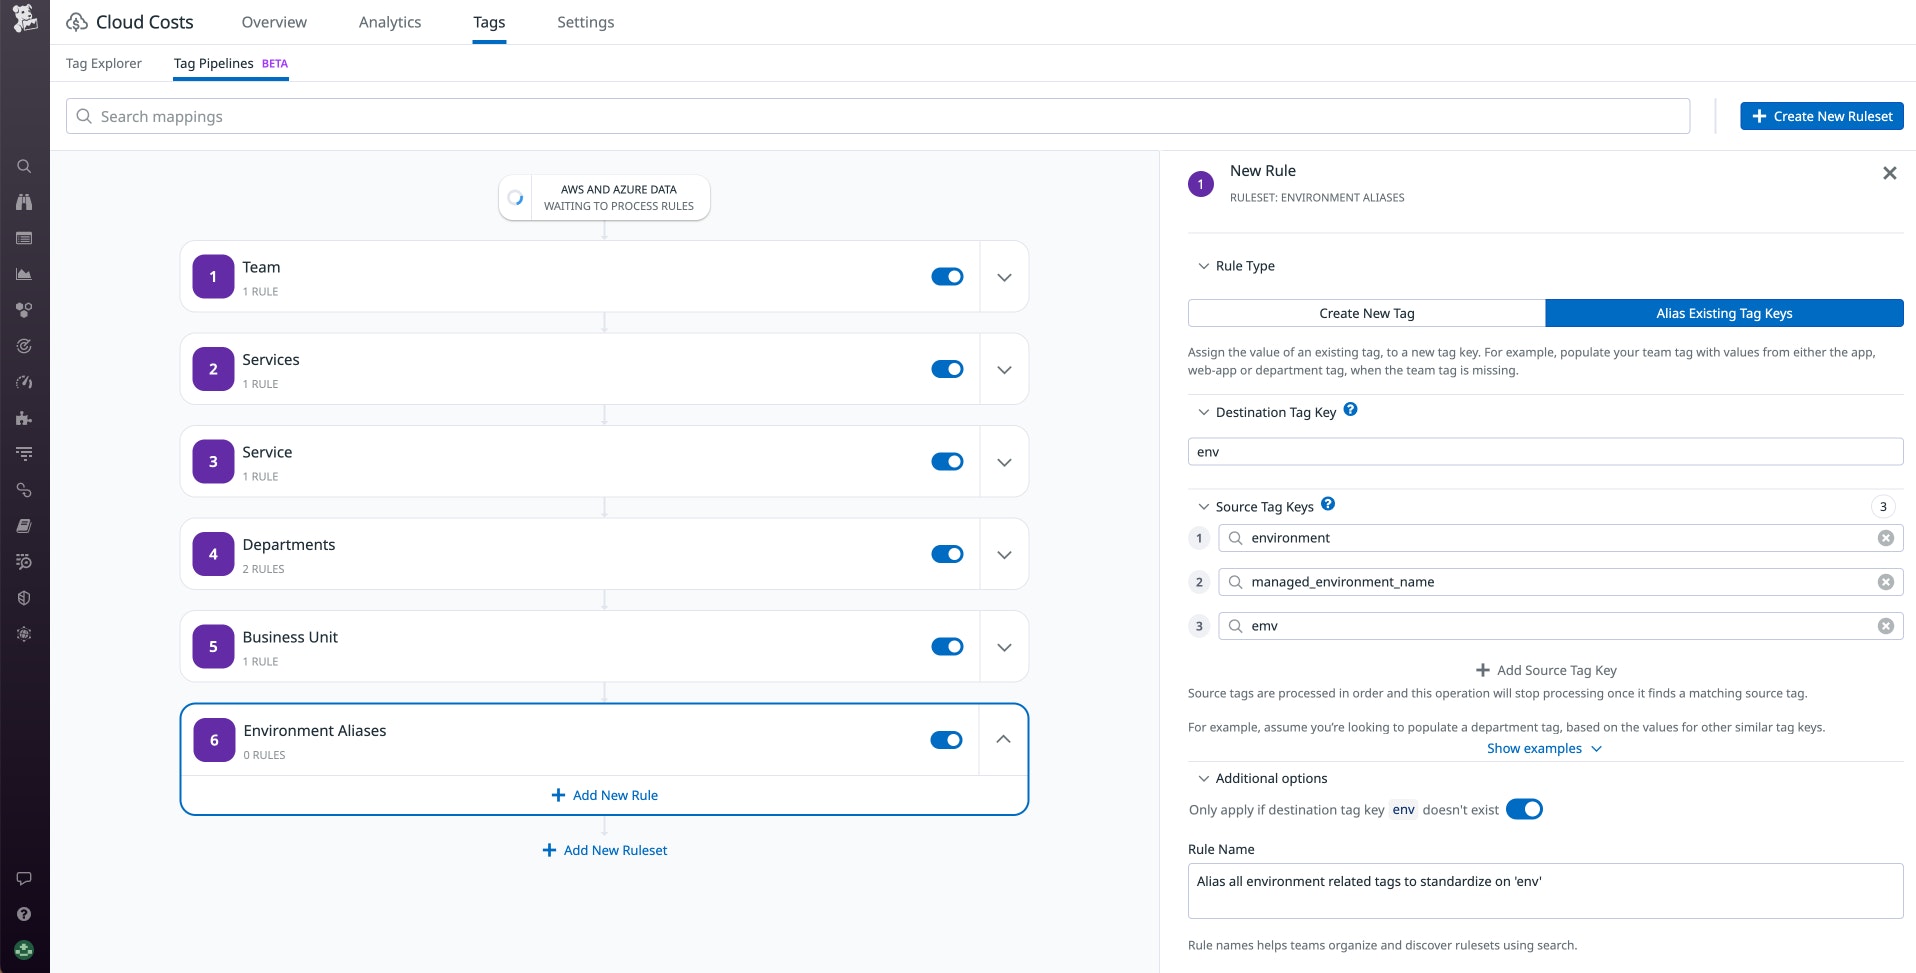
Each pipeline is made up of one or more rules. You can leverage a rule that automatically applies additional tags to any resources that have a specific tag. For example, a pipeline can help you ensure that all resources tagged service:web-store-service also automatically get a team:web-store tag. You can also apply a rule to automatically create an alias for an existing tag to ensure standardization. The rule shown below adds a standard env tag to any resource that has an environment or managed_environment_name tag. It will also detect a misspelled version of the standard tag (emv) and add the correct tag.
Quickly mitigate unnecessary costs with Workflow Automation
Cost monitors automatically deliver actionable cost information to FinOps teams, allowing them to collaborate with engineering teams to optimize their cloud usage and avoid unnecessary costs. To help your teams mitigate cost increases even more seamlessly, you can use Datadog Workflow Automation to take action when these monitors are triggered.
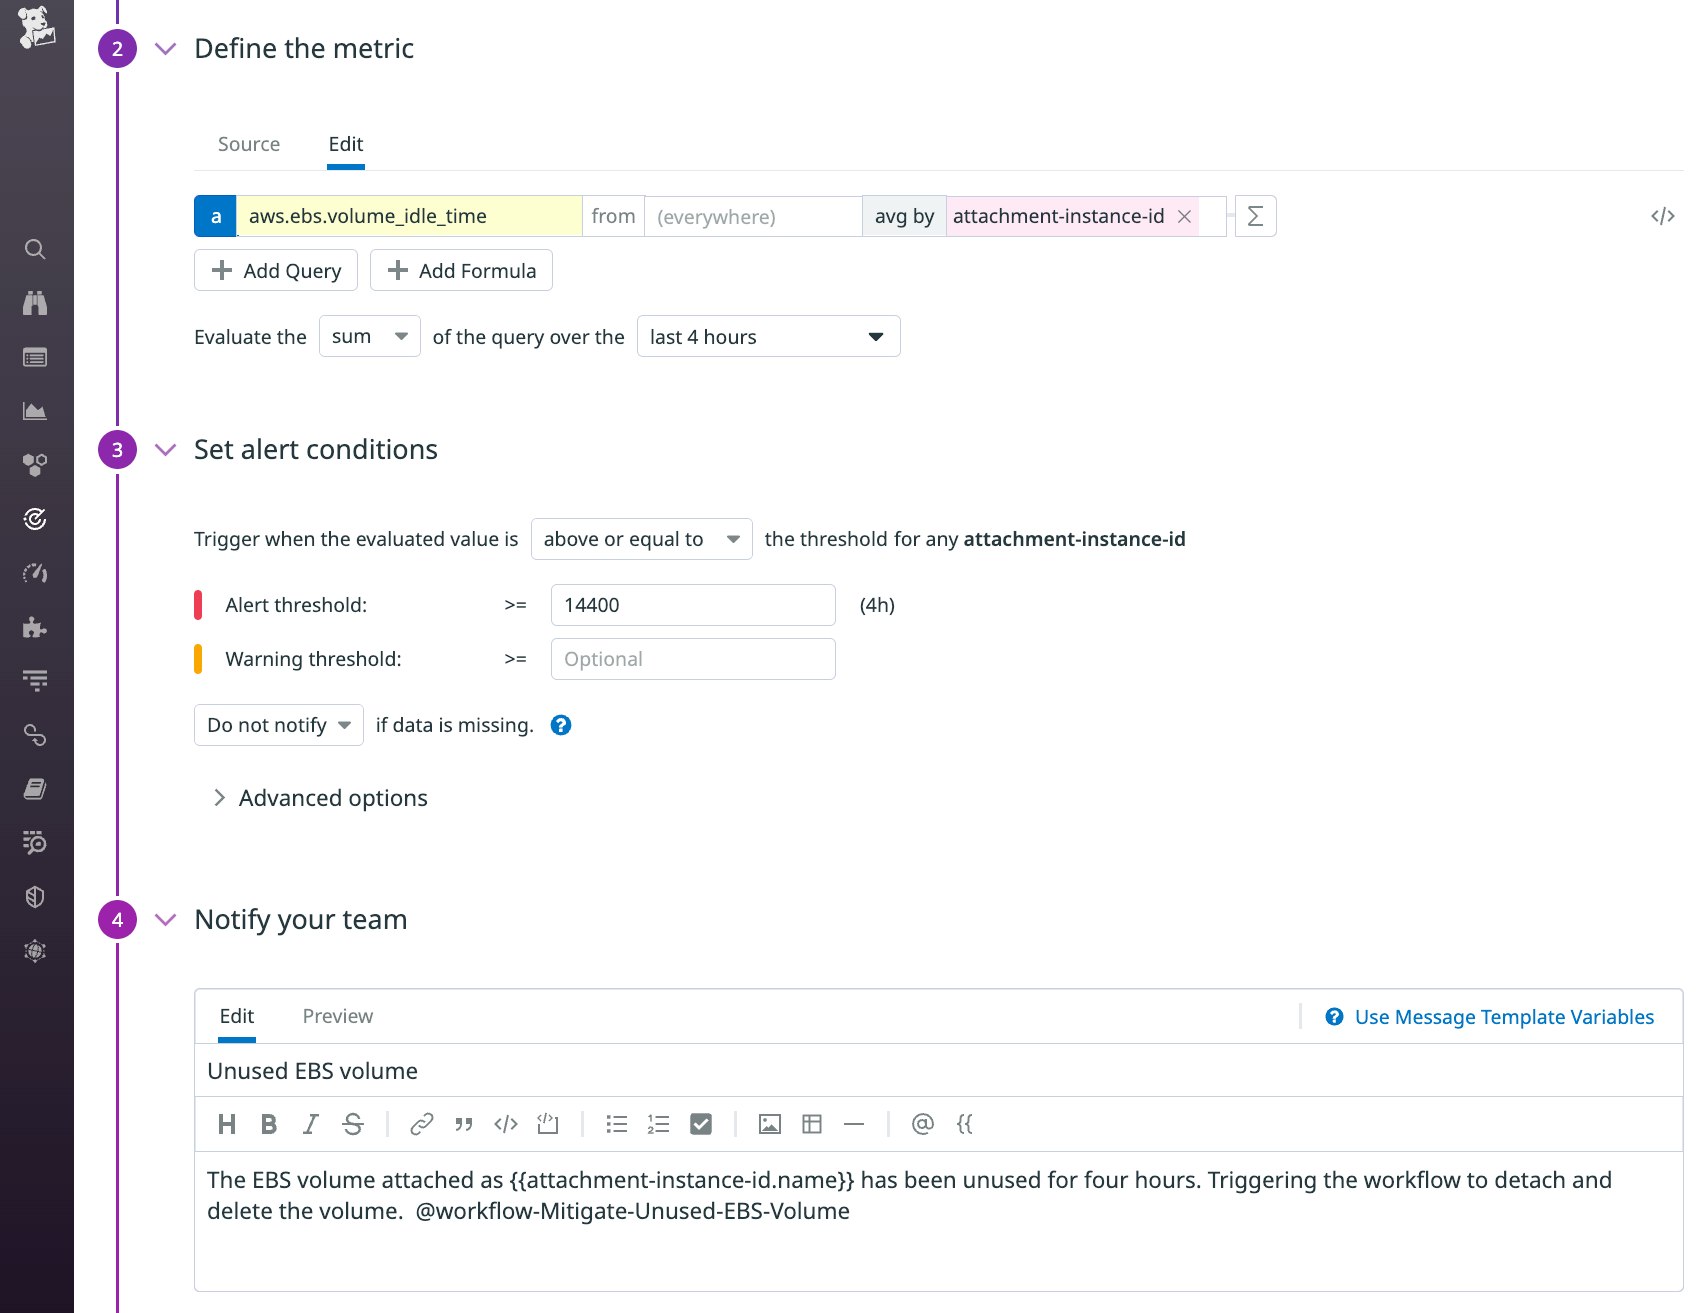
Together, monitors and workflows can automatically detect cloud resources that are incurring unnecessary costs and quickly remediate them to keep your costs in check. The screenshot below shows a metric monitor that detects when EBS volumes have been idle over the last four hours. If the alert triggers, it will automatically start the workflow referenced in the monitor ("@workflow-Mitigate-Unused-EBS-Volume"). This workflow automatically detaches and deletes an unused volume to mitigate the cost inefficiency. When the workflow starts, you'll be prompted to approve its automated actions, which will then execute the necessary changes that would otherwise require manual work and coordination between teams.
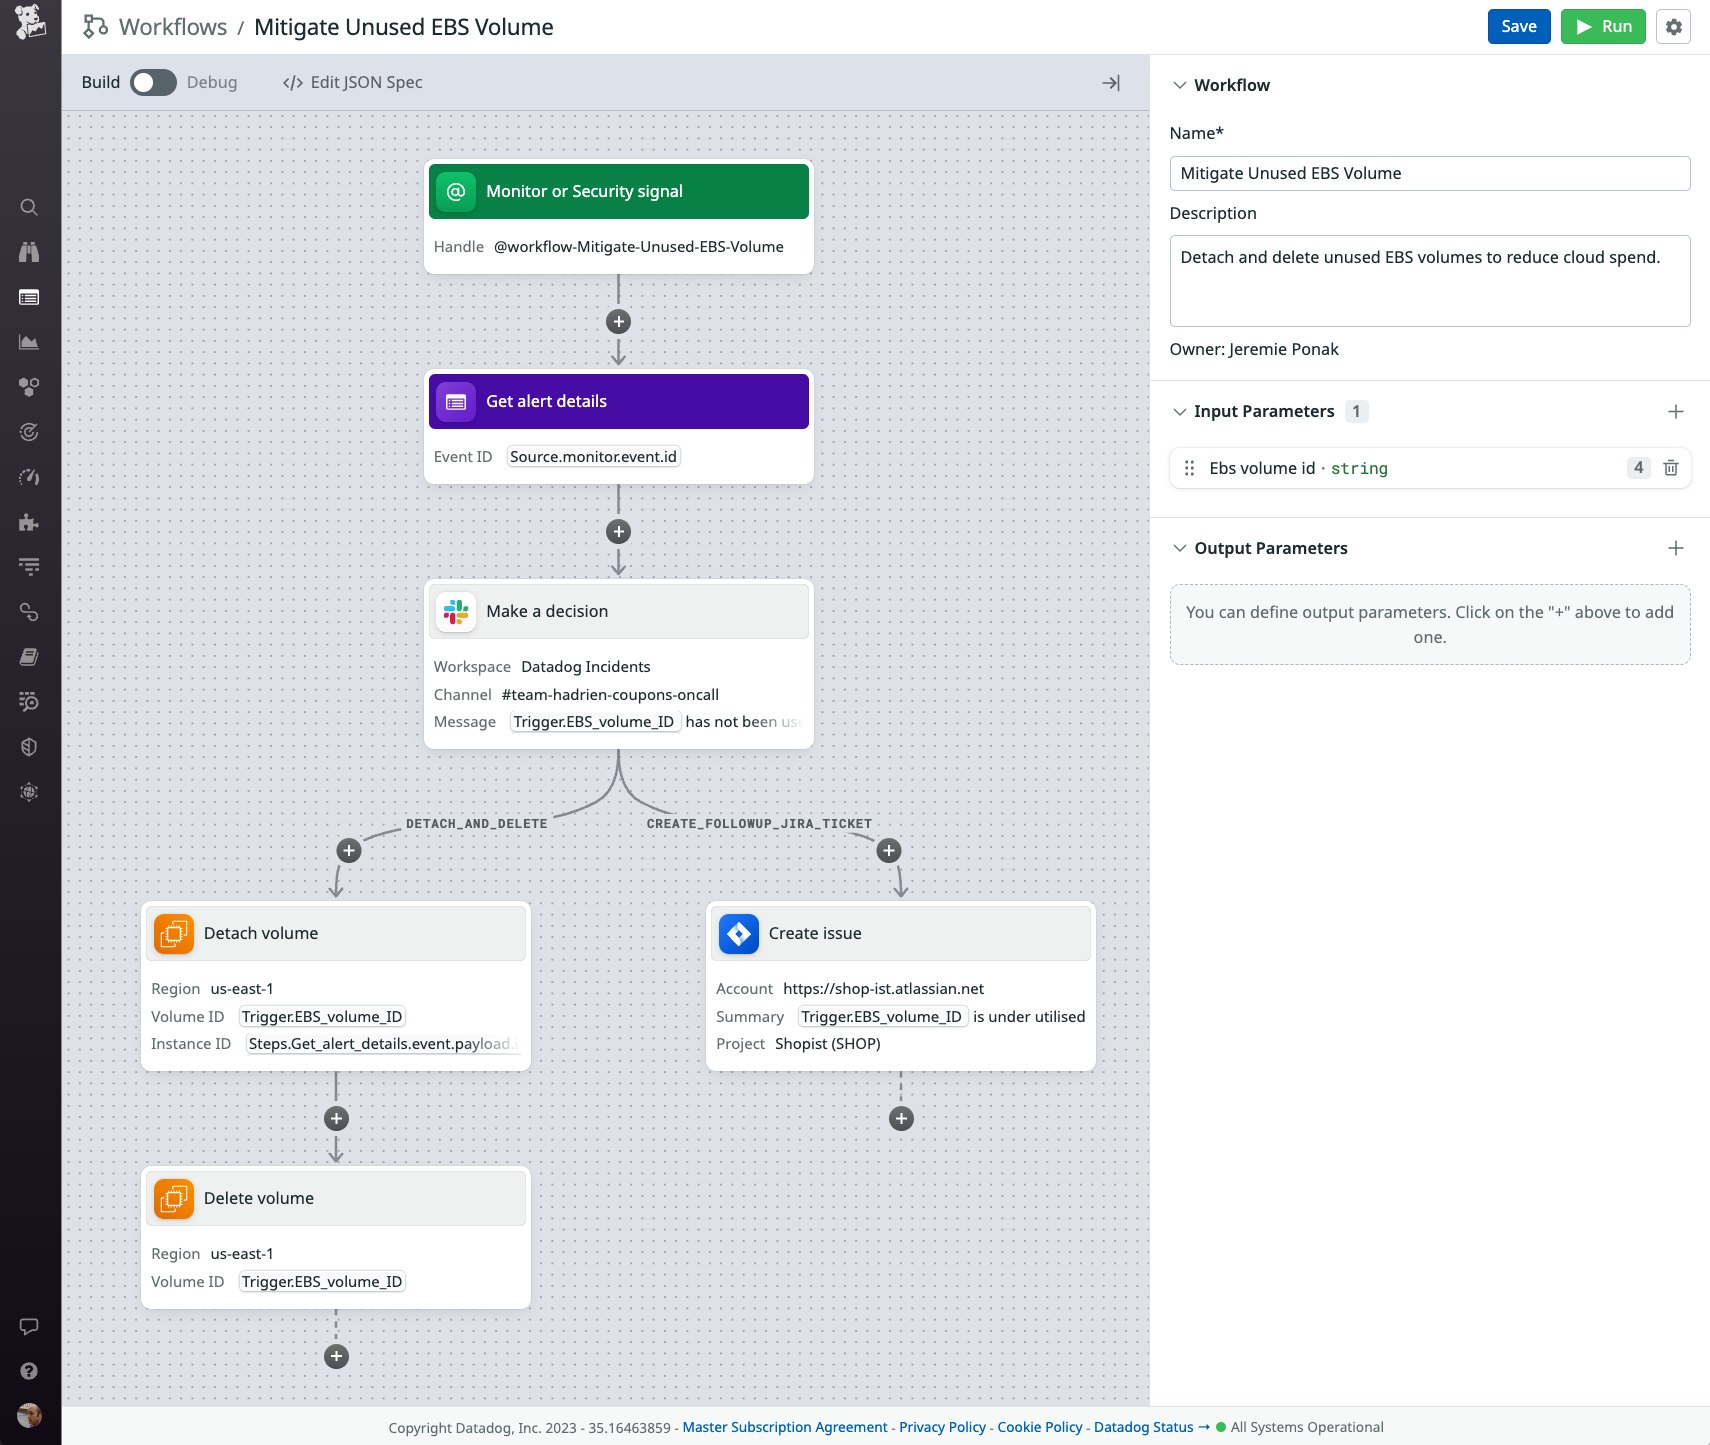
The workflow uses information in the monitor event—such as the ID of the idle EBS volume and the ID of the instance it's currently attached to—to automatically mitigate the issue. Before it takes action, it sends a Slack message to the relevant team—team-hadrien-coupons-oncall in the screenshot below. After someone from the team approves the action, the workflow detaches the volume and then deletes it. At the same time, it creates a Jira ticket that the team can use to investigate the root cause of the inefficiency in order to avoid it in the future. See the documentation for more information about how to trigger workflows from your monitors.
Count on Cost Monitors for complete cloud cost visibility
To minimize cloud cost overruns, you can rely on Cost Monitors for proactive alerting and granular visibility into your organization's cloud spend. To ensure that your monitors are tracking complete cloud cost data, you can enforce tag standardization with Tag Pipelines. And to quickly react to alerts, you can configure your monitors to trigger workflows that automatically mitigate cost inefficiencies.
See the documentation for information on getting started with Cloud Cost Management and Cost Monitors. If you're not already using Datadog, you can start today with a 14-day free trial.
